| Param | Original file | Final file |
|---|---|---|
| Filename | modeM0/AS1G08_071T01_9000001874_12591cztM0_level2.evt | modeM0/AS1G08_071T01_9000001874_12591cztM0_level2_quad_clean.evt |
| Size (bytes) | 526,648,320 | 99,731,520 |
| Size | 502.3 MB | 95.1 MB |
| Events in quadrant A | 3,314,597 | 652,373 |
| Events in quadrant B | 4,963,250 | 615,475 |
| Events in quadrant C | 3,307,070 | 667,380 |
| Events in quadrant D | 3,923,174 | 631,079 |
| Mode SS | |||
|---|---|---|---|
| Quadrant | BADHDUFLAG | Total packets | Discarded packets |
| A | 0 | 134 | 0 |
| B | 0 | 134 | 0 |
| C | 0 | 134 | 0 |
| D | 0 | 134 | 0 |
| Mode M0 | |||
|---|---|---|---|
| Quadrant | BADHDUFLAG | Total packets | Discarded packets |
| A | 0 | 14128 | 3 |
| B | 0 | 19156 | 2 |
| C | 0 | 14162 | 2 |
| D | 0 | 15972 | 2 |
| Mode M9 | |||
|---|---|---|---|
| Quadrant | BADHDUFLAG | Total packets | Discarded packets |
| A | 0 | 25 | 0 |
| B | 0 | 25 | 0 |
| C | 0 | 25 | 0 |
| D | 0 | 25 | 0 |
| Quadrant | Total seconds | Saturated seconds | Saturation percentage |
|---|---|---|---|
| A | 6505 | 83 | 1.275942% |
| B | 6505 | 728 | 11.191391% |
| C | 6505 | 81 | 1.245196% |
| D | 6505 | 204 | 3.136049% |
Noise dominated data is calculated using 1-second bins in cleaned event files. If a bin has >2000 counts, and if more than 50% of those come from <1% of pixels, then it is considered to be noise-dominated and hence unusable.
| Quadrant | # 1 sec bins | Bins with >0 counts | Bins with >2000 counts | High rate bins dominated by noise | Noise dominated (total time) | Noise dominated (detector-on time) | Marked lightcurve |
|---|---|---|---|---|---|---|---|
| A | 9026 | 6506 | 1 | 1 | 0.01% | 0.02% | 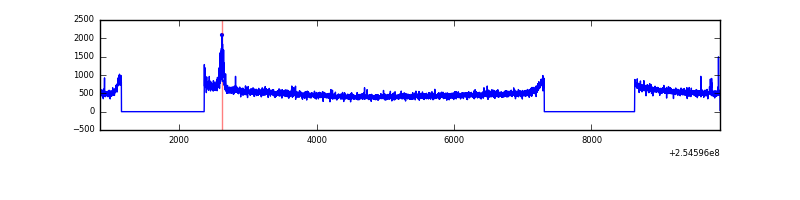 |
| B | 9026 | 6506 | 472 | 472 | 5.23% | 7.25% | 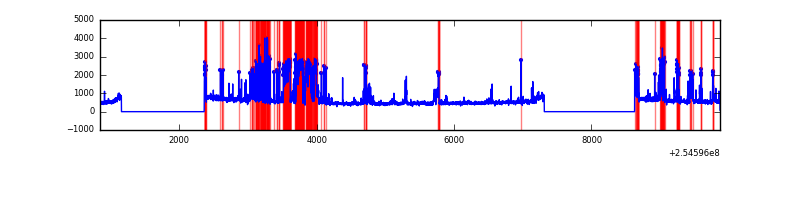 |
| C | 9026 | 6506 | 3 | 3 | 0.03% | 0.05% | 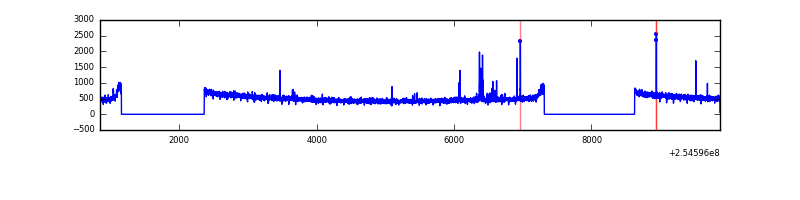 |
| D | 9026 | 6506 | 121 | 121 | 1.34% | 1.86% | 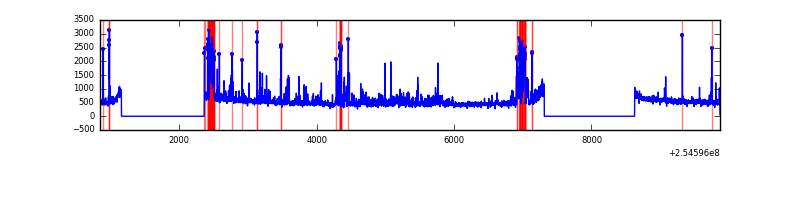 |
Top three noisy pixels from each quadrant. If the there are fewer than three noisy pixels in the level2.evt file, extra rows are filled as -1
| Pixel properties | Quadrant properties | ||||||
|---|---|---|---|---|---|---|---|
| Quadrant | DetID | PixID | Counts | Sigma | Mean | Median | Sigma |
| A | 5 | 112 | 61842 | 363.16 | 838 | 823 | 168.0 |
| A | 12 | 189 | 19785 | 112.86 | 838 | 823 | 168.0 |
| A | 12 | 96 | 10060 | 54.98 | 838 | 823 | 168.0 |
| B | 3 | 64 | 992950 | 6477.44 | 803 | 783 | 153.2 |
| B | 4 | 239 | 725361 | 4730.47 | 803 | 783 | 153.2 |
| B | 0 | 230 | 29699 | 188.78 | 803 | 783 | 153.2 |
| C | 14 | 234 | 42463 | 217.38 | 836 | 842 | 191.5 |
| C | 13 | 61 | 6114 | 27.53 | 836 | 842 | 191.5 |
| C | 5 | 96 | 2789 | 10.17 | 836 | 842 | 191.5 |
| D | 1 | 52 | 588666 | 3031.48 | 817 | 795 | 193.9 |
| D | 10 | 199 | 86349 | 441.17 | 817 | 795 | 193.9 |
| D | 13 | 104 | 78023 | 398.24 | 817 | 795 | 193.9 |
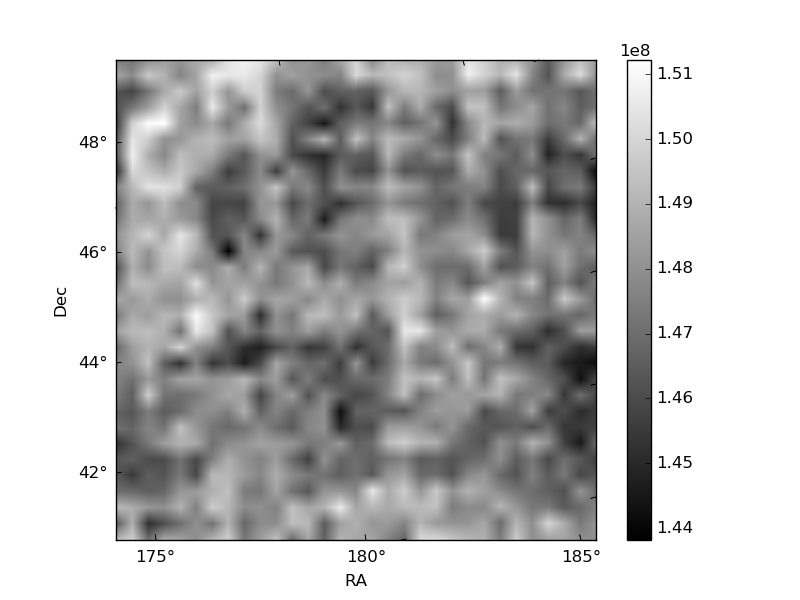
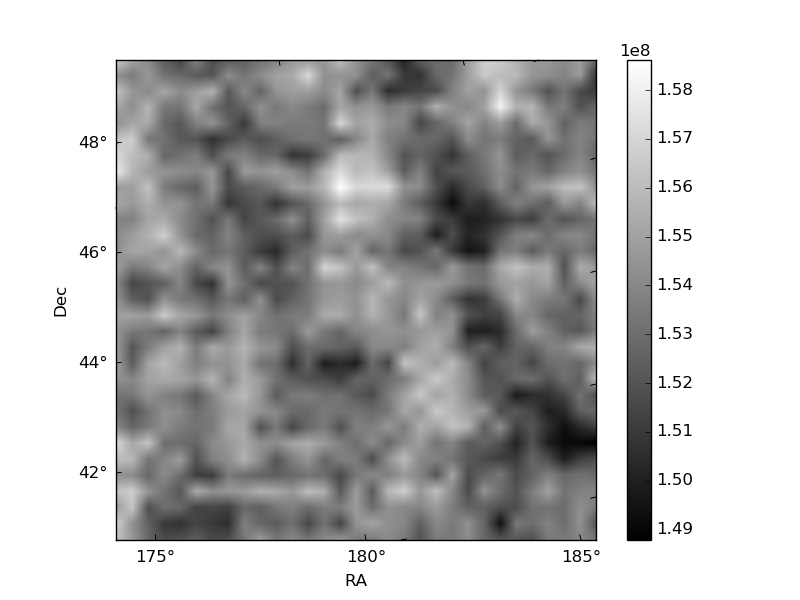
Histogram calculated using DETX and DETY for each event in the final _common_clean file
| Quadrant A | 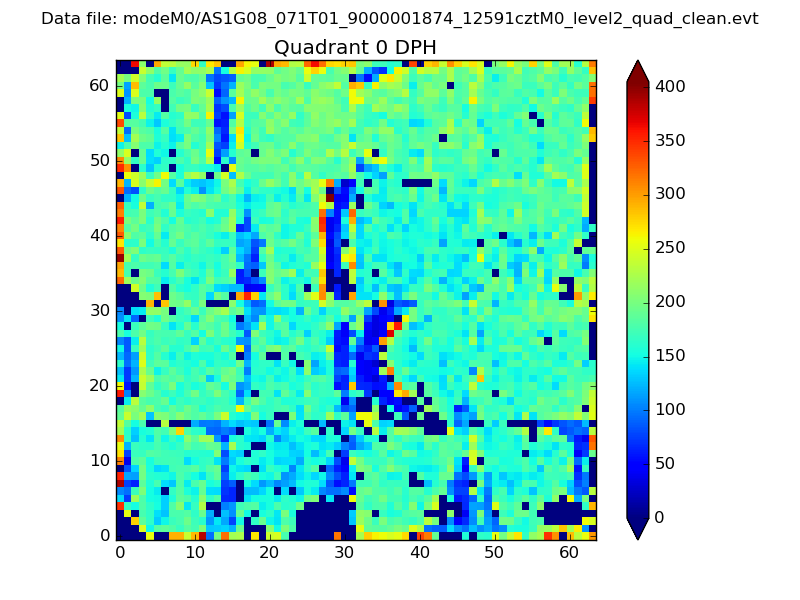 |
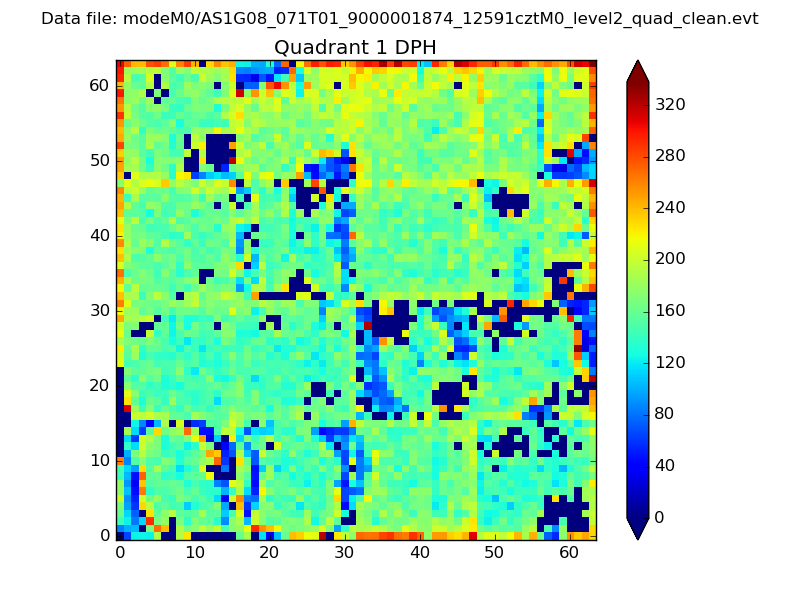 |
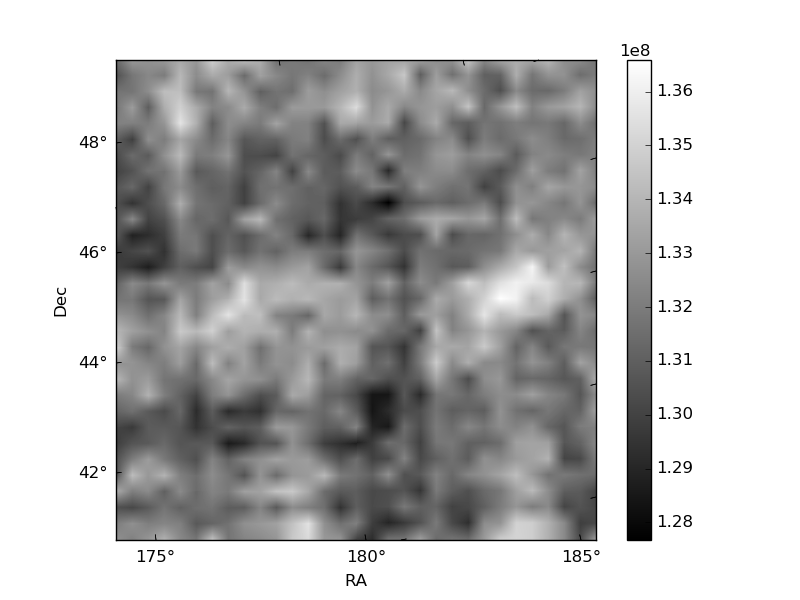
Quadrant B |
|---|---|---|---|
| Quadrant D |  |
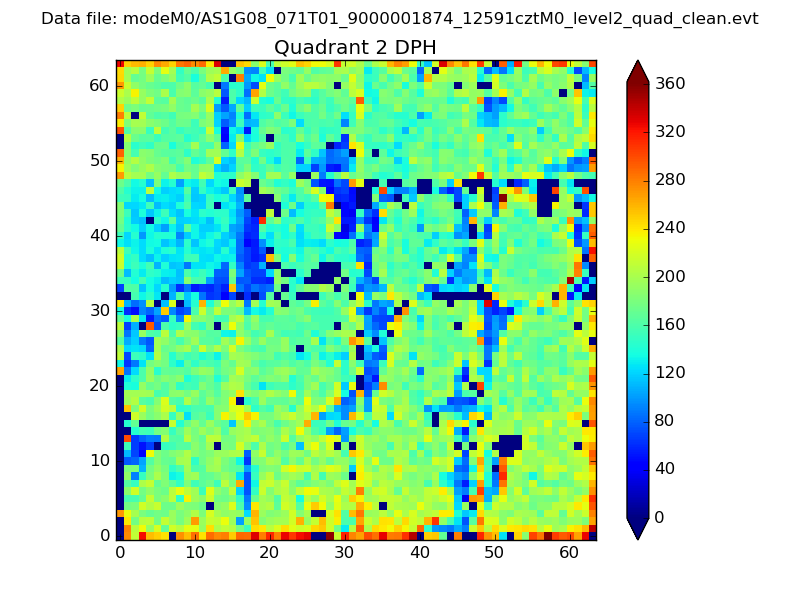 |
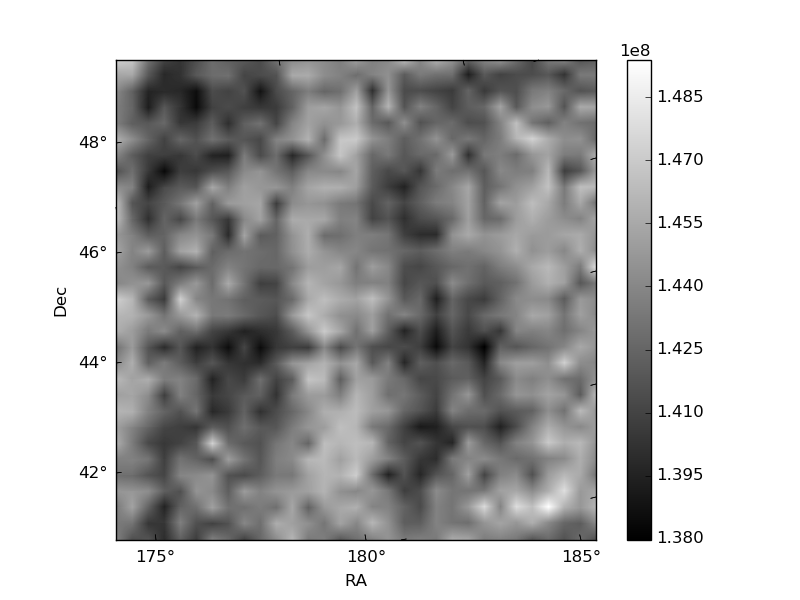
Quadrant C |
| Plot type | Count rate plots | Images |
|---|---|---|
| Comparison with Poisson distribution Blue bars denote a histogram of data divided into 1 sec bins. Red curve is a Poisson curve with rate = median count rate of data. |
 |
 |
| Quadrant-wise count rates Data is divided into 100 sec bins |
 |
|
| Module-wise count rates for Quadrant A Data is divided into 100 sec bins |
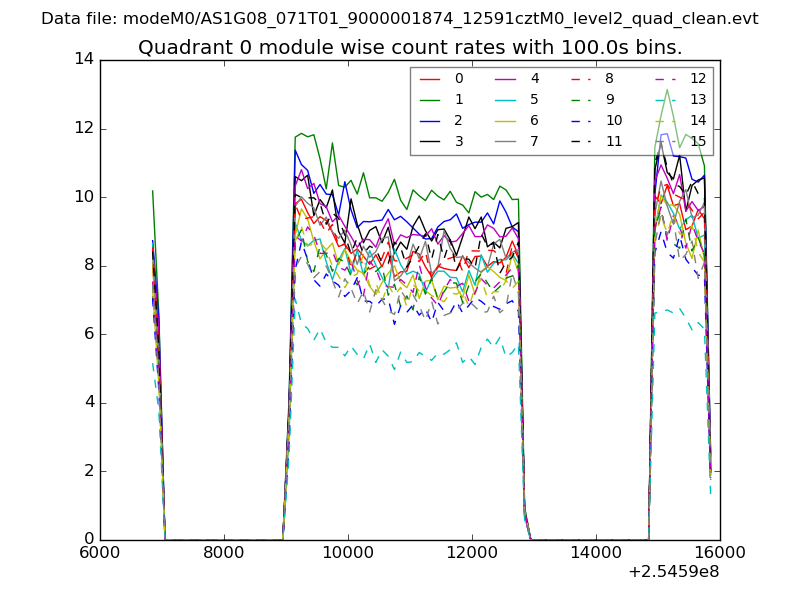 |
 |
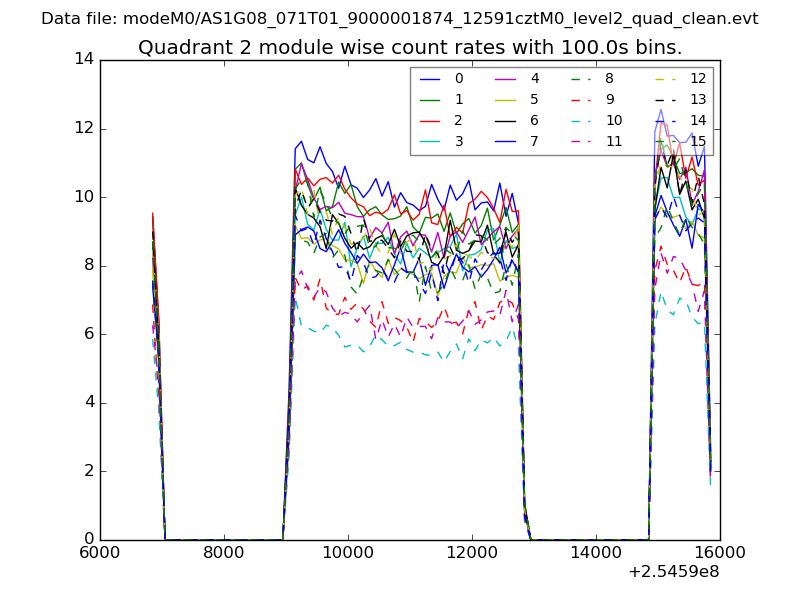
| Module-wise count rates for Quadrant B Data is divided into 100 sec bins |
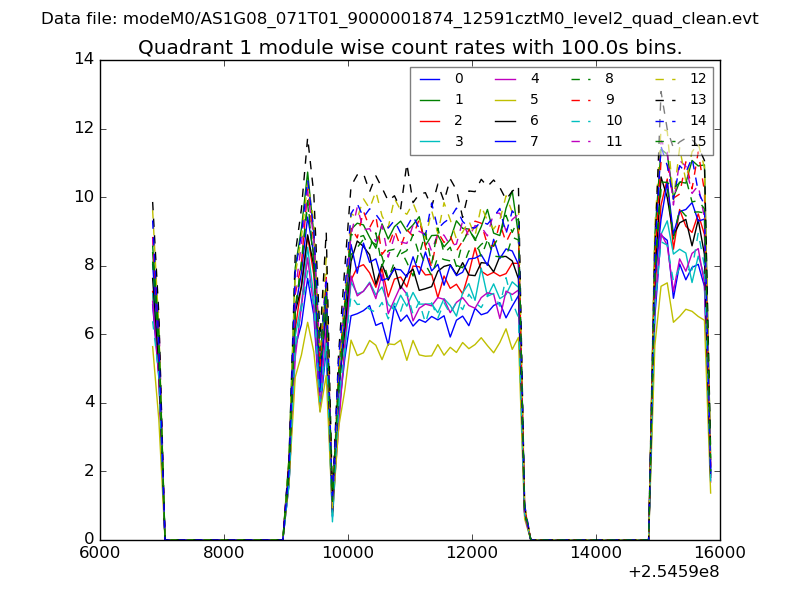 |
 |
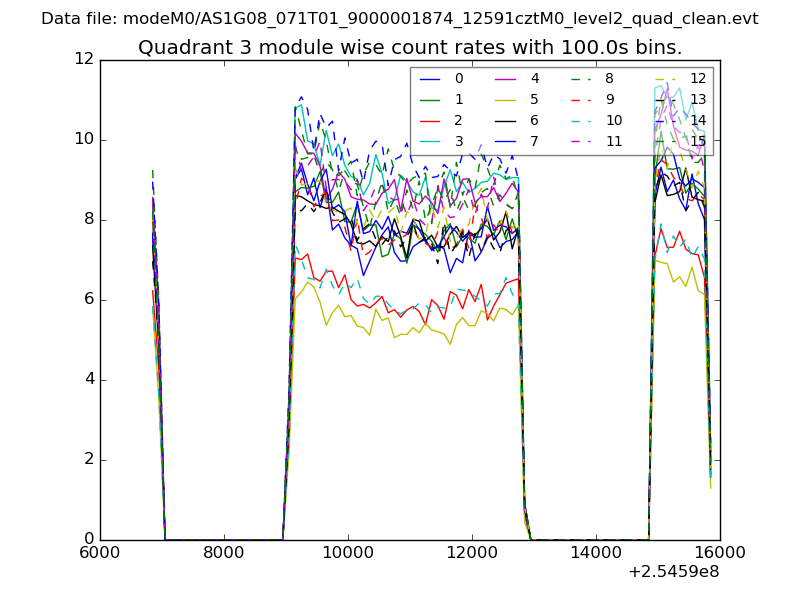
| Module-wise count rates for Quadrant C Data is divided into 100 sec bins |
 |
 |
| Module-wise count rates for Quadrant D Data is divided into 100 sec bins |
 |
 |
| Parameter | Plot |
|---|---|
| CZT HV Monitor | 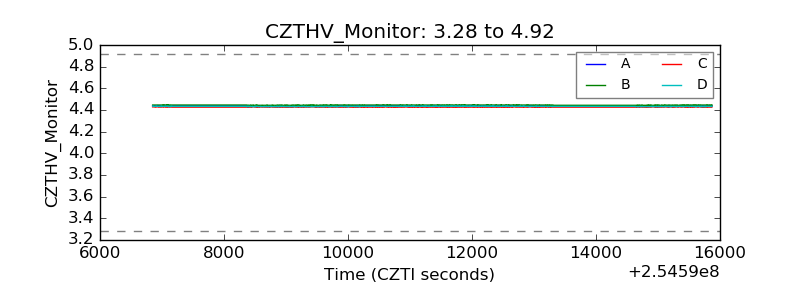 |
| D_VDD | 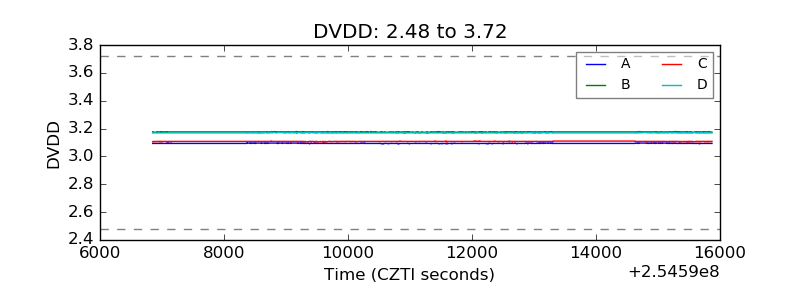 |
| Temperature 1 | 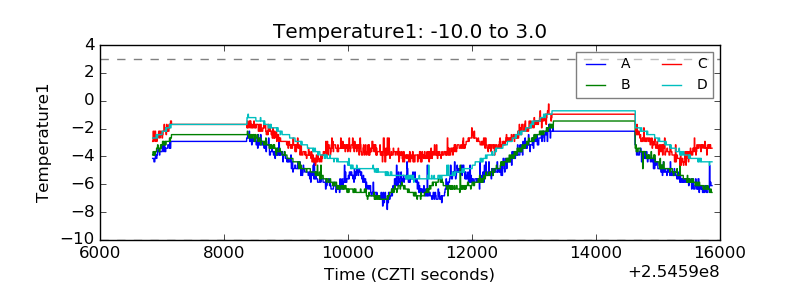 |
| Veto HV Monitor | 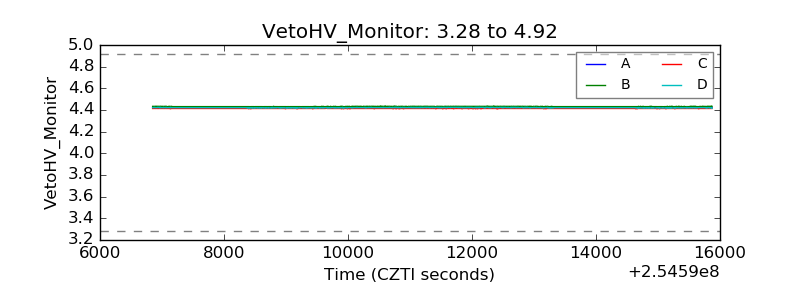 |
| Veto LLD | 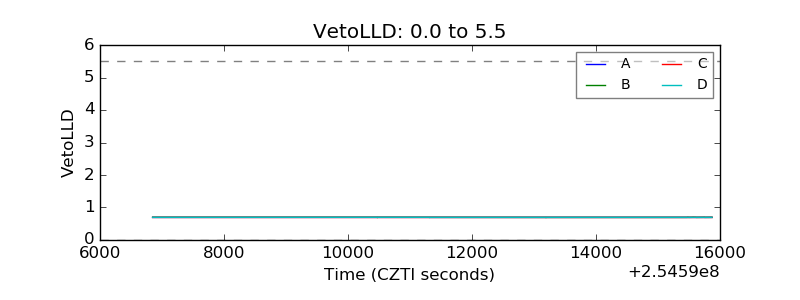 |
| Alpha Counter |  |
| _CPM_Rate |  |
| CZT Counter | 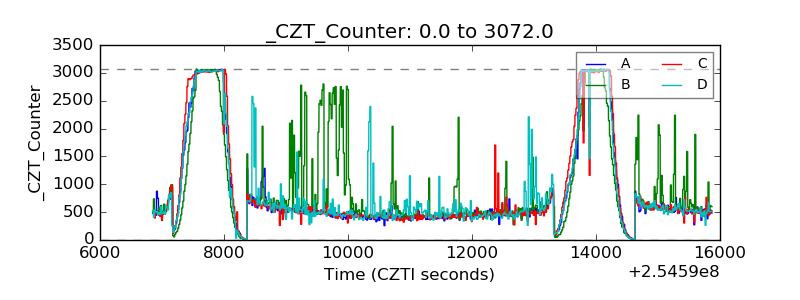 |
| +2.5 Volts monitor |  |
| +5 Volts monitor |  |
| _ROLL_ROT | 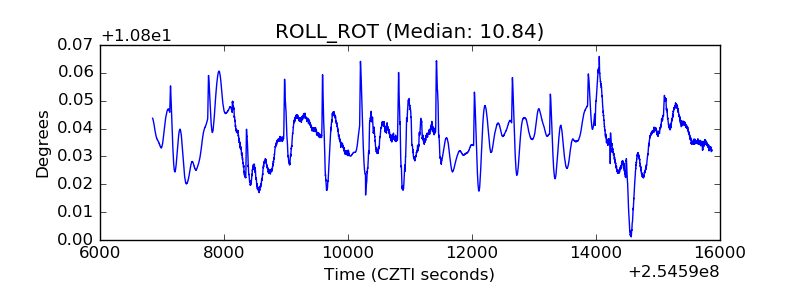 |
| _Roll_DEC | 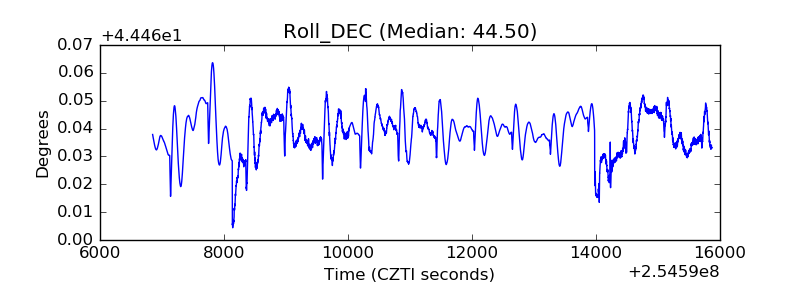 |
| _Roll_RA | 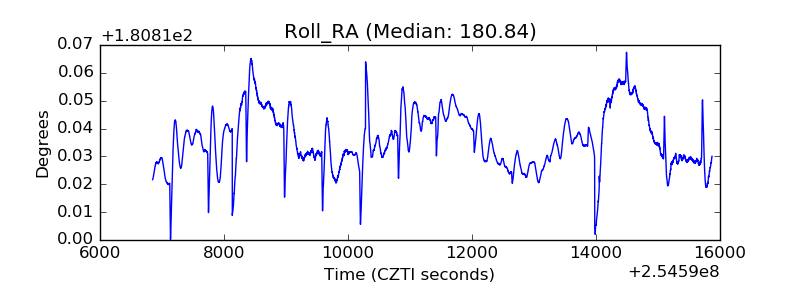 |
| Veto Counter | 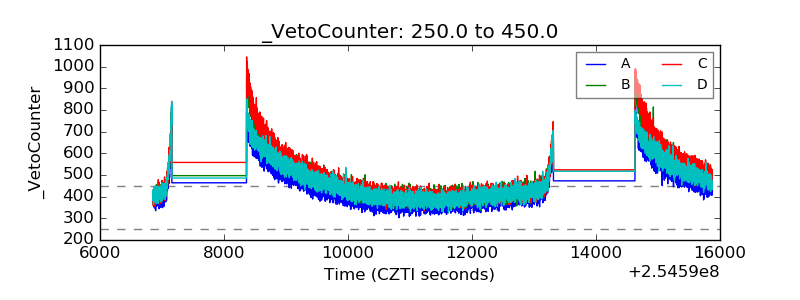 |