| Param | Original file | Final file |
|---|---|---|
| Filename | modeM0/AS1G08_071T01_9000001874_12593cztM0_level2.evt | modeM0/AS1G08_071T01_9000001874_12593cztM0_level2_quad_clean.evt |
| Size (bytes) | 496,422,720 | 106,035,840 |
| Size | 473.4 MB | 101.1 MB |
| Events in quadrant A | 3,362,114 | 684,533 |
| Events in quadrant B | 3,940,224 | 708,643 |
| Events in quadrant C | 3,456,442 | 699,466 |
| Events in quadrant D | 3,809,940 | 641,234 |
| Mode SS | |||
|---|---|---|---|
| Quadrant | BADHDUFLAG | Total packets | Discarded packets |
| A | 0 | 142 | 0 |
| B | 0 | 142 | 0 |
| C | 0 | 142 | 0 |
| D | 0 | 142 | 0 |
| Mode M0 | |||
|---|---|---|---|
| Quadrant | BADHDUFLAG | Total packets | Discarded packets |
| A | 0 | 14522 | 3 |
| B | 0 | 16179 | 2 |
| C | 0 | 14806 | 2 |
| D | 0 | 16075 | 2 |
| Mode M9 | |||
|---|---|---|---|
| Quadrant | BADHDUFLAG | Total packets | Discarded packets |
| A | 0 | 27 | 0 |
| B | 0 | 27 | 0 |
| C | 0 | 27 | 0 |
| D | 0 | 27 | 0 |
| Quadrant | Total seconds | Saturated seconds | Saturation percentage |
|---|---|---|---|
| A | 6849 | 85 | 1.241057% |
| B | 6849 | 259 | 3.781574% |
| C | 6849 | 105 | 1.533071% |
| D | 6849 | 234 | 3.416557% |
Noise dominated data is calculated using 1-second bins in cleaned event files. If a bin has >2000 counts, and if more than 50% of those come from <1% of pixels, then it is considered to be noise-dominated and hence unusable.
| Quadrant | # 1 sec bins | Bins with >0 counts | Bins with >2000 counts | High rate bins dominated by noise | Noise dominated (total time) | Noise dominated (detector-on time) | Marked lightcurve |
|---|---|---|---|---|---|---|---|
| A | 9525 | 6850 | 0 | 0 | 0.00% | 0.00% | 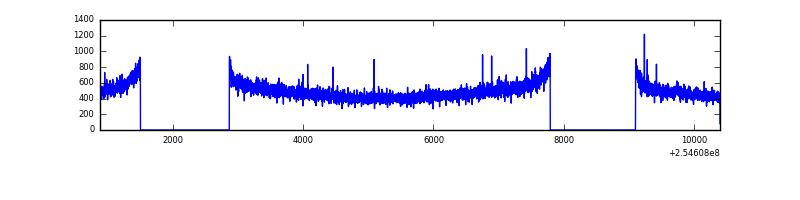 |
| B | 9525 | 6851 | 83 | 83 | 0.87% | 1.21% | 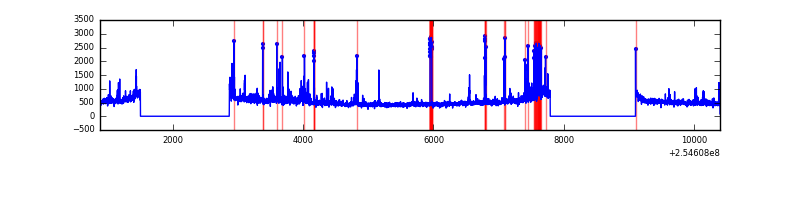 |
| C | 9525 | 6850 | 9 | 9 | 0.09% | 0.13% | 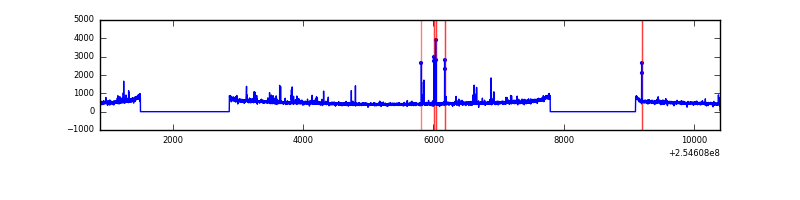 |
| D | 9525 | 6852 | 169 | 169 | 1.77% | 2.47% | 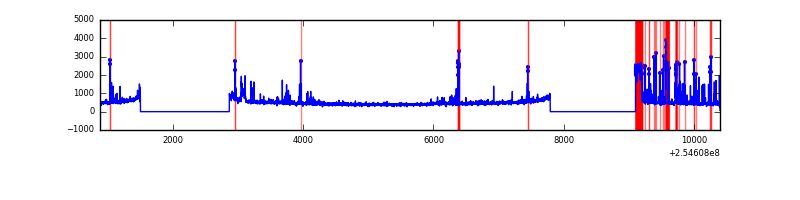 |
Top three noisy pixels from each quadrant. If the there are fewer than three noisy pixels in the level2.evt file, extra rows are filled as -1
| Pixel properties | Quadrant properties | ||||||
|---|---|---|---|---|---|---|---|
| Quadrant | DetID | PixID | Counts | Sigma | Mean | Median | Sigma |
| A | 12 | 189 | 28555 | 159.42 | 865 | 847 | 173.8 |
| A | 0 | 226 | 7714 | 39.51 | 865 | 847 | 173.8 |
| A | 12 | 194 | 6723 | 33.81 | 865 | 847 | 173.8 |
| B | 4 | 239 | 308035 | 1882.78 | 867 | 845 | 163.2 |
| B | 3 | 64 | 166032 | 1012.44 | 867 | 845 | 163.2 |
| B | 11 | 51 | 53736 | 324.17 | 867 | 845 | 163.2 |
| C | 15 | 208 | 75246 | 378.57 | 854 | 859 | 196.5 |
| C | 14 | 234 | 51564 | 258.05 | 854 | 859 | 196.5 |
| C | 13 | 61 | 6212 | 27.24 | 854 | 859 | 196.5 |
| D | 1 | 52 | 548494 | 2774.28 | 823 | 798 | 197.4 |
| D | 10 | 199 | 49621 | 247.31 | 823 | 798 | 197.4 |
| D | 13 | 104 | 29424 | 145.0 | 823 | 798 | 197.4 |
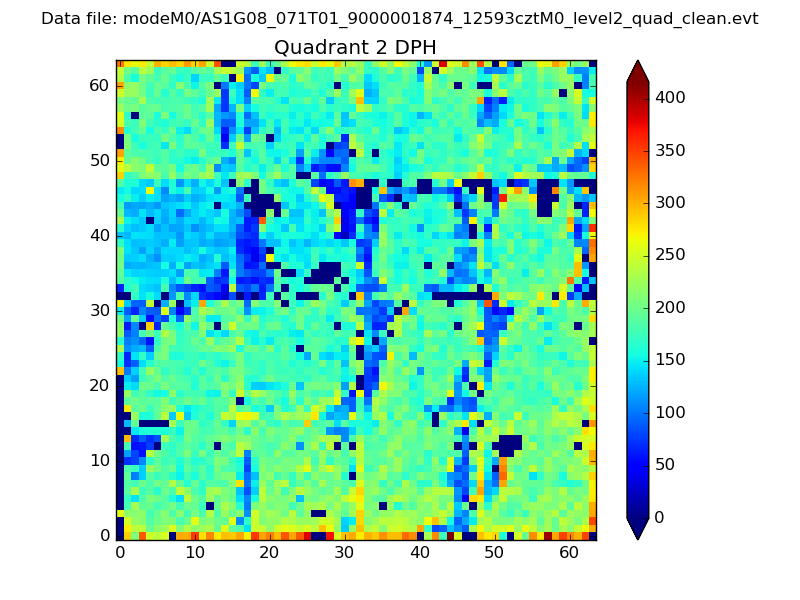
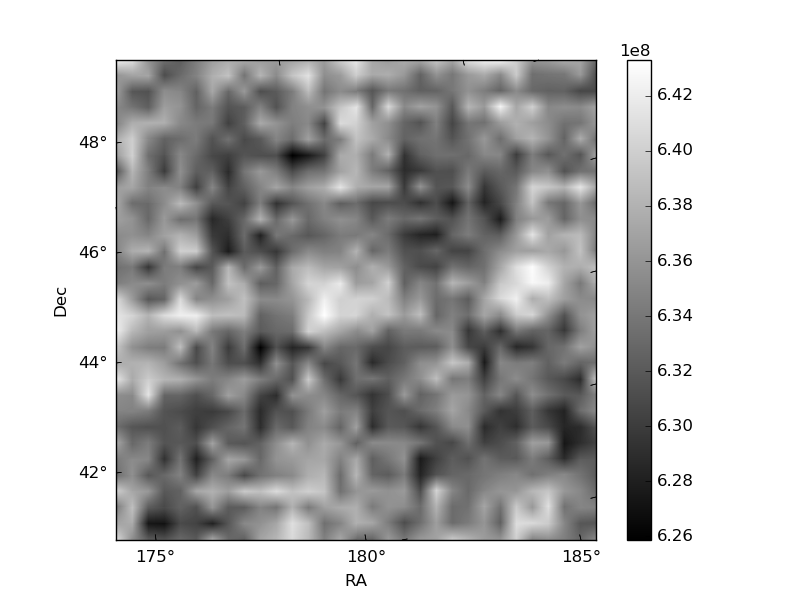
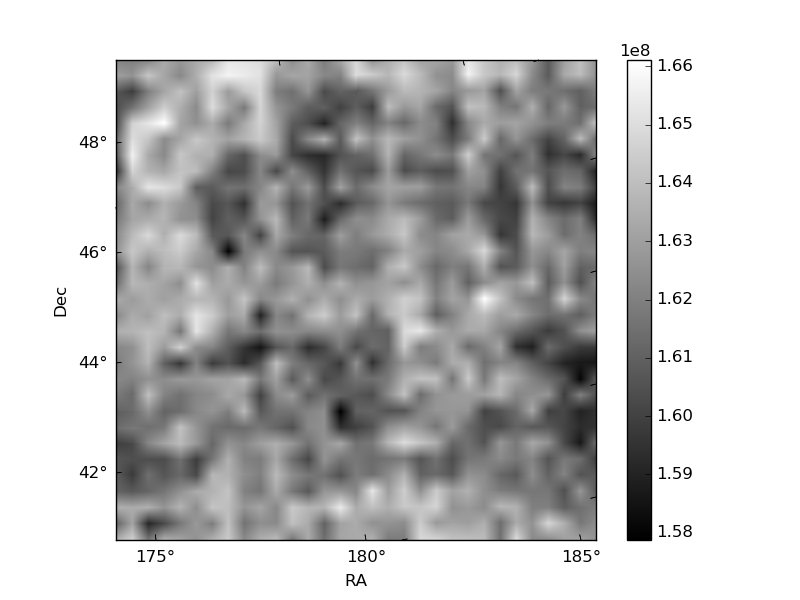
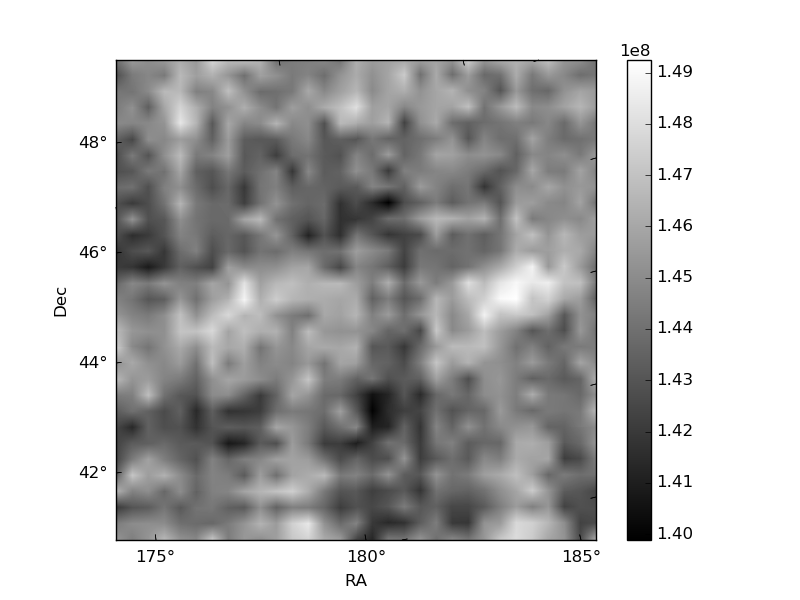
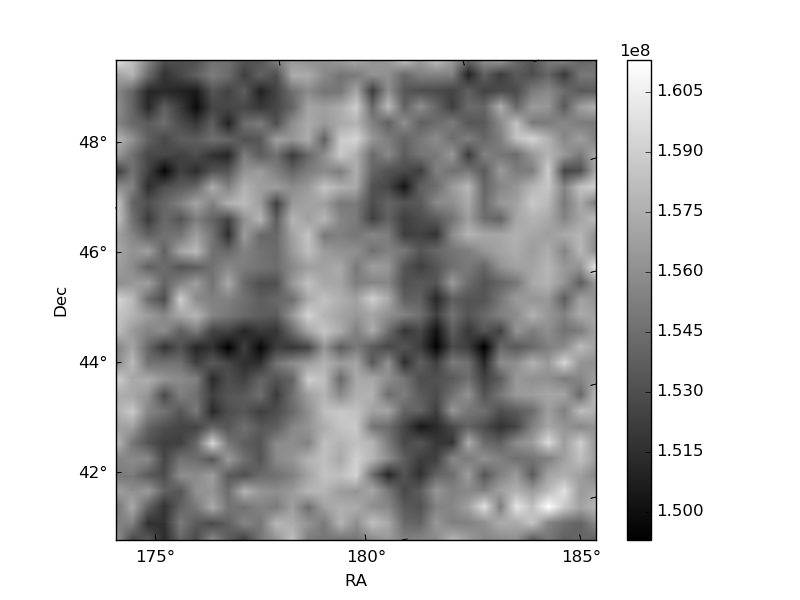
Histogram calculated using DETX and DETY for each event in the final _common_clean file
| Quadrant A | 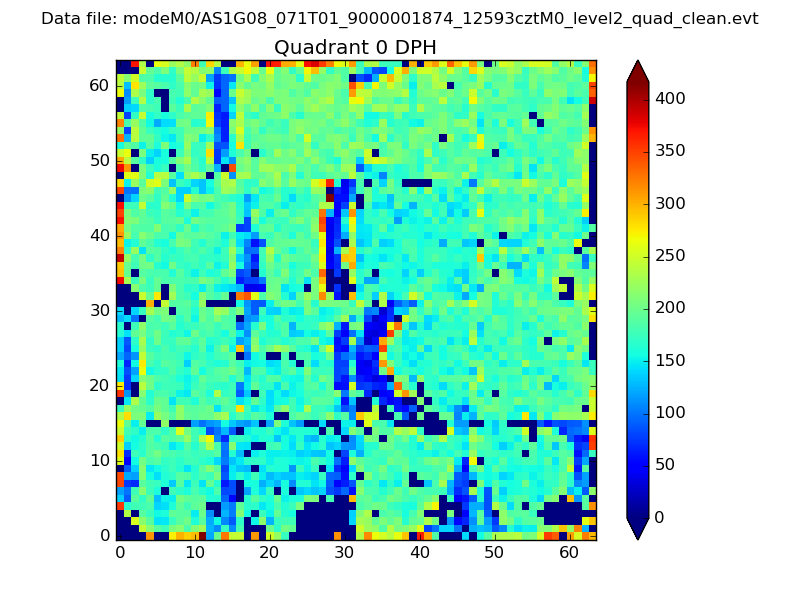 |
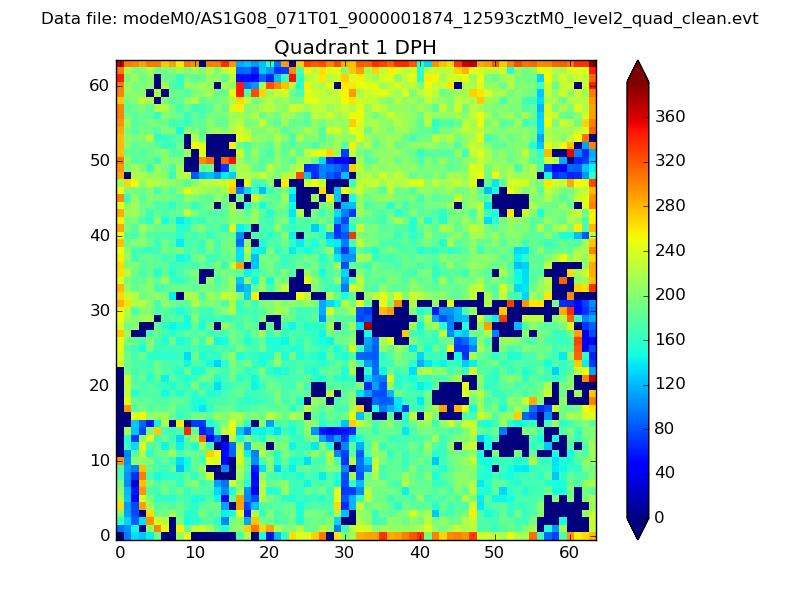 |
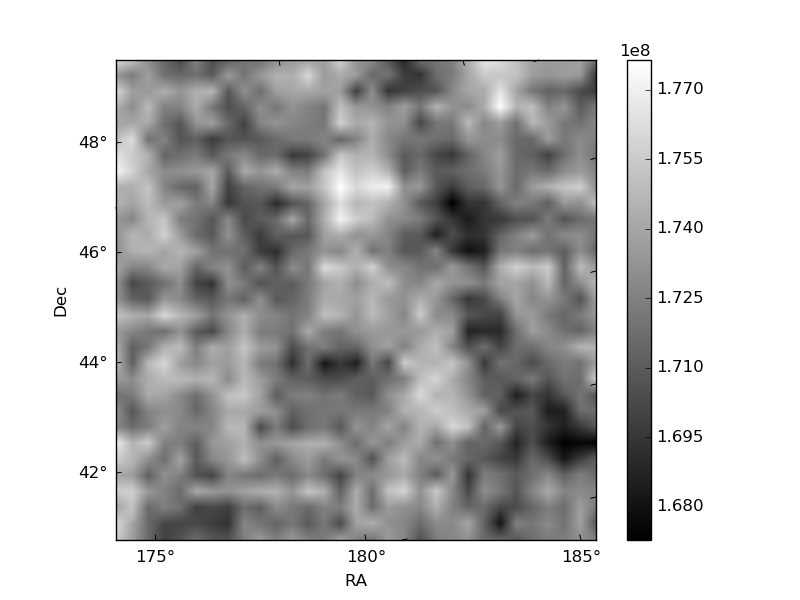
Quadrant B |
|---|---|---|---|
| Quadrant D | 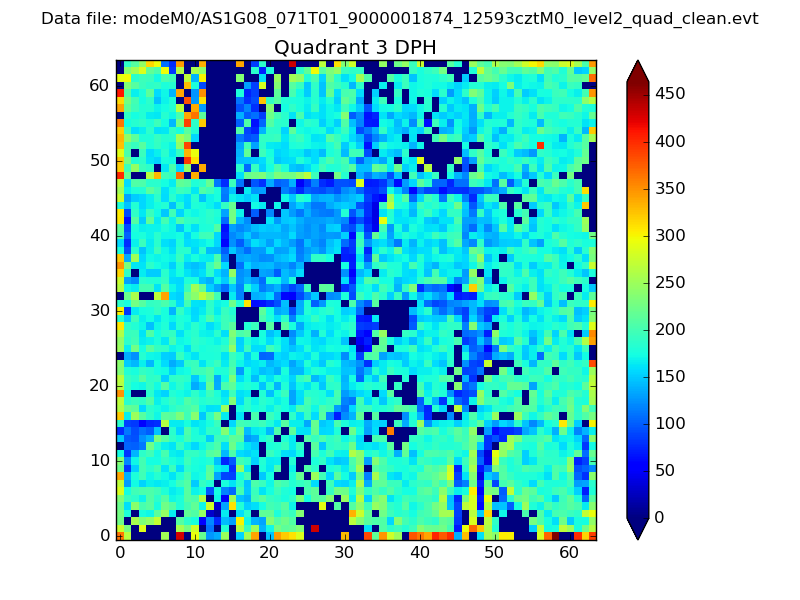 |
 |
Quadrant C |
| Plot type | Count rate plots | Images |
|---|---|---|
| Comparison with Poisson distribution Blue bars denote a histogram of data divided into 1 sec bins. Red curve is a Poisson curve with rate = median count rate of data. |
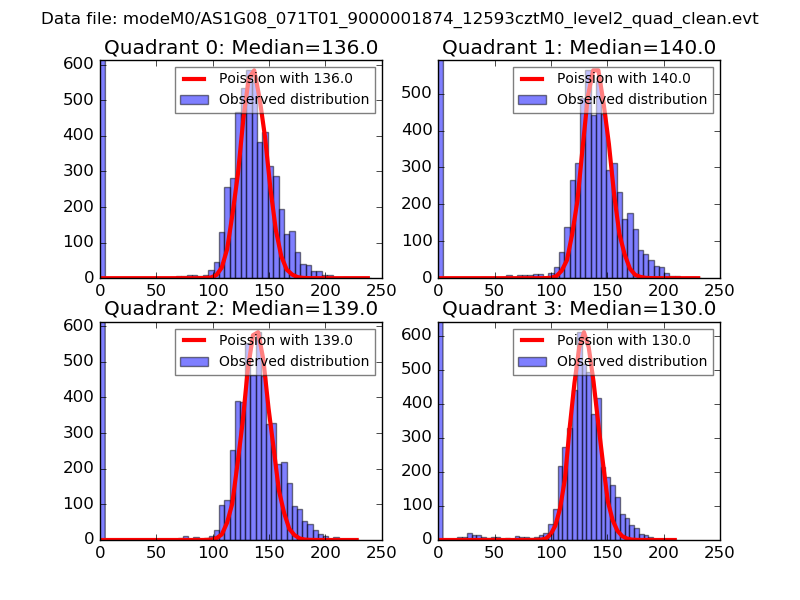 |
 |
| Quadrant-wise count rates Data is divided into 100 sec bins |
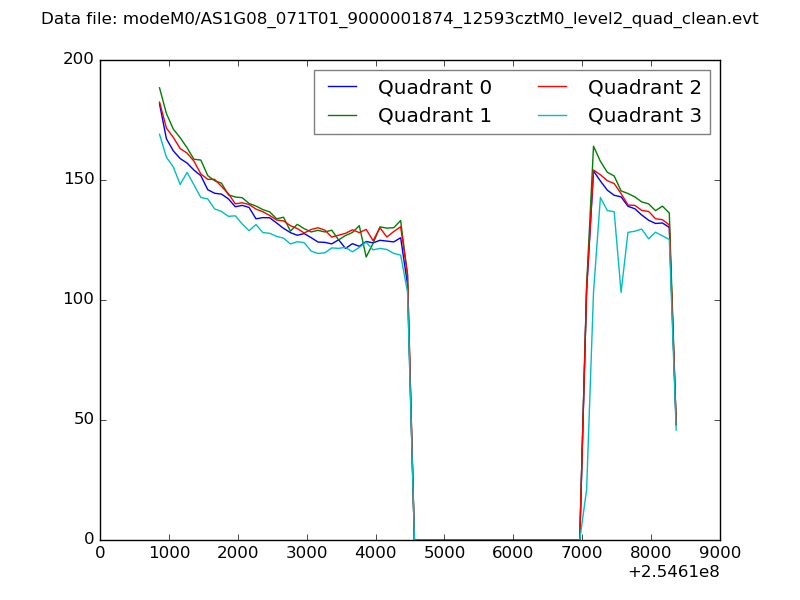 |
|
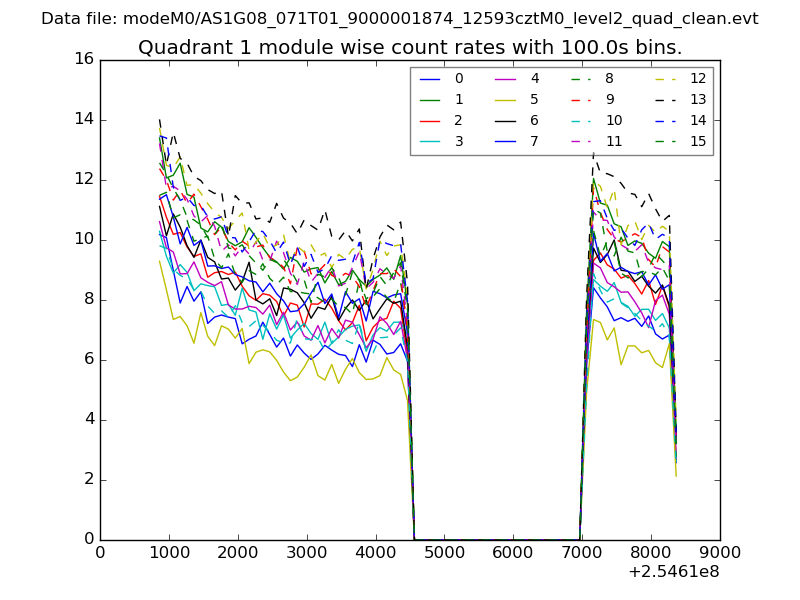
| Module-wise count rates for Quadrant A Data is divided into 100 sec bins |
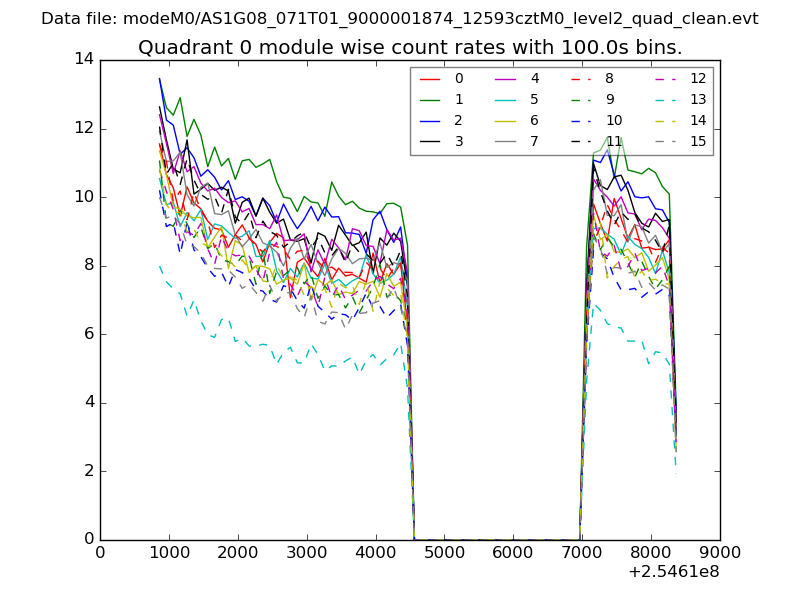 |
 |
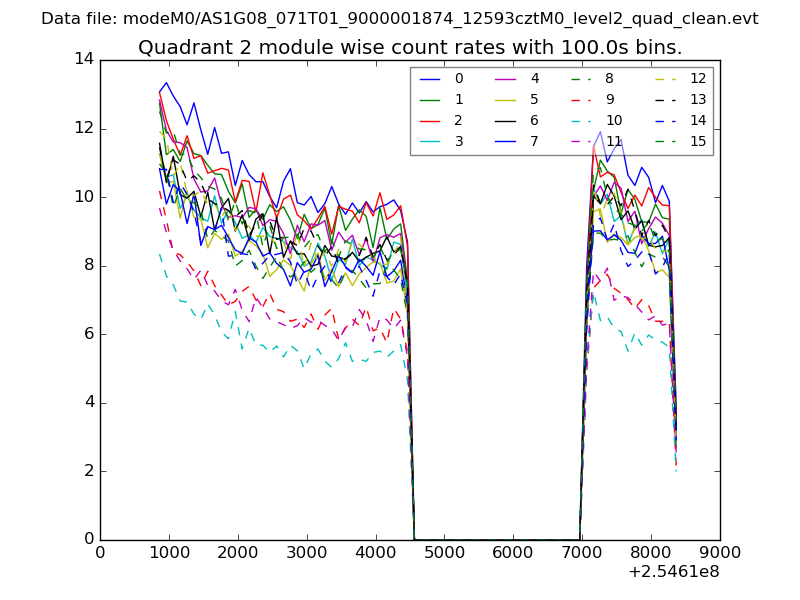
| Module-wise count rates for Quadrant B Data is divided into 100 sec bins |
 |
 |
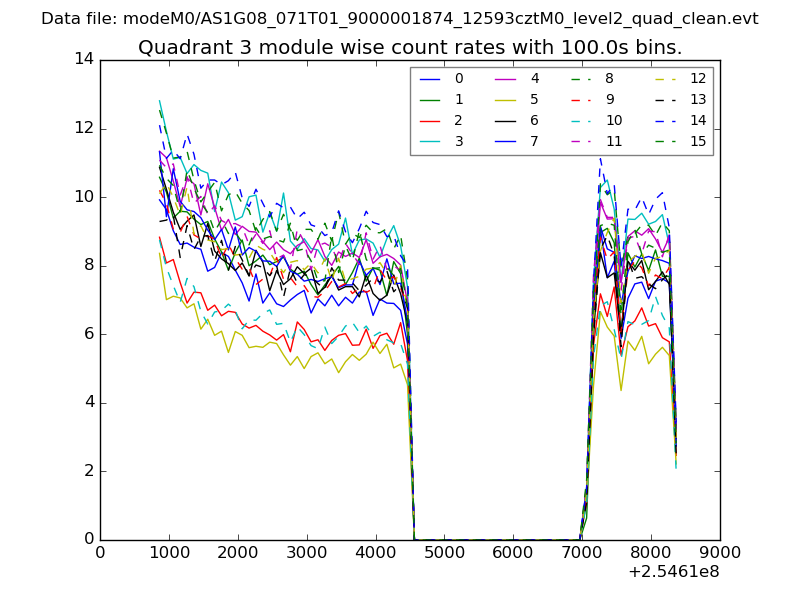
| Module-wise count rates for Quadrant C Data is divided into 100 sec bins |
 |
 |
| Module-wise count rates for Quadrant D Data is divided into 100 sec bins |
 |
 |
| Parameter | Plot |
|---|---|
| CZT HV Monitor | 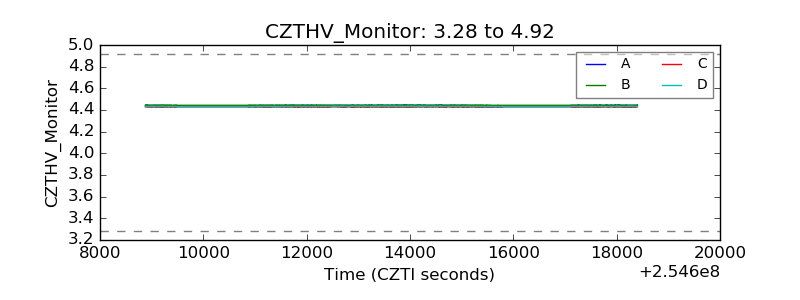 |
| D_VDD | 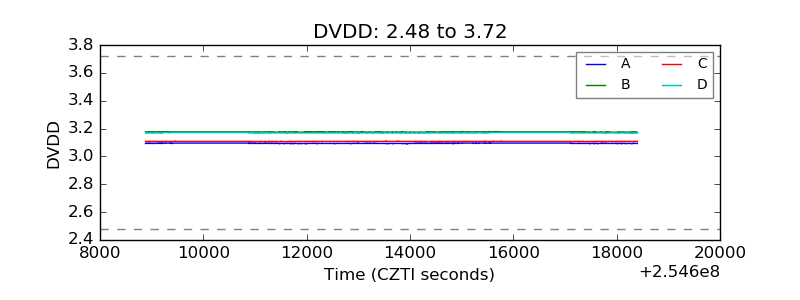 |
| Temperature 1 | 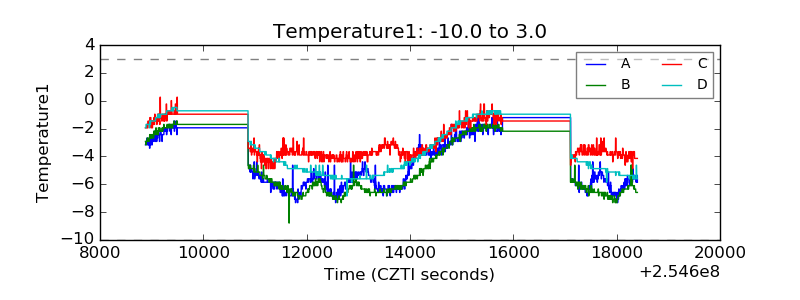 |
| Veto HV Monitor | 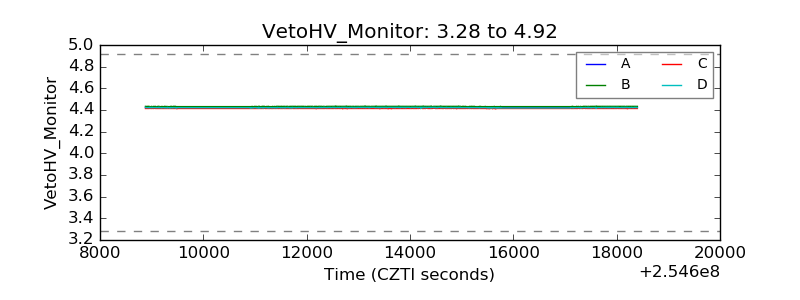 |
| Veto LLD | 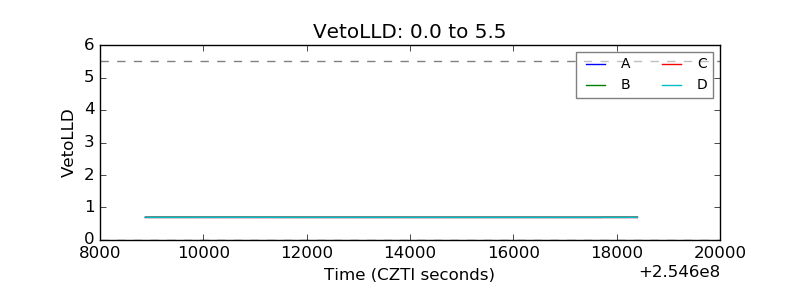 |
| Alpha Counter | 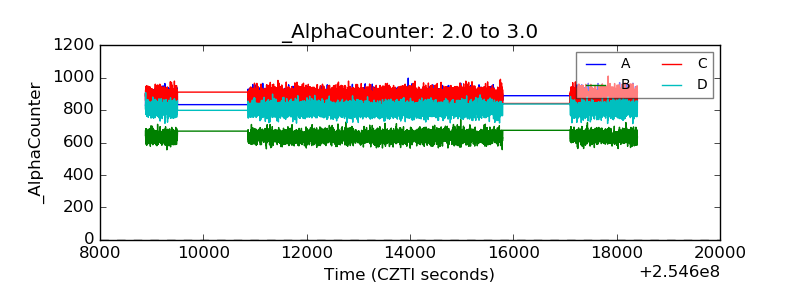 |
| _CPM_Rate | 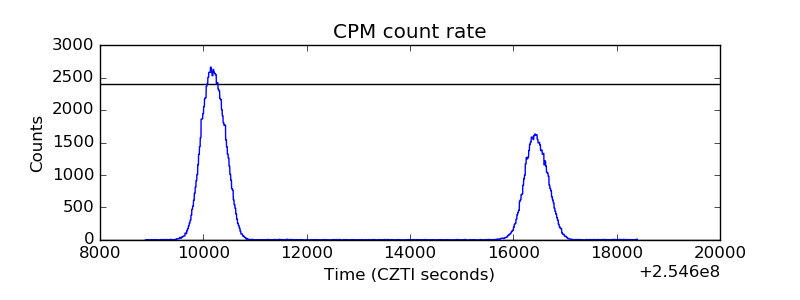 |
| CZT Counter | 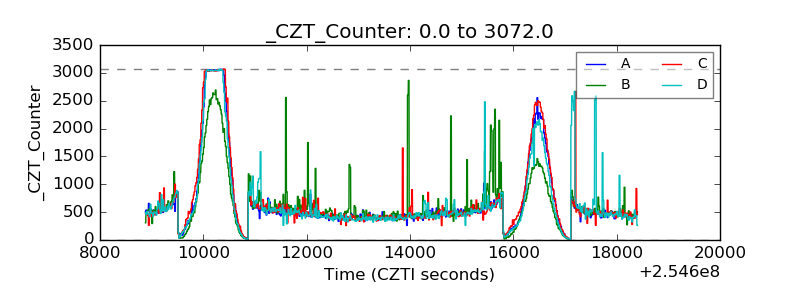 |
| +2.5 Volts monitor |  |
| +5 Volts monitor |  |
| _ROLL_ROT | 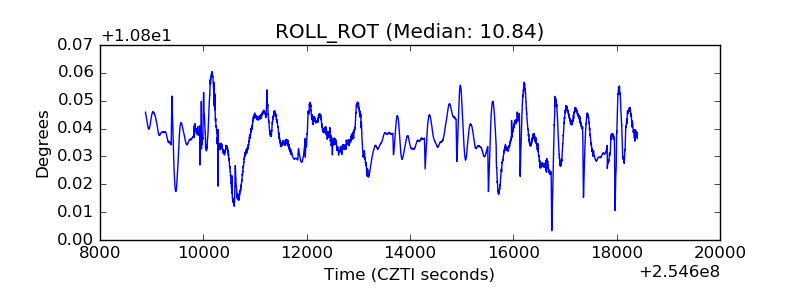 |
| _Roll_DEC | 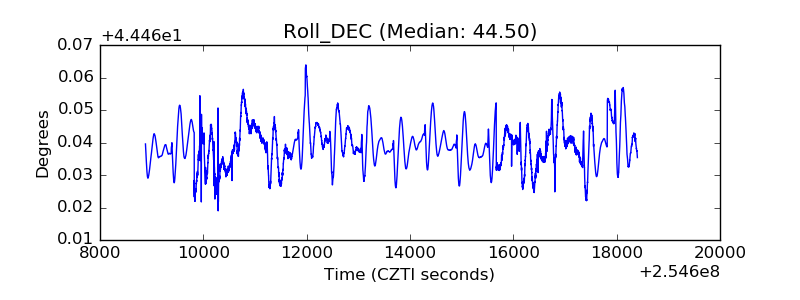 |
| _Roll_RA | 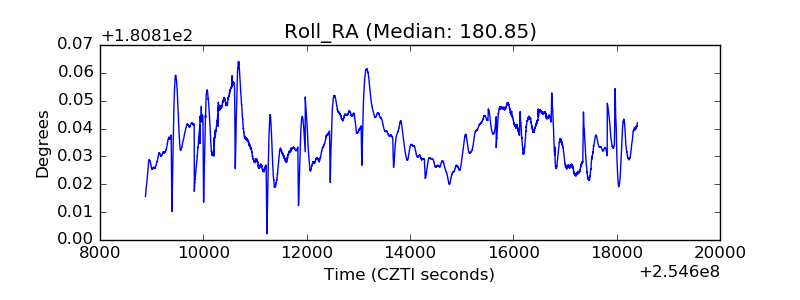 |
| Veto Counter | 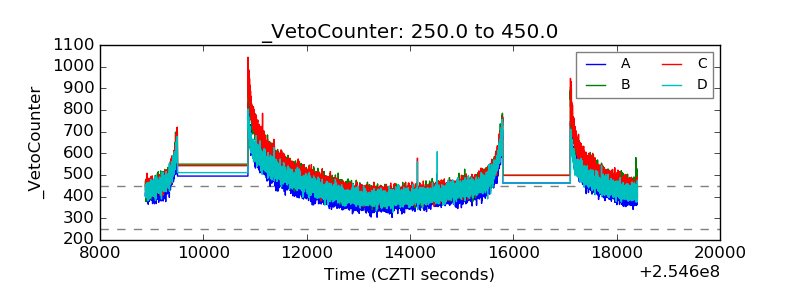 |