| Param | Original file | Final file |
|---|---|---|
| Filename | modeM0/AS1G08_071T01_9000001874_12597cztM0_level2.evt | modeM0/AS1G08_071T01_9000001874_12597cztM0_level2_quad_clean.evt |
| Size (bytes) | 1,376,020,800 | 250,185,600 |
| Size | 1.3 GB | 238.6 MB |
| Events in quadrant A | 8,772,683 | 1,567,258 |
| Events in quadrant B | 10,562,040 | 1,606,794 |
| Events in quadrant C | 8,888,981 | 1,599,304 |
| Events in quadrant D | 12,153,516 | 1,483,316 |
| Mode SS | |||
|---|---|---|---|
| Quadrant | BADHDUFLAG | Total packets | Discarded packets |
| A | 0 | 388 | 0 |
| B | 0 | 388 | 0 |
| C | 0 | 388 | 0 |
| D | 0 | 388 | 0 |
| Mode M0 | |||
|---|---|---|---|
| Quadrant | BADHDUFLAG | Total packets | Discarded packets |
| A | 0 | 39468 | 4 |
| B | 0 | 44509 | 3 |
| C | 0 | 40121 | 3 |
| D | 0 | 50144 | 3 |
| Mode M9 | |||
|---|---|---|---|
| Quadrant | BADHDUFLAG | Total packets | Discarded packets |
| A | 0 | 16 | 0 |
| B | 0 | 16 | 0 |
| C | 0 | 16 | 0 |
| D | 0 | 17 | 0 |
| Quadrant | Total seconds | Saturated seconds | Saturation percentage |
|---|---|---|---|
| A | 19165 | 309 | 1.612314% |
| B | 19165 | 452 | 2.358466% |
| C | 19165 | 169 | 0.881816% |
| D | 19165 | 1114 | 5.812679% |
Noise dominated data is calculated using 1-second bins in cleaned event files. If a bin has >2000 counts, and if more than 50% of those come from <1% of pixels, then it is considered to be noise-dominated and hence unusable.
| Quadrant | # 1 sec bins | Bins with >0 counts | Bins with >2000 counts | High rate bins dominated by noise | Noise dominated (total time) | Noise dominated (detector-on time) | Marked lightcurve |
|---|---|---|---|---|---|---|---|
| A | 20366 | 19170 | 0 | 0 | 0.00% | 0.00% | 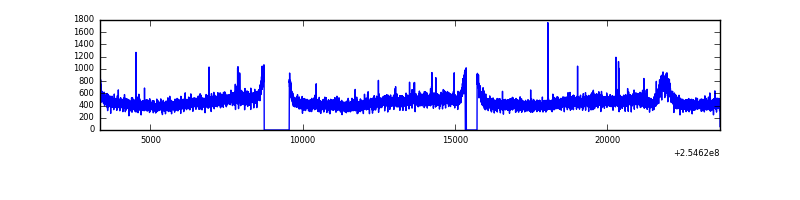 |
| B | 20366 | 19167 | 74 | 74 | 0.36% | 0.39% | 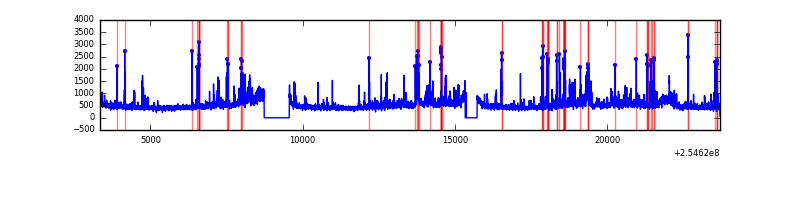 |
| C | 20366 | 19170 | 18 | 18 | 0.09% | 0.09% | 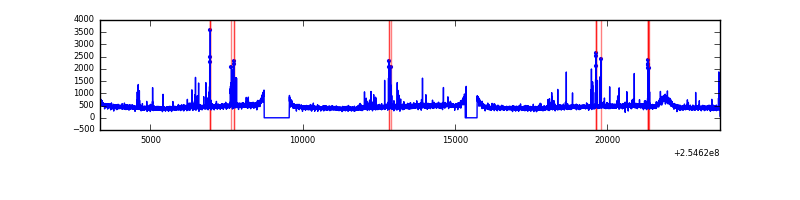 |
| D | 20366 | 19170 | 887 | 887 | 4.36% | 4.63% | 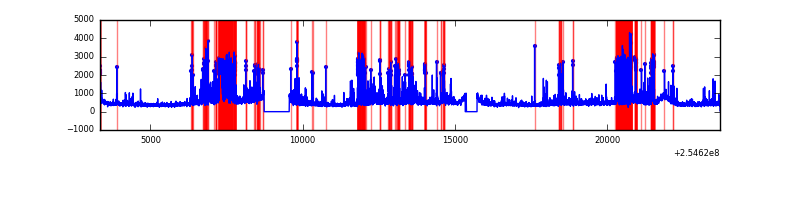 |
Top three noisy pixels from each quadrant. If the there are fewer than three noisy pixels in the level2.evt file, extra rows are filled as -1
| Pixel properties | Quadrant properties | ||||||
|---|---|---|---|---|---|---|---|
| Quadrant | DetID | PixID | Counts | Sigma | Mean | Median | Sigma |
| A | 12 | 189 | 62930 | 131.85 | 2258 | 2206 | 460.6 |
| A | 0 | 226 | 20114 | 38.88 | 2258 | 2206 | 460.6 |
| A | 12 | 194 | 17403 | 33.0 | 2258 | 2206 | 460.6 |
| B | 3 | 64 | 1002398 | 2337.37 | 2259 | 2202 | 427.9 |
| B | 4 | 239 | 485266 | 1128.88 | 2259 | 2202 | 427.9 |
| B | 0 | 214 | 96263 | 219.81 | 2259 | 2202 | 427.9 |
| C | 14 | 234 | 196146 | 381.56 | 2203 | 2210 | 508.3 |
| C | 15 | 208 | 110968 | 213.97 | 2203 | 2210 | 508.3 |
| C | 13 | 61 | 15930 | 26.99 | 2203 | 2210 | 508.3 |
| D | 1 | 52 | 1958226 | 3859.76 | 2125 | 2060 | 506.8 |
| D | 10 | 157 | 1483845 | 2923.74 | 2125 | 2060 | 506.8 |
| D | 10 | 199 | 452941 | 889.64 | 2125 | 2060 | 506.8 |
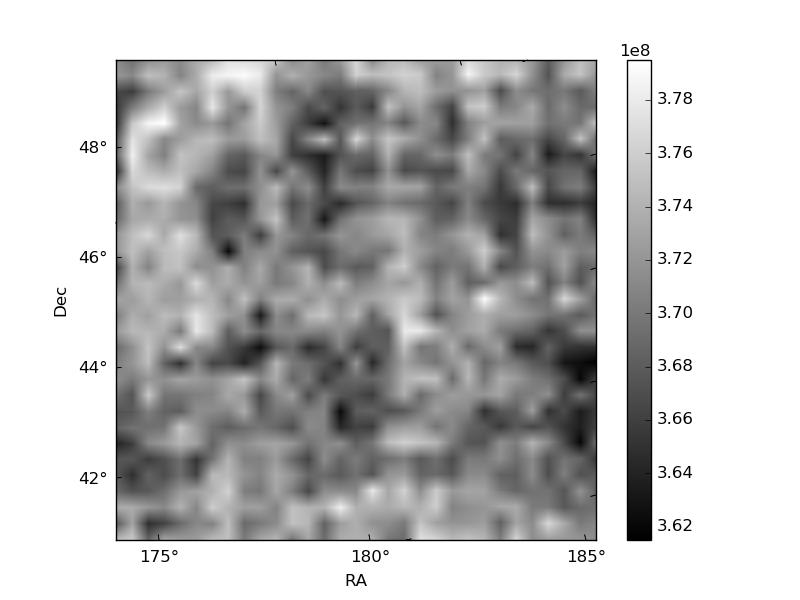
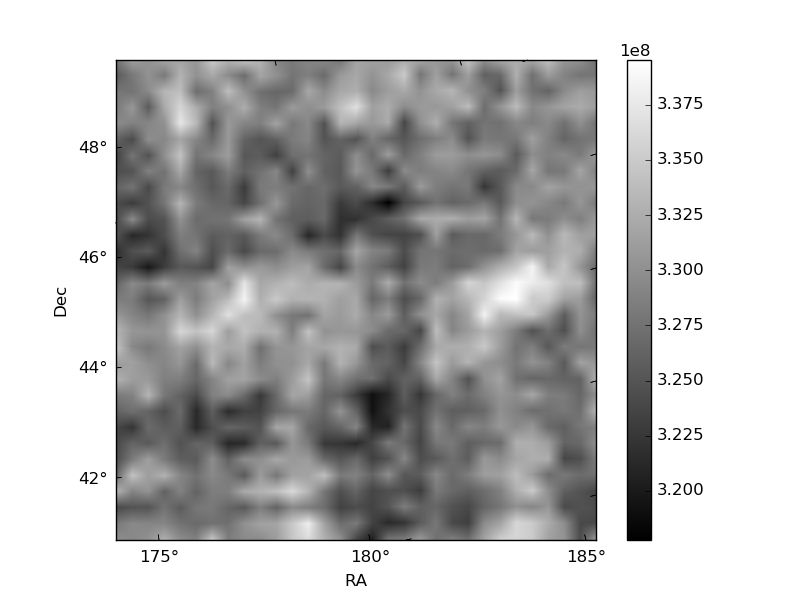
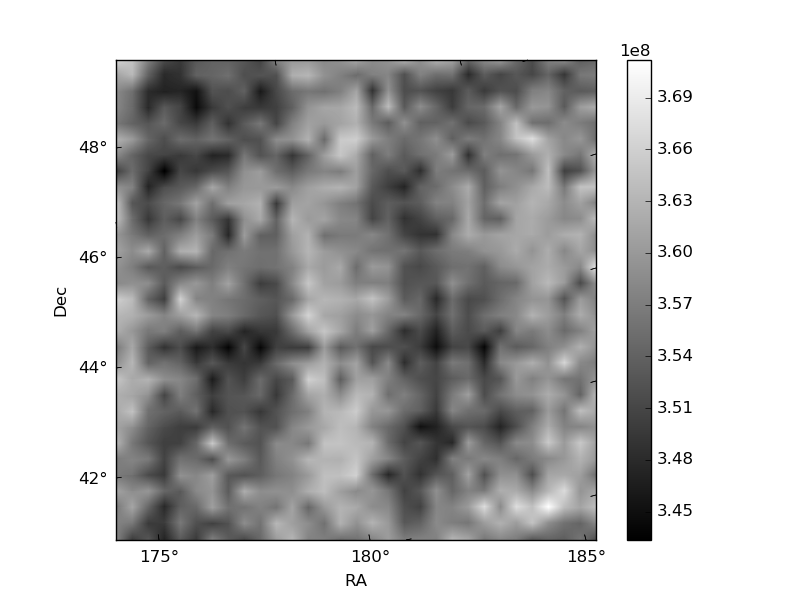
Histogram calculated using DETX and DETY for each event in the final _common_clean file
| Quadrant A |  |
 |
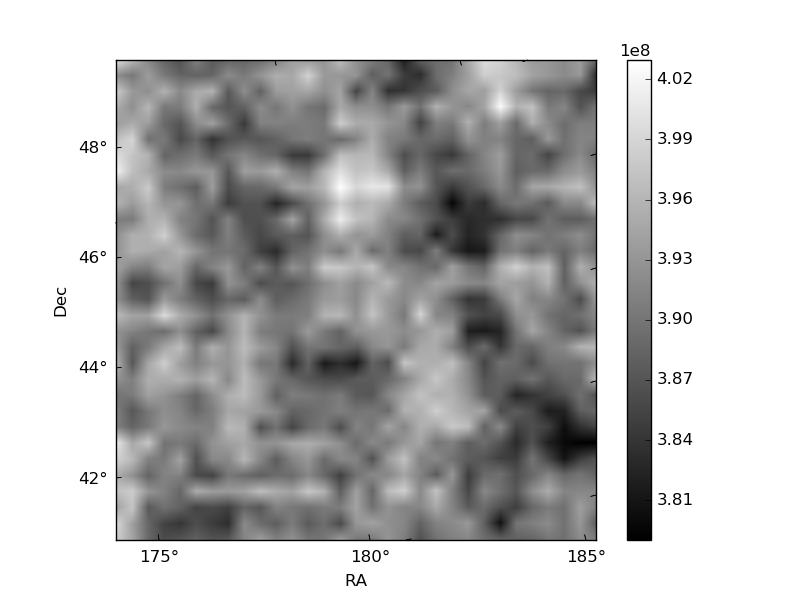
Quadrant B |
|---|---|---|---|
| Quadrant D |  |
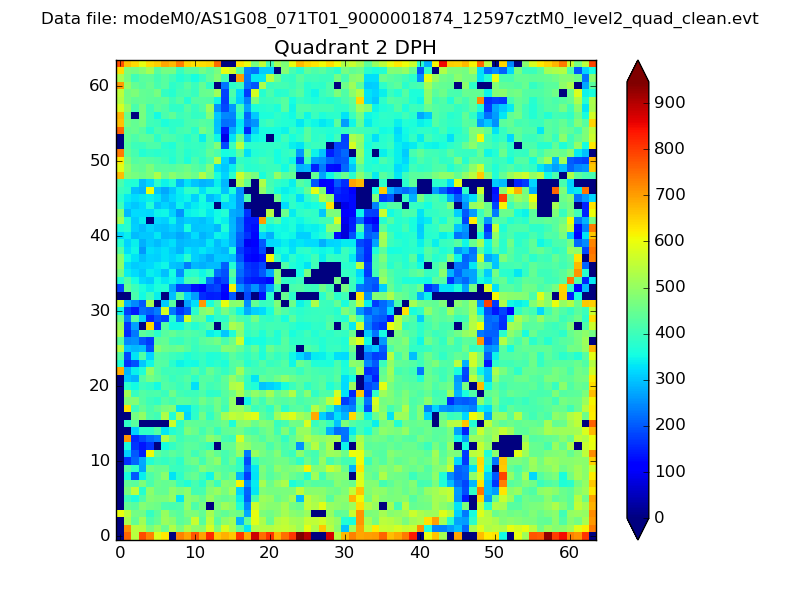 |
Quadrant C |
| Plot type | Count rate plots | Images |
|---|---|---|
| Comparison with Poisson distribution Blue bars denote a histogram of data divided into 1 sec bins. Red curve is a Poisson curve with rate = median count rate of data. |
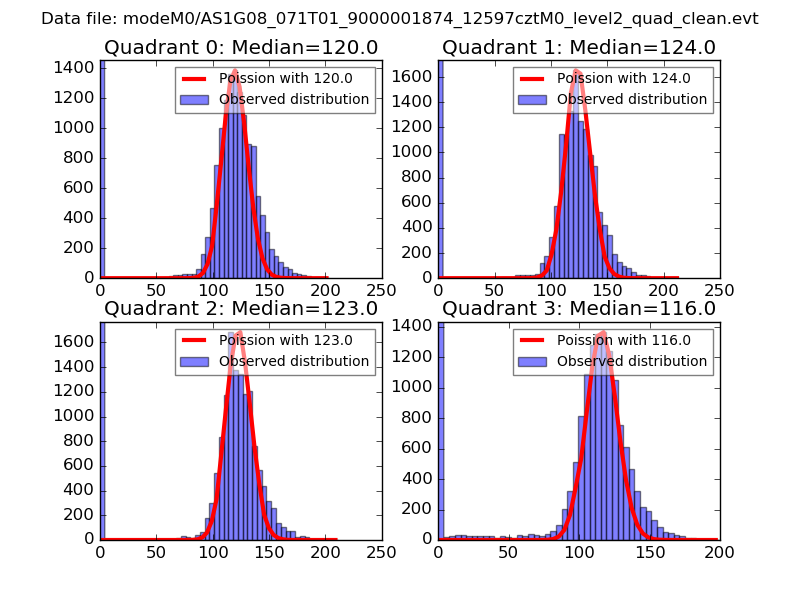 |
 |
| Quadrant-wise count rates Data is divided into 100 sec bins |
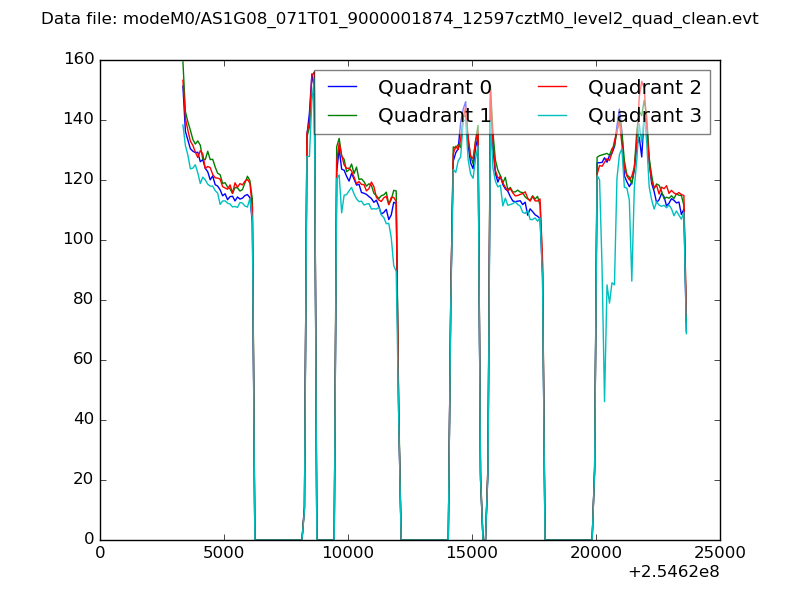 |
|
| Module-wise count rates for Quadrant A Data is divided into 100 sec bins |
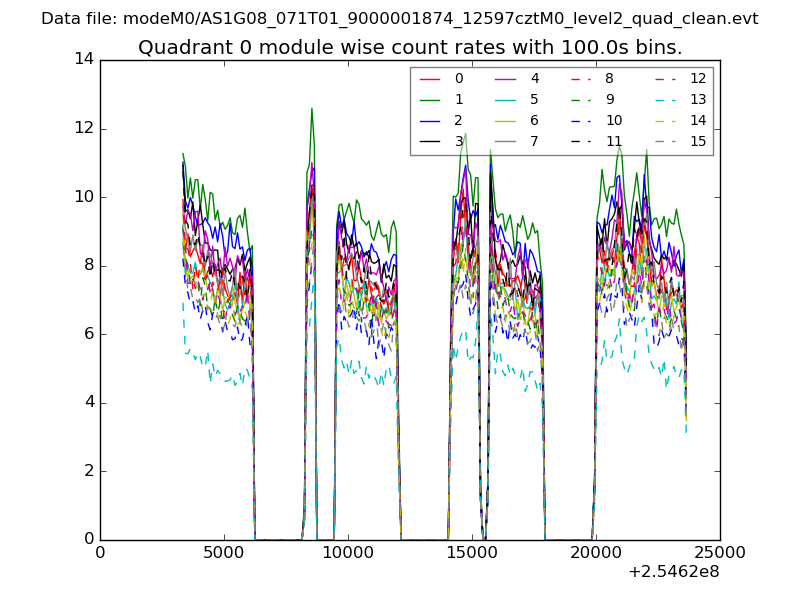 |
 |
| Module-wise count rates for Quadrant B Data is divided into 100 sec bins |
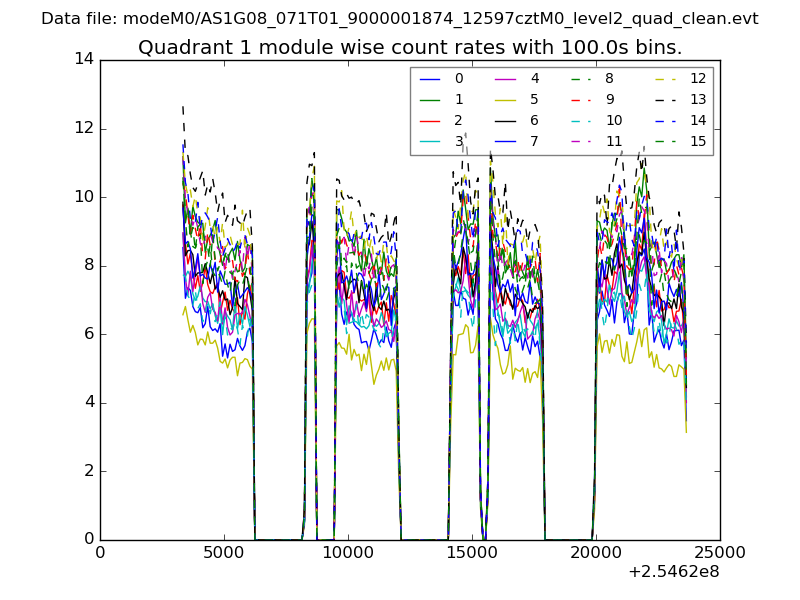 |
 |
| Module-wise count rates for Quadrant C Data is divided into 100 sec bins |
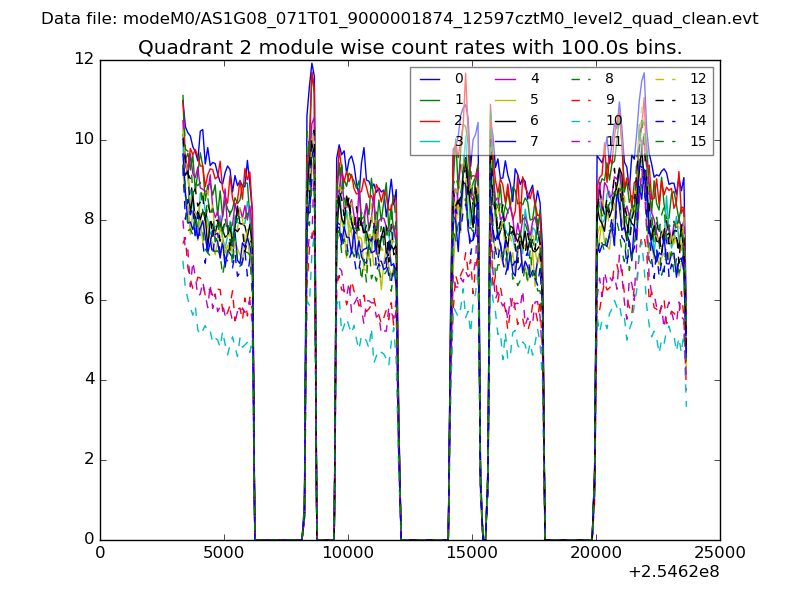 |
 |
| Module-wise count rates for Quadrant D Data is divided into 100 sec bins |
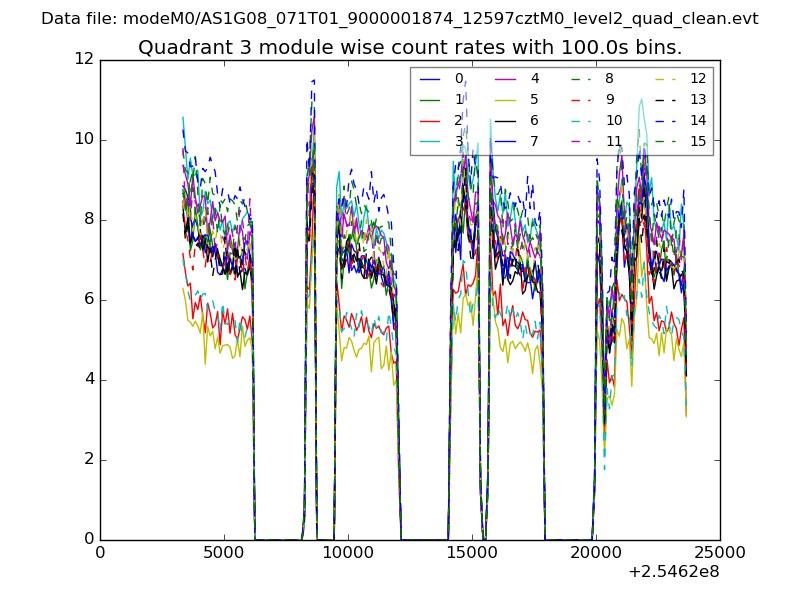 |
 |
| Parameter | Plot |
|---|---|
| CZT HV Monitor | 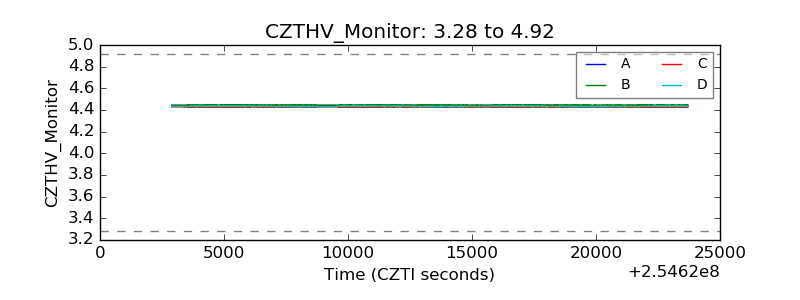 |
| D_VDD | 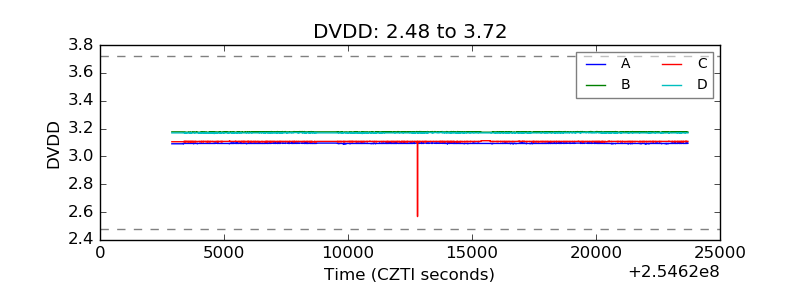 |
| Temperature 1 | 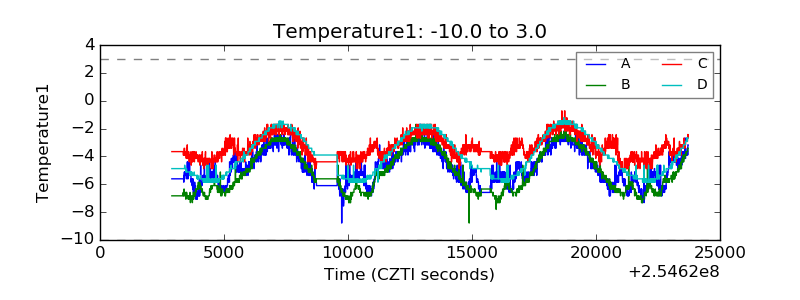 |
| Veto HV Monitor | 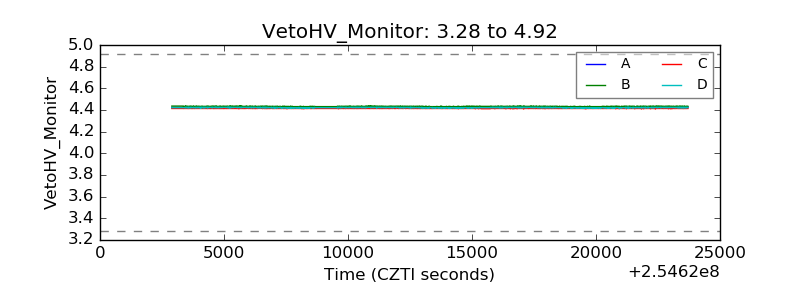 |
| Veto LLD | 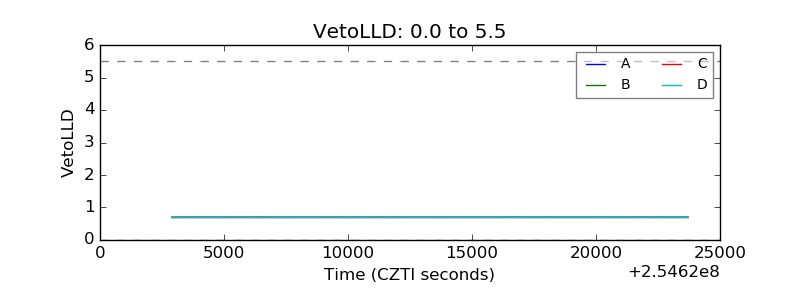 |
| Alpha Counter | 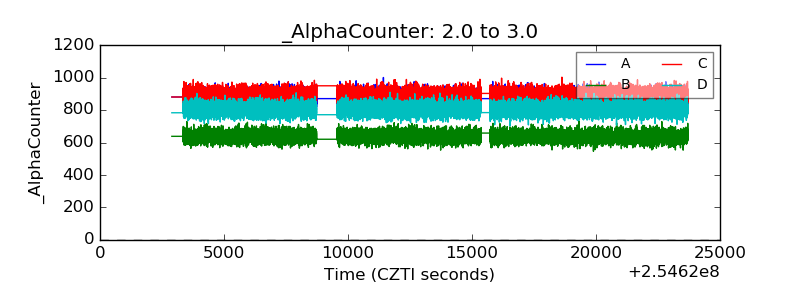 |
| _CPM_Rate | 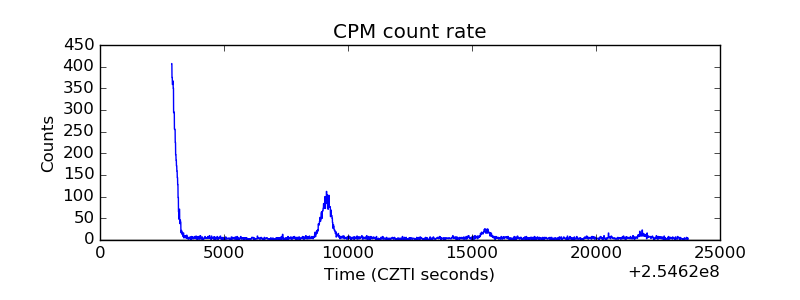 |
| CZT Counter | 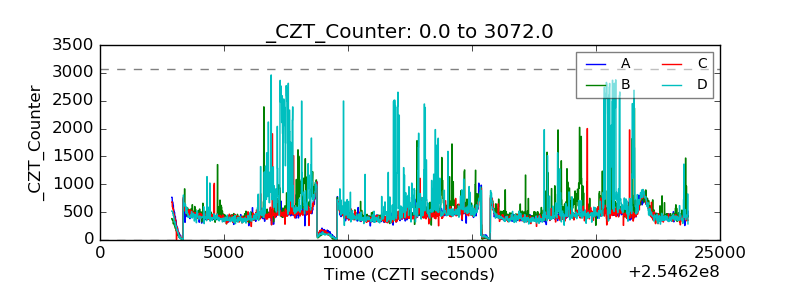 |
| +2.5 Volts monitor | 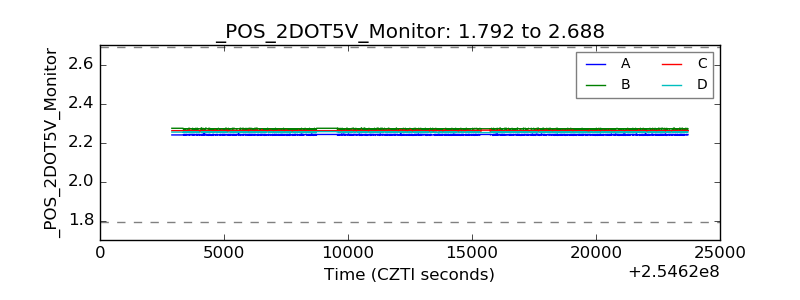 |
| +5 Volts monitor |  |
| _ROLL_ROT | 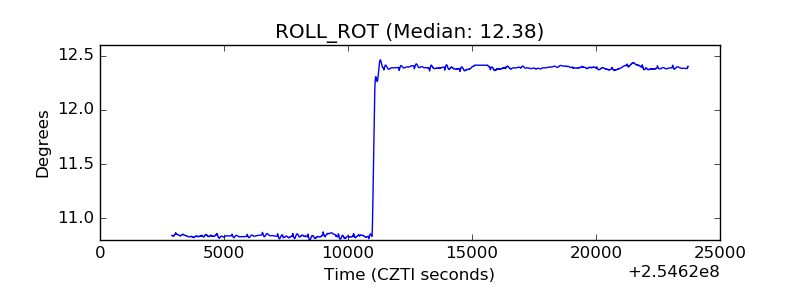 |
| _Roll_DEC | 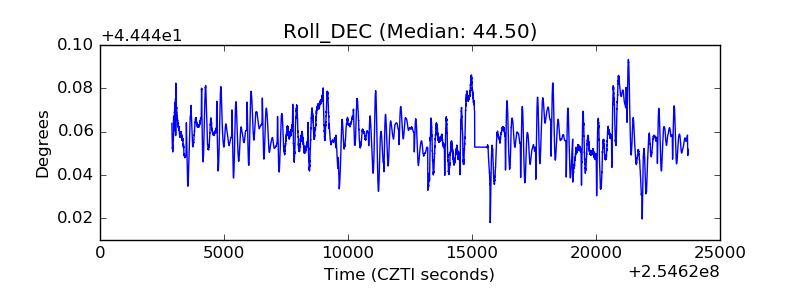 |
| _Roll_RA | 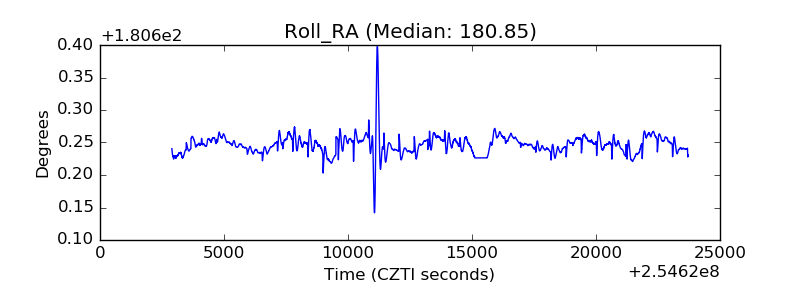 |
| Veto Counter | 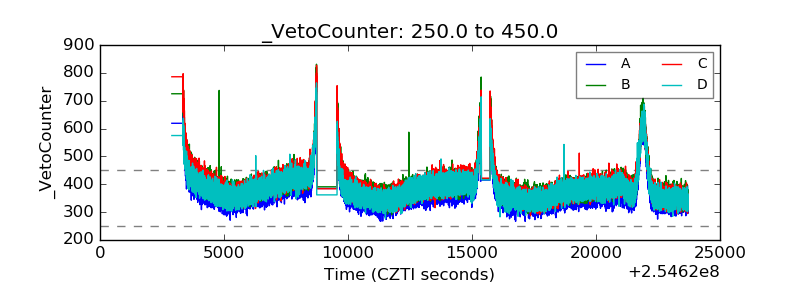 |