| Param | Original file | Final file |
|---|---|---|
| Filename | modeM0/AS1G08_071T01_9000001874_12601cztM0_level2.evt | modeM0/AS1G08_071T01_9000001874_12601cztM0_level2_quad_clean.evt |
| Size (bytes) | 2,246,673,600 | 355,227,840 |
| Size | 2.1 GB | 338.8 MB |
| Events in quadrant A | 13,941,361 | 2,194,344 |
| Events in quadrant B | 18,548,147 | 2,200,266 |
| Events in quadrant C | 14,109,884 | 2,223,815 |
| Events in quadrant D | 19,401,931 | 2,063,265 |
| Mode SS | |||
|---|---|---|---|
| Quadrant | BADHDUFLAG | Total packets | Discarded packets |
| A | 0 | 612 | 0 |
| B | 0 | 612 | 0 |
| C | 0 | 612 | 0 |
| D | 0 | 612 | 0 |
| Mode M0 | |||
|---|---|---|---|
| Quadrant | BADHDUFLAG | Total packets | Discarded packets |
| A | 0 | 61953 | 5 |
| B | 0 | 74815 | 4 |
| C | 0 | 63277 | 4 |
| D | 0 | 78793 | 4 |
| Mode M9 | |||
|---|---|---|---|
| Quadrant | BADHDUFLAG | Total packets | Discarded packets |
| A | 0 | 21 | 0 |
| B | 0 | 21 | 0 |
| C | 0 | 21 | 0 |
| D | 0 | 21 | 0 |
| Quadrant | Total seconds | Saturated seconds | Saturation percentage |
|---|---|---|---|
| A | 30205 | 592 | 1.959940% |
| B | 30205 | 1628 | 5.389836% |
| C | 30205 | 533 | 1.764609% |
| D | 30205 | 2011 | 6.657838% |
Noise dominated data is calculated using 1-second bins in cleaned event files. If a bin has >2000 counts, and if more than 50% of those come from <1% of pixels, then it is considered to be noise-dominated and hence unusable.
| Quadrant | # 1 sec bins | Bins with >0 counts | Bins with >2000 counts | High rate bins dominated by noise | Noise dominated (total time) | Noise dominated (detector-on time) | Marked lightcurve |
|---|---|---|---|---|---|---|---|
| A | 32341 | 30206 | 3 | 3 | 0.01% | 0.01% | 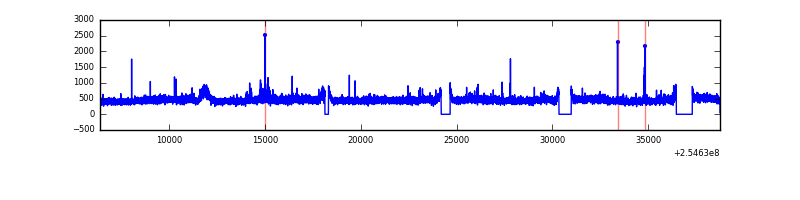 |
| B | 32341 | 30206 | 808 | 808 | 2.50% | 2.67% | 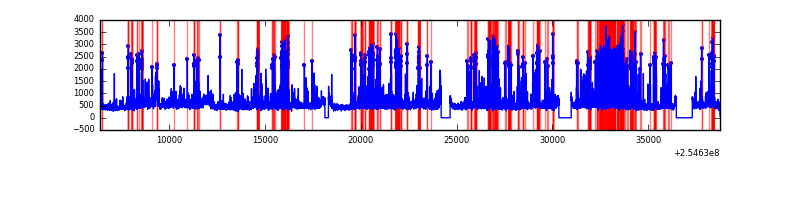 |
| C | 32341 | 30206 | 122 | 122 | 0.38% | 0.40% | 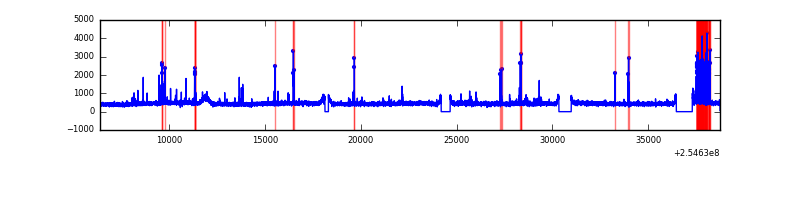 |
| D | 32341 | 30206 | 1468 | 1468 | 4.54% | 4.86% | 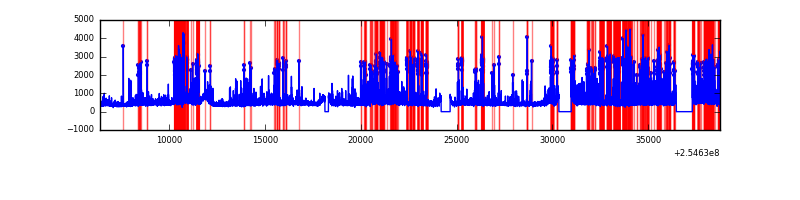 |
Top three noisy pixels from each quadrant. If the there are fewer than three noisy pixels in the level2.evt file, extra rows are filled as -1
| Pixel properties | Quadrant properties | ||||||
|---|---|---|---|---|---|---|---|
| Quadrant | DetID | PixID | Counts | Sigma | Mean | Median | Sigma |
| A | 12 | 189 | 177888 | 241.27 | 3549 | 3460 | 722.9 |
| A | 8 | 15 | 44229 | 56.39 | 3549 | 3460 | 722.9 |
| A | 3 | 1 | 34185 | 42.5 | 3549 | 3460 | 722.9 |
| B | 4 | 239 | 2963303 | 4435.57 | 3505 | 3412 | 667.3 |
| B | 3 | 64 | 1401638 | 2095.32 | 3505 | 3412 | 667.3 |
| B | 0 | 214 | 140783 | 205.86 | 3505 | 3412 | 667.3 |
| C | 15 | 208 | 445984 | 557.54 | 3449 | 3455 | 793.7 |
| C | 14 | 234 | 211698 | 262.36 | 3449 | 3455 | 793.7 |
| C | 13 | 61 | 25260 | 27.47 | 3449 | 3455 | 793.7 |
| D | 1 | 52 | 3556686 | 4496.38 | 3326 | 3221 | 790.3 |
| D | 10 | 157 | 2527811 | 3194.49 | 3326 | 3221 | 790.3 |
| D | 10 | 199 | 325374 | 407.64 | 3326 | 3221 | 790.3 |
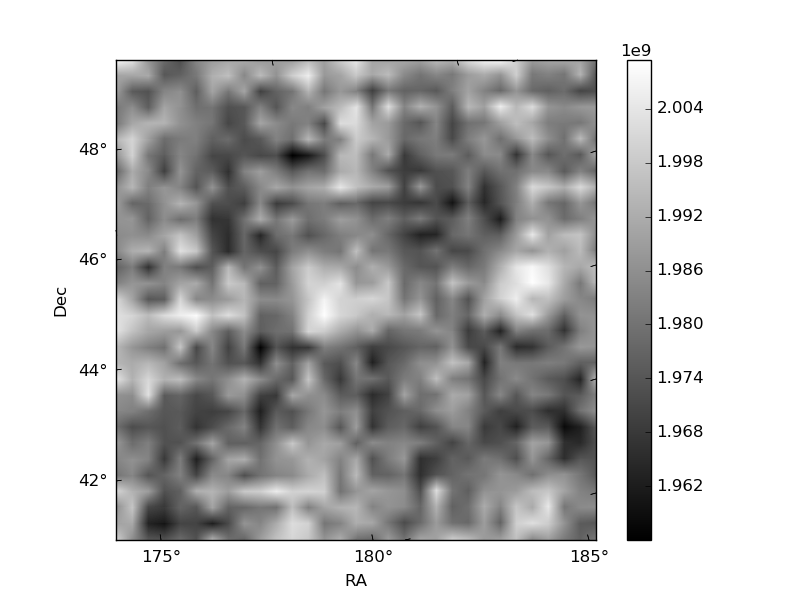
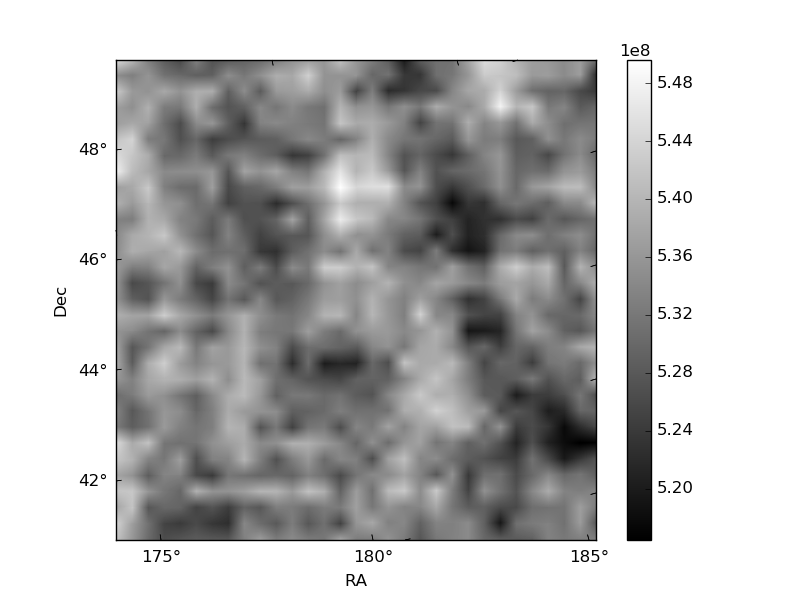
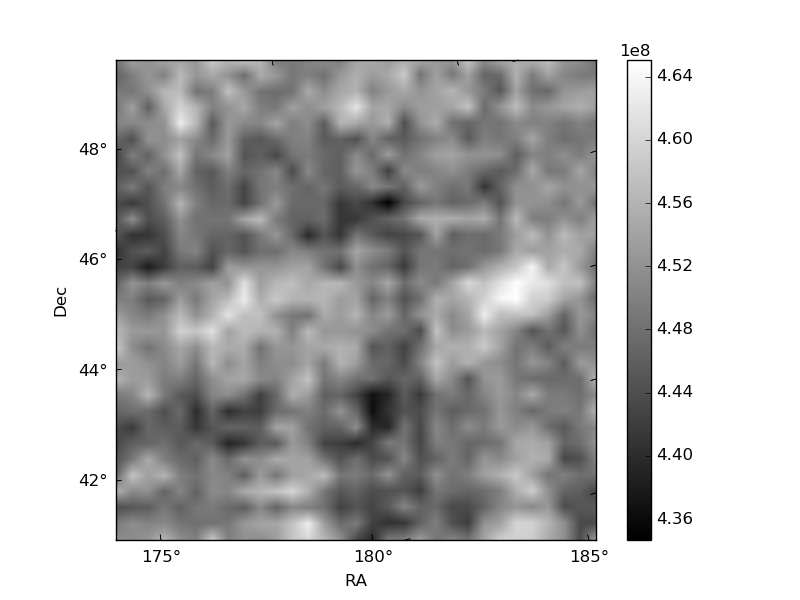
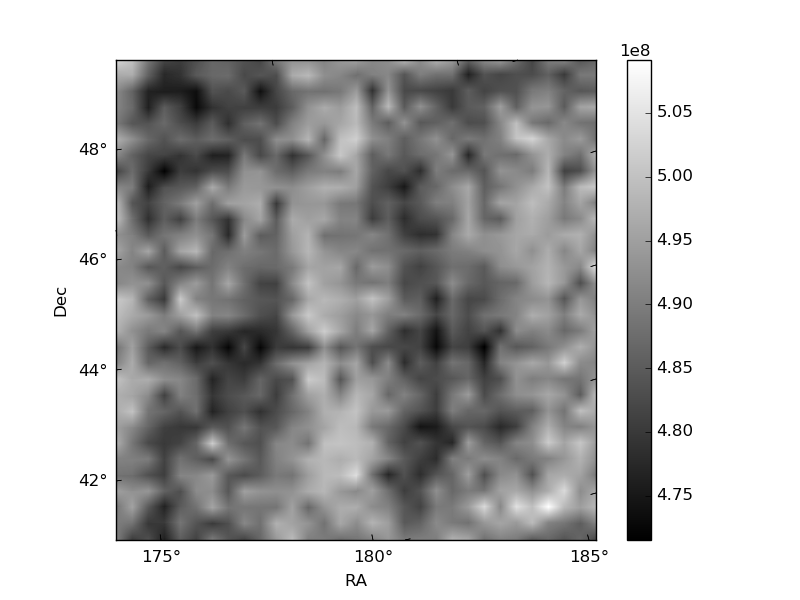
Histogram calculated using DETX and DETY for each event in the final _common_clean file
| Quadrant A | 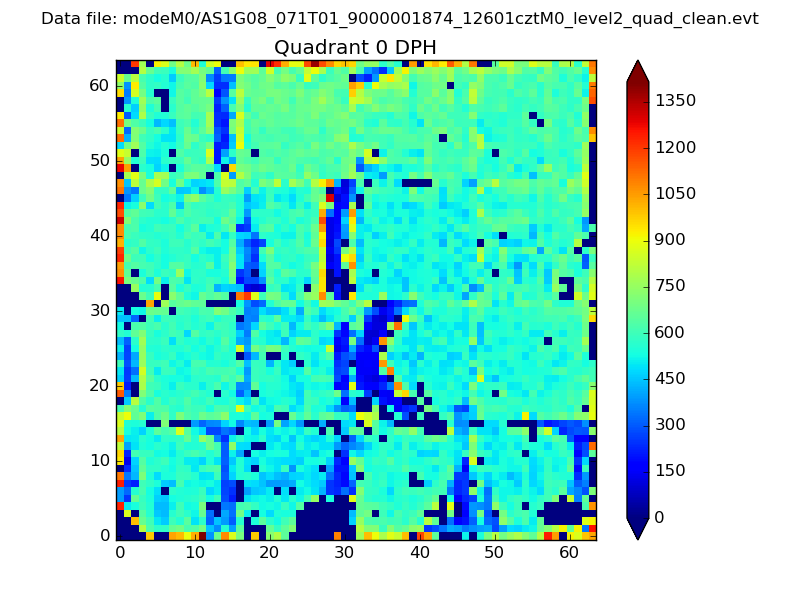 |
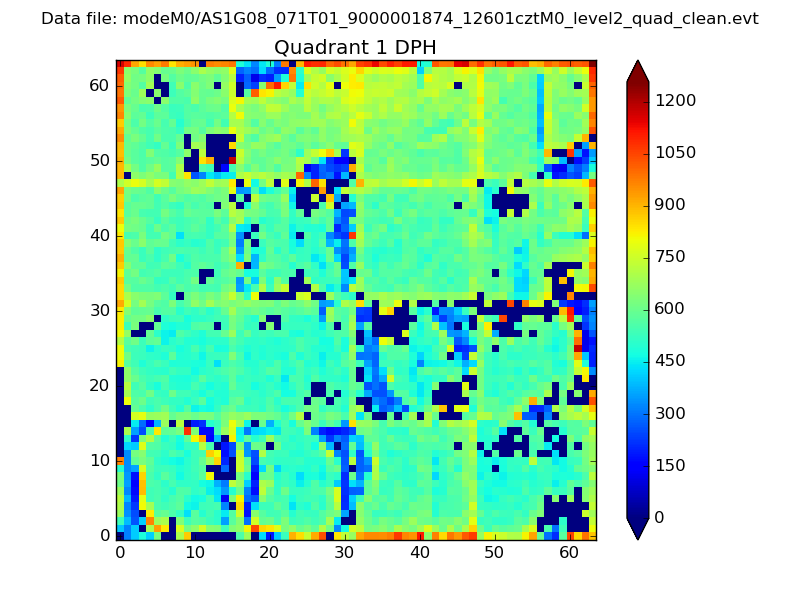 |
Quadrant B |
|---|---|---|---|
| Quadrant D | 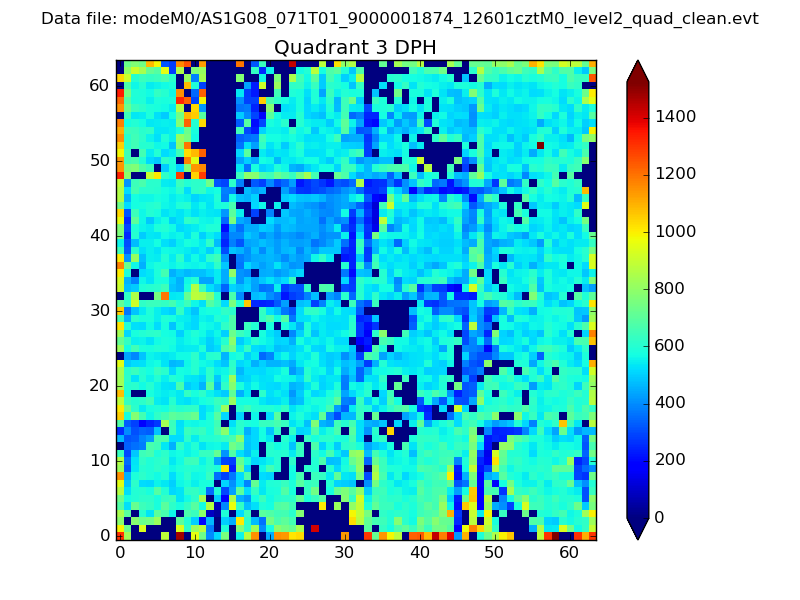 |
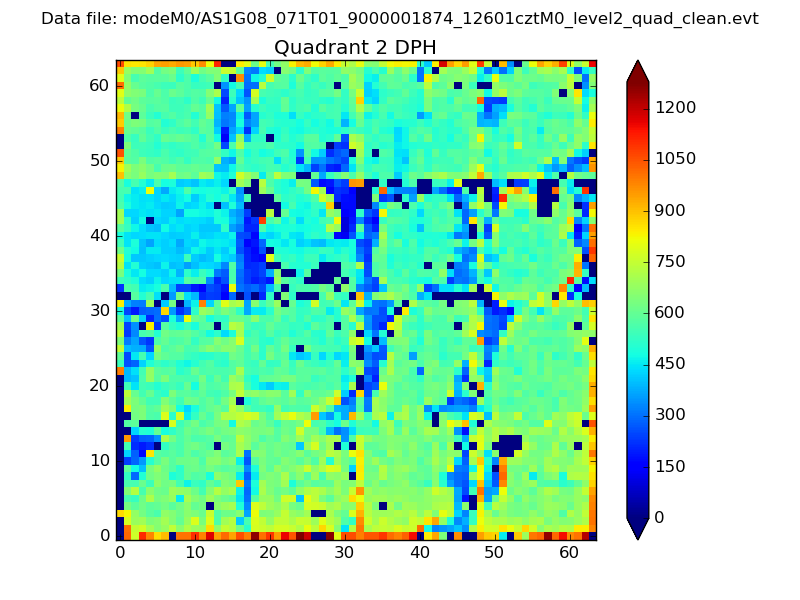 |
Quadrant C |
| Plot type | Count rate plots | Images |
|---|---|---|
| Comparison with Poisson distribution Blue bars denote a histogram of data divided into 1 sec bins. Red curve is a Poisson curve with rate = median count rate of data. |
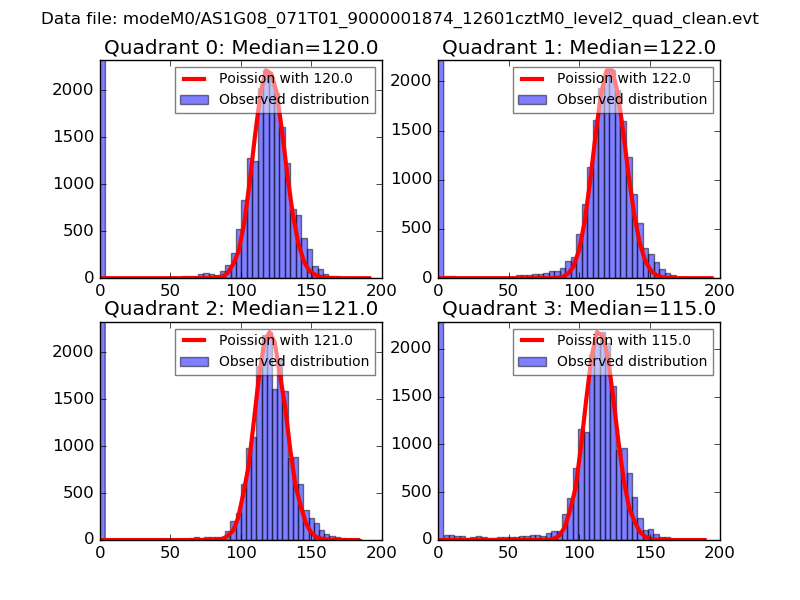 |
 |
| Quadrant-wise count rates Data is divided into 100 sec bins |
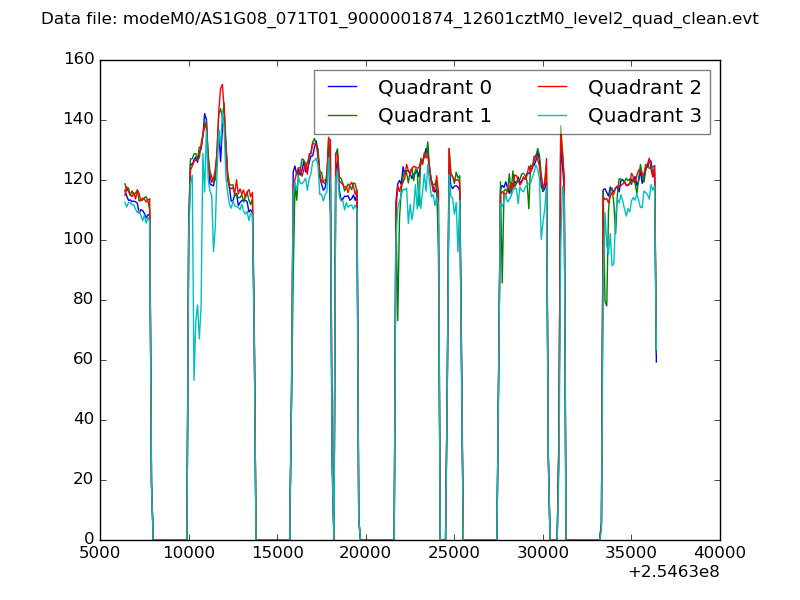 |
|
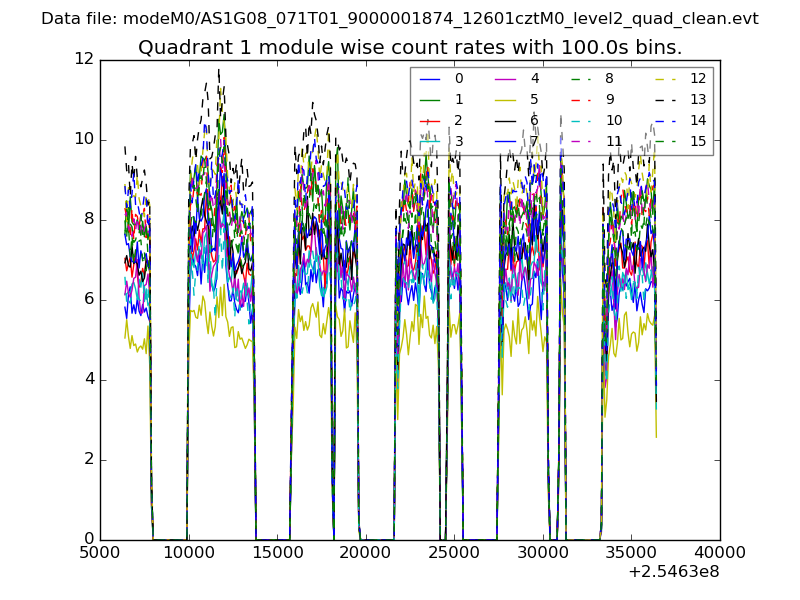
| Module-wise count rates for Quadrant A Data is divided into 100 sec bins |
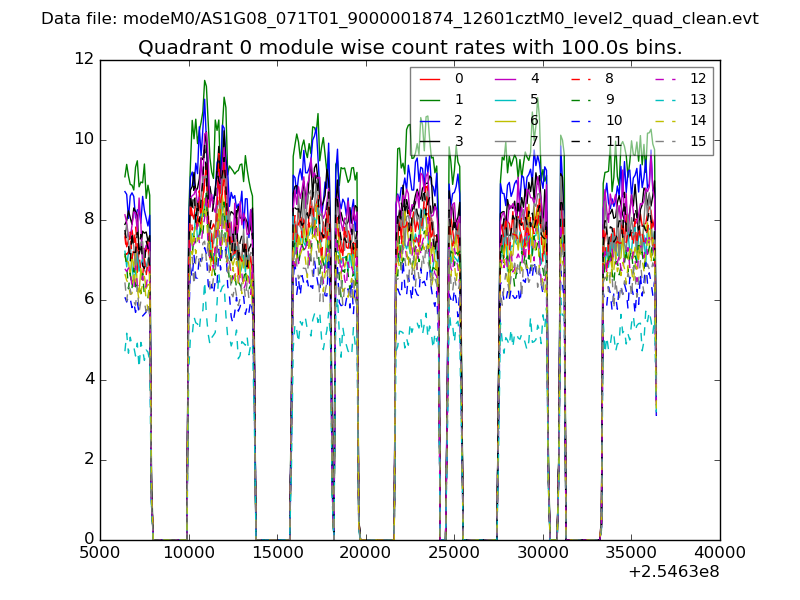 |
 |
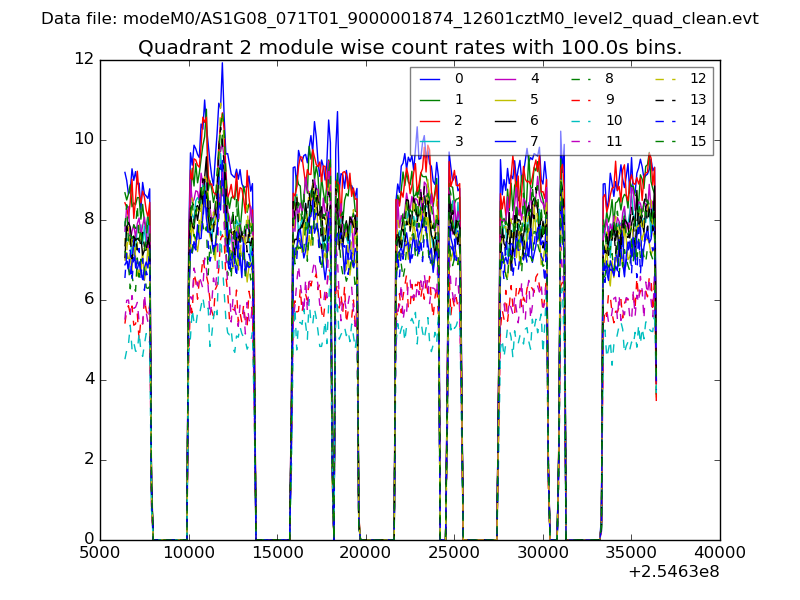
| Module-wise count rates for Quadrant B Data is divided into 100 sec bins |
 |
 |
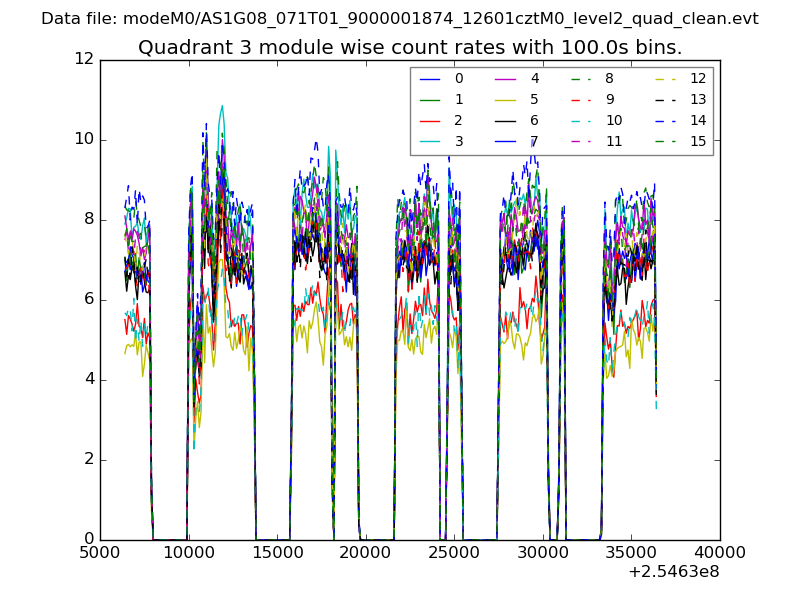
| Module-wise count rates for Quadrant C Data is divided into 100 sec bins |
 |
 |
| Module-wise count rates for Quadrant D Data is divided into 100 sec bins |
 |
 |
| Parameter | Plot |
|---|---|
| CZT HV Monitor | 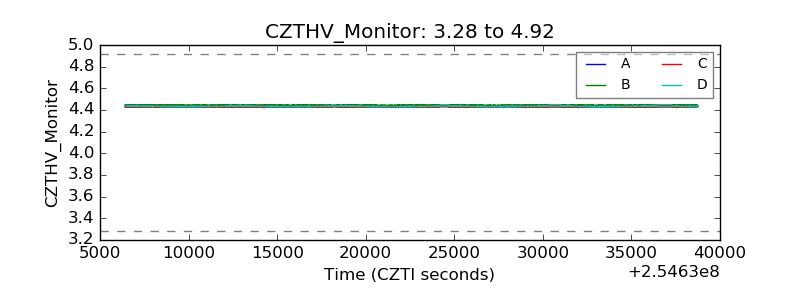 |
| D_VDD | 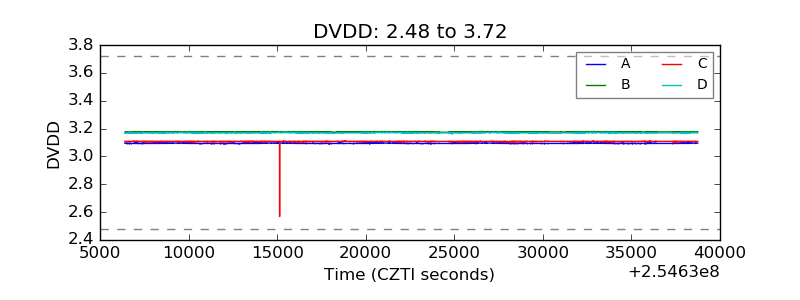 |
| Temperature 1 | 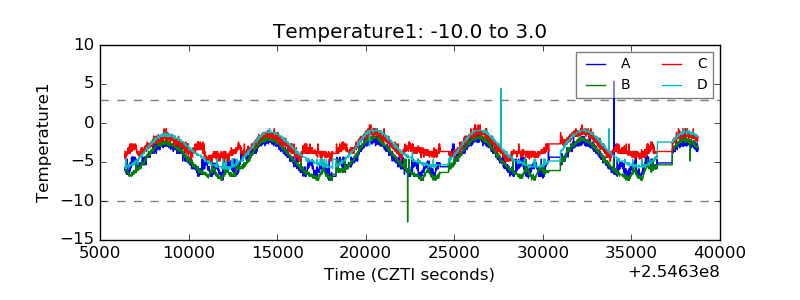 |
| Veto HV Monitor | 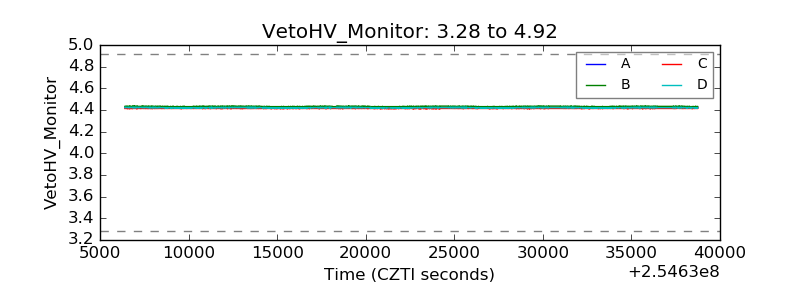 |
| Veto LLD | 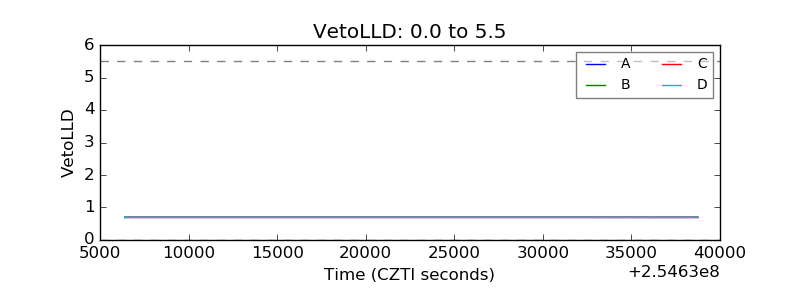 |
| Alpha Counter | 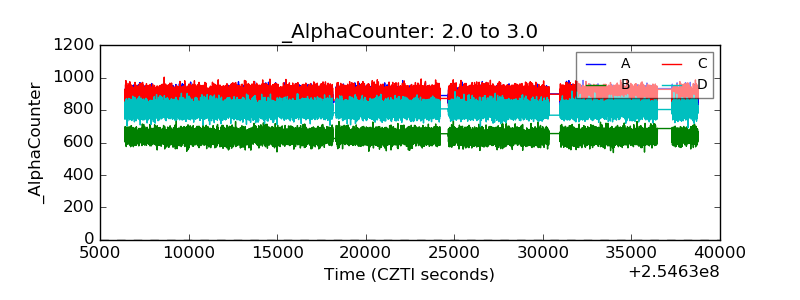 |
| _CPM_Rate | 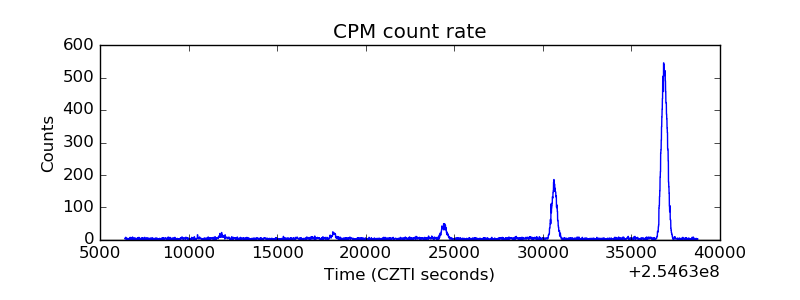 |
| CZT Counter | 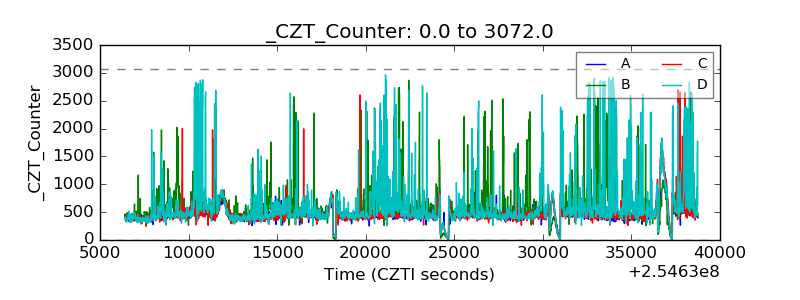 |
| +2.5 Volts monitor |  |
| +5 Volts monitor |  |
| _ROLL_ROT | 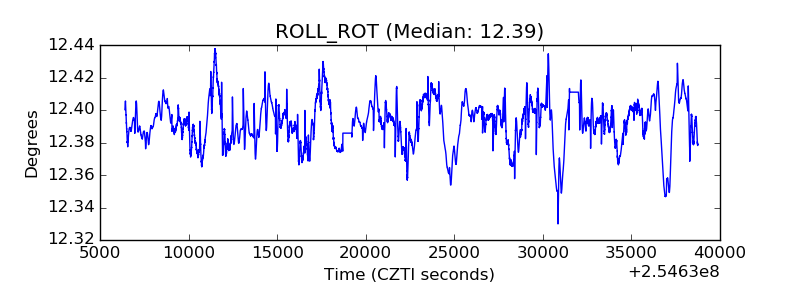 |
| _Roll_DEC | 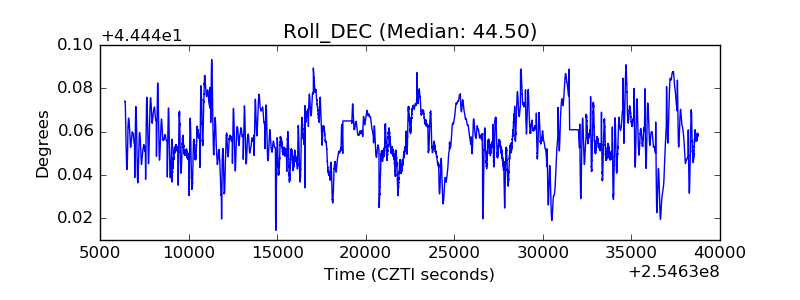 |
| _Roll_RA | 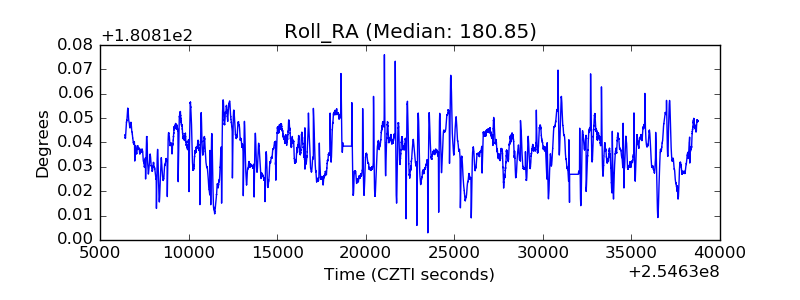 |
| Veto Counter |  |