| Param | Original file | Final file |
|---|---|---|
| Filename | modeM0/AS1G08_071T01_9000001874_12604cztM0_level2.evt | modeM0/AS1G08_071T01_9000001874_12604cztM0_level2_quad_clean.evt |
| Size (bytes) | 521,994,240 | 74,672,640 |
| Size | 497.8 MB | 71.2 MB |
| Events in quadrant A | 3,077,065 | 465,514 |
| Events in quadrant B | 4,392,854 | 451,267 |
| Events in quadrant C | 3,048,370 | 469,411 |
| Events in quadrant D | 4,863,015 | 435,242 |
| Mode SS | |||
|---|---|---|---|
| Quadrant | BADHDUFLAG | Total packets | Discarded packets |
| A | 0 | 126 | 0 |
| B | 0 | 126 | 0 |
| C | 0 | 126 | 0 |
| D | 0 | 126 | 0 |
| Mode M0 | |||
|---|---|---|---|
| Quadrant | BADHDUFLAG | Total packets | Discarded packets |
| A | 0 | 13446 | 3 |
| B | 0 | 17346 | 2 |
| C | 0 | 13338 | 2 |
| D | 0 | 18861 | 2 |
| Mode M9 | |||
|---|---|---|---|
| Quadrant | BADHDUFLAG | Total packets | Discarded packets |
| A | 0 | 19 | 0 |
| B | 0 | 19 | 0 |
| C | 0 | 19 | 0 |
| D | 0 | 20 | 0 |
| Quadrant | Total seconds | Saturated seconds | Saturation percentage |
|---|---|---|---|
| A | 6304 | 62 | 0.983503% |
| B | 6304 | 527 | 8.359772% |
| C | 6304 | 52 | 0.824873% |
| D | 6304 | 431 | 6.836929% |
Noise dominated data is calculated using 1-second bins in cleaned event files. If a bin has >2000 counts, and if more than 50% of those come from <1% of pixels, then it is considered to be noise-dominated and hence unusable.
| Quadrant | # 1 sec bins | Bins with >0 counts | Bins with >2000 counts | High rate bins dominated by noise | Noise dominated (total time) | Noise dominated (detector-on time) | Marked lightcurve |
|---|---|---|---|---|---|---|---|
| A | 7470 | 6305 | 0 | 0 | 0.00% | 0.00% | 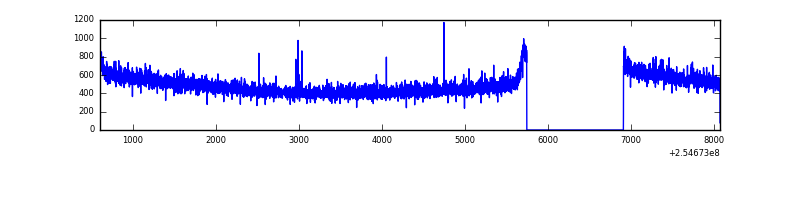 |
| B | 7470 | 6305 | 356 | 356 | 4.77% | 5.65% | 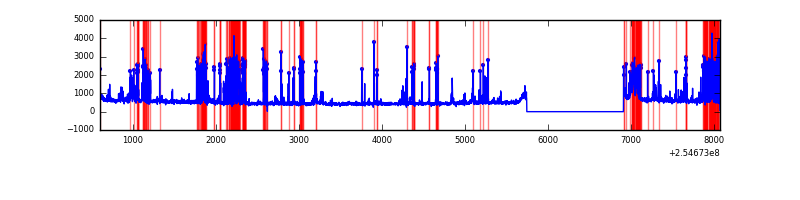 |
| C | 7470 | 6305 | 0 | 0 | 0.00% | 0.00% | 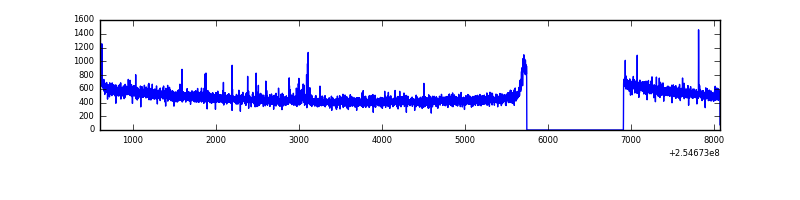 |
| D | 7470 | 6305 | 253 | 253 | 3.39% | 4.01% | 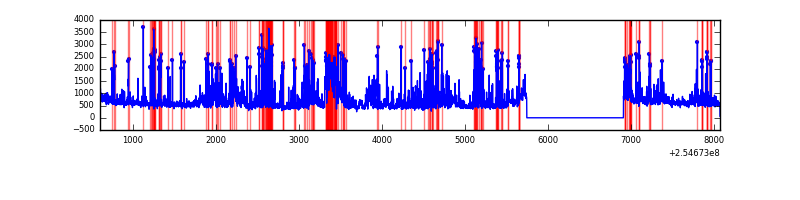 |
Top three noisy pixels from each quadrant. If the there are fewer than three noisy pixels in the level2.evt file, extra rows are filled as -1
| Pixel properties | Quadrant properties | ||||||
|---|---|---|---|---|---|---|---|
| Quadrant | DetID | PixID | Counts | Sigma | Mean | Median | Sigma |
| A | 3 | 1 | 22318 | 135.42 | 788 | 770 | 159.1 |
| A | 12 | 189 | 15419 | 92.06 | 788 | 770 | 159.1 |
| A | 0 | 226 | 6986 | 39.06 | 788 | 770 | 159.1 |
| B | 4 | 239 | 1293110 | 8959.0 | 761 | 746 | 144.3 |
| B | 0 | 197 | 42896 | 292.19 | 761 | 746 | 144.3 |
| B | 3 | 209 | 39397 | 267.94 | 761 | 746 | 144.3 |
| C | 15 | 208 | 21657 | 117.14 | 775 | 779 | 178.2 |
| C | 14 | 234 | 7457 | 37.47 | 775 | 779 | 178.2 |
| C | 13 | 61 | 5650 | 27.33 | 775 | 779 | 178.2 |
| D | 1 | 52 | 1879400 | 10325.0 | 752 | 731 | 182.0 |
| D | 1 | 255 | 43907 | 237.29 | 752 | 731 | 182.0 |
| D | 13 | 104 | 32939 | 177.01 | 752 | 731 | 182.0 |
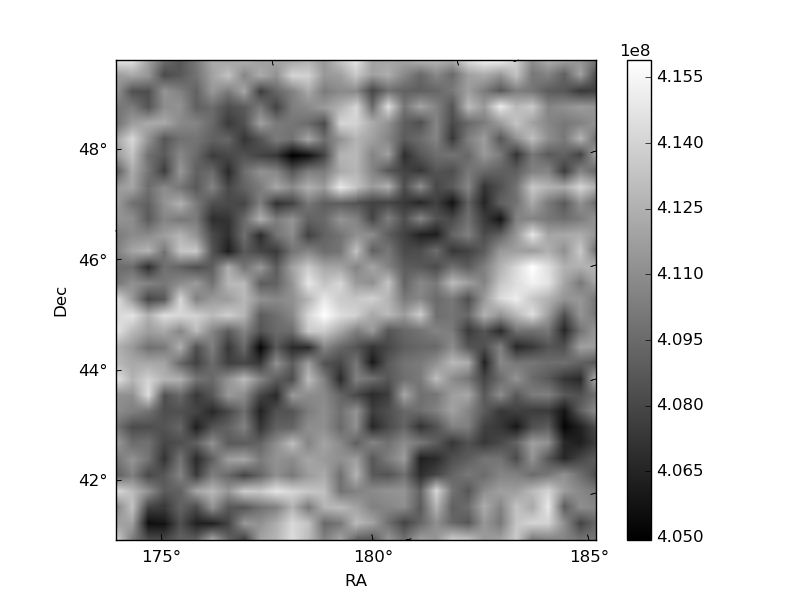
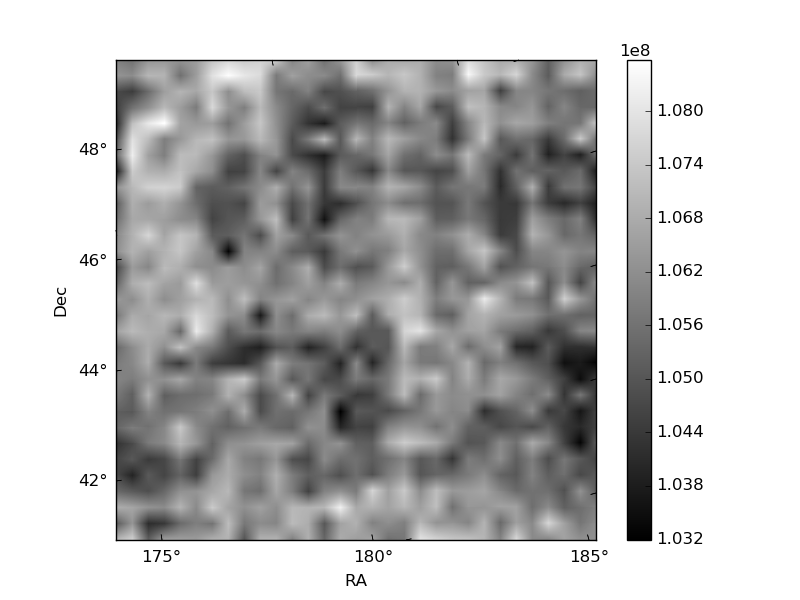
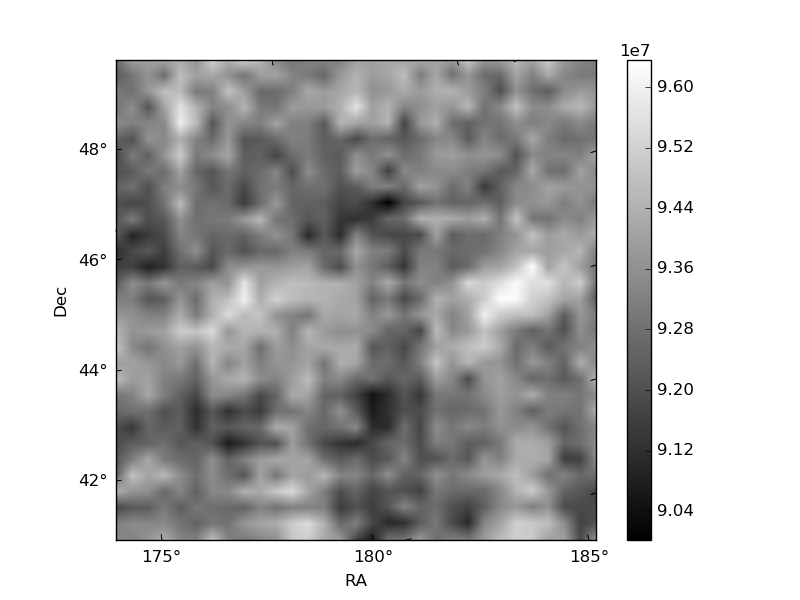
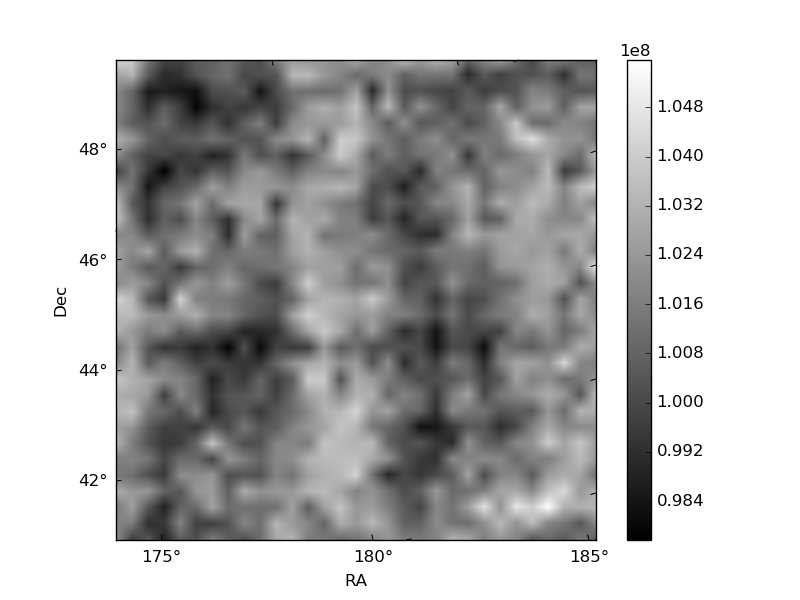
Histogram calculated using DETX and DETY for each event in the final _common_clean file
| Quadrant A | 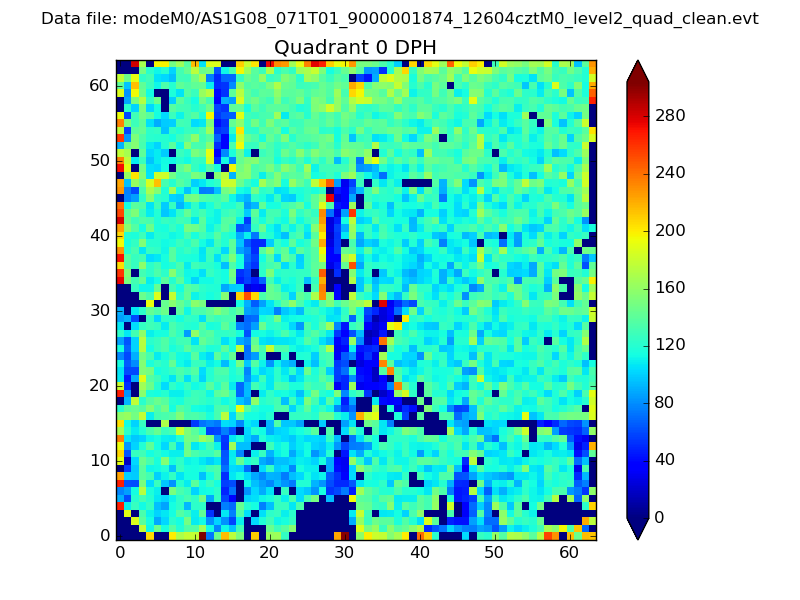 |
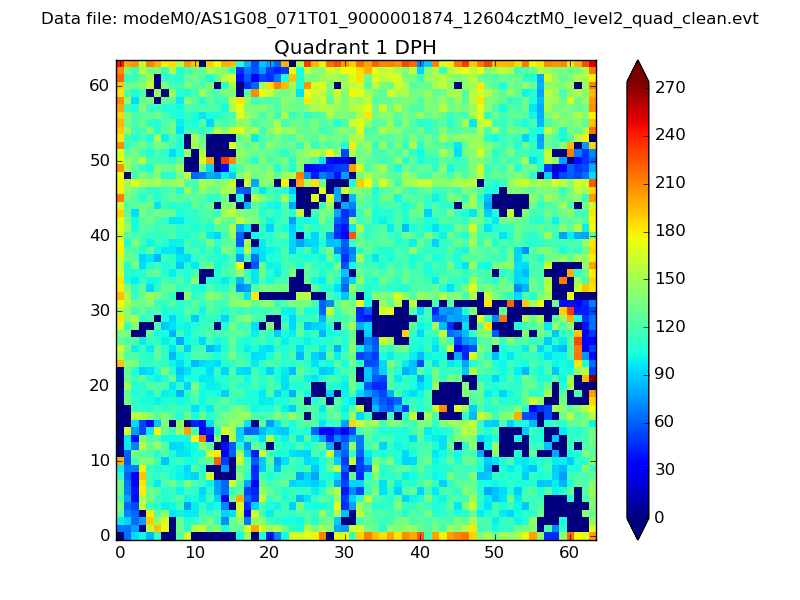 |
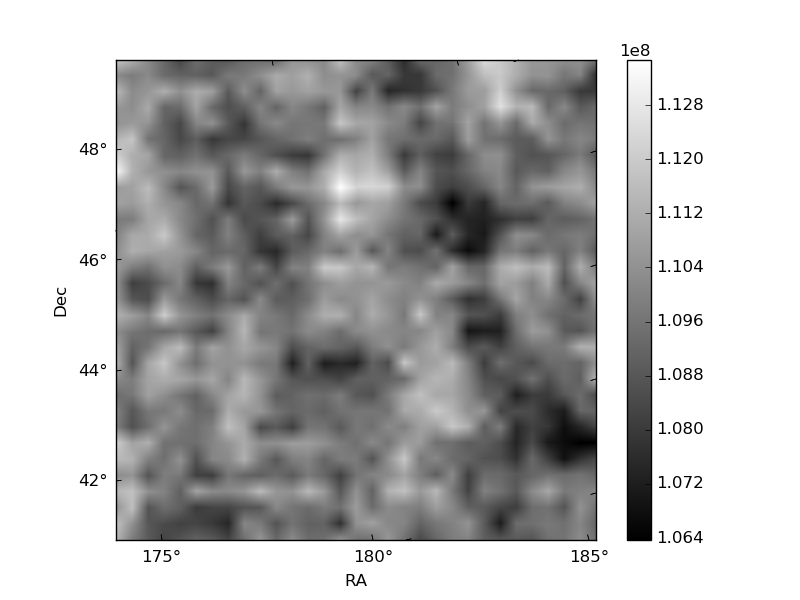
Quadrant B |
|---|---|---|---|
| Quadrant D | 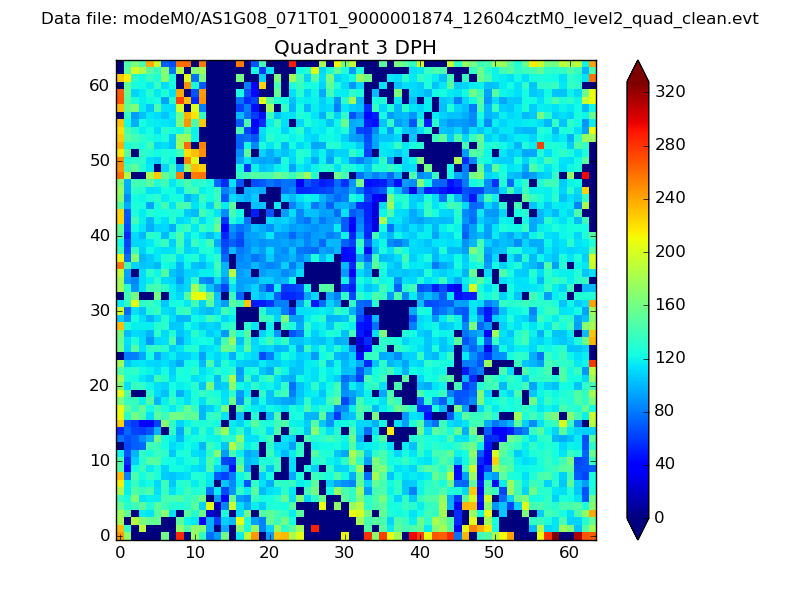 |
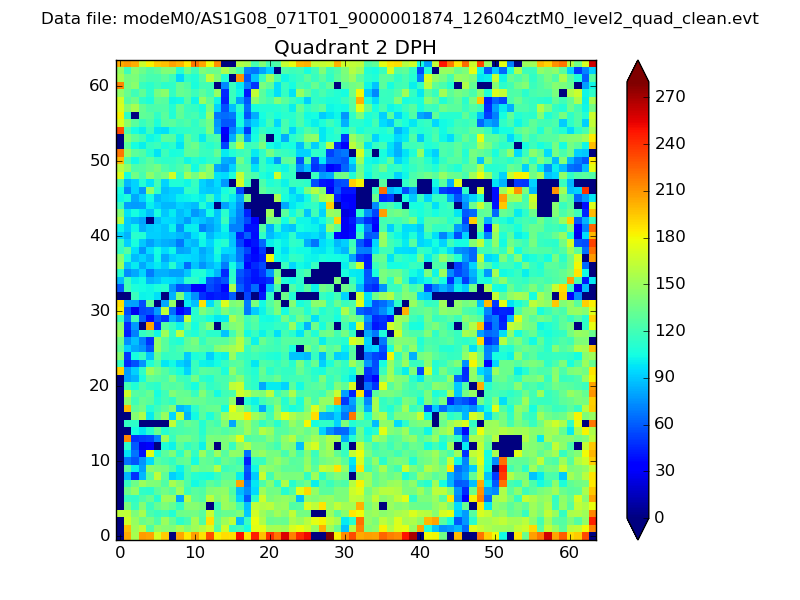 |
Quadrant C |
| Plot type | Count rate plots | Images |
|---|---|---|
| Comparison with Poisson distribution Blue bars denote a histogram of data divided into 1 sec bins. Red curve is a Poisson curve with rate = median count rate of data. |
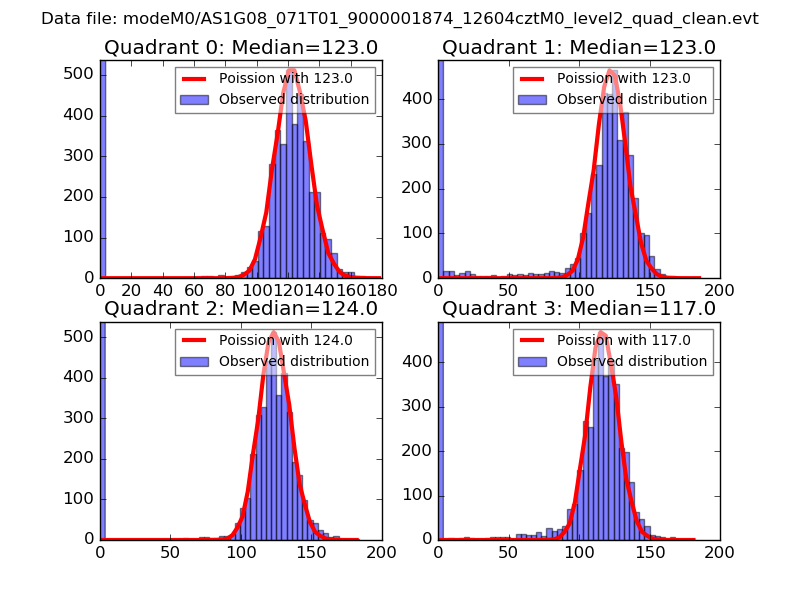 |
 |
| Quadrant-wise count rates Data is divided into 100 sec bins |
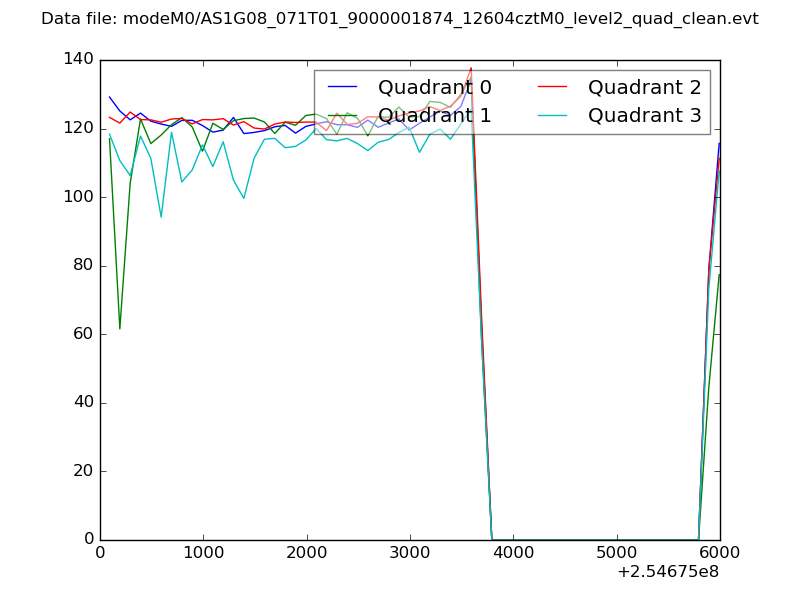 |
|
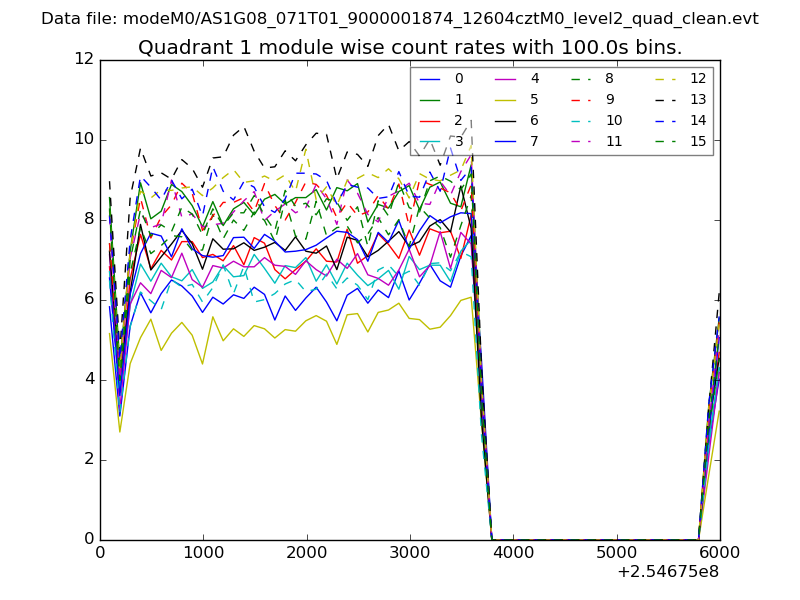
| Module-wise count rates for Quadrant A Data is divided into 100 sec bins |
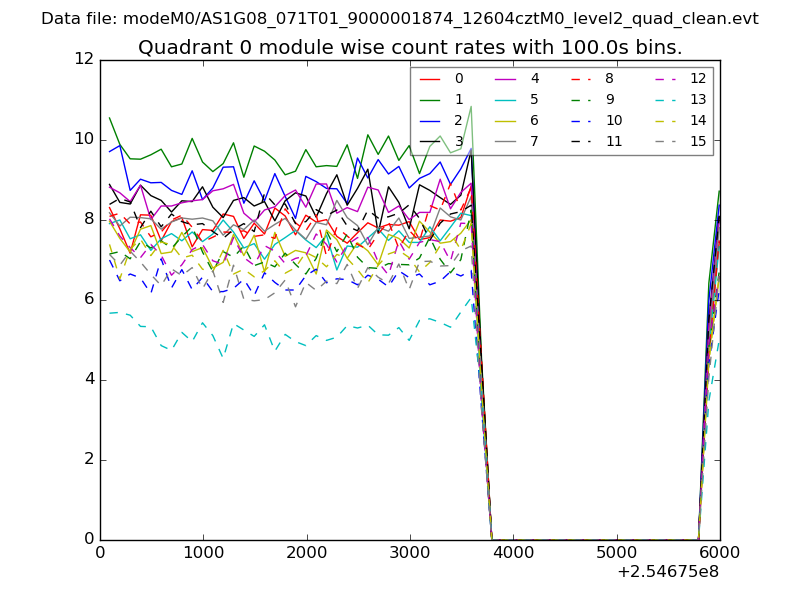 |
 |
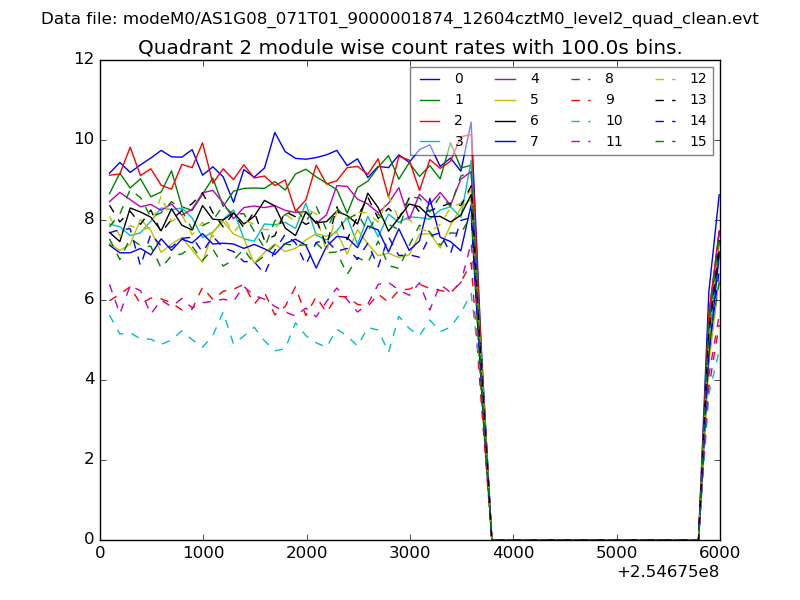
| Module-wise count rates for Quadrant B Data is divided into 100 sec bins |
 |
 |
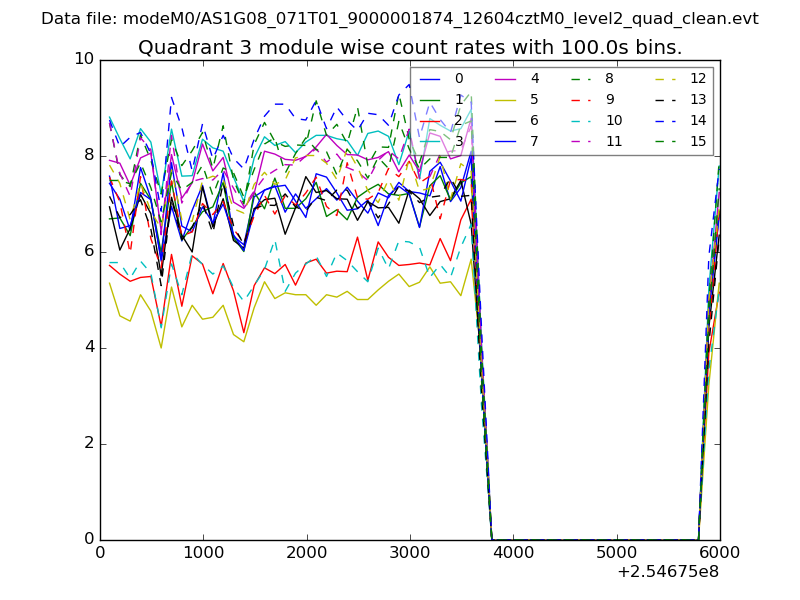
| Module-wise count rates for Quadrant C Data is divided into 100 sec bins |
 |
 |
| Module-wise count rates for Quadrant D Data is divided into 100 sec bins |
 |
 |
| Parameter | Plot |
|---|---|
| CZT HV Monitor | 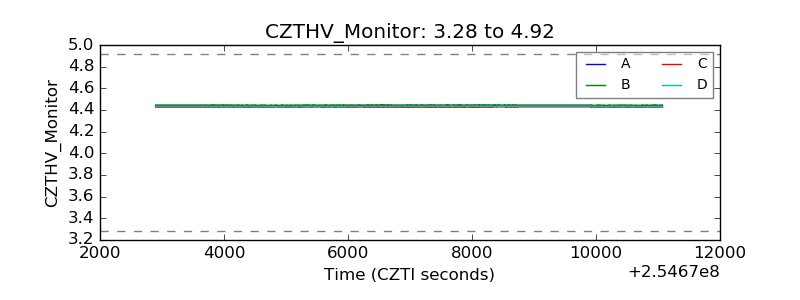 |
| D_VDD | 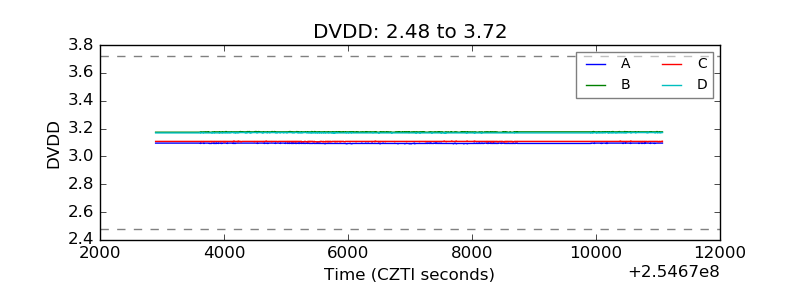 |
| Temperature 1 |  |
| Veto HV Monitor | 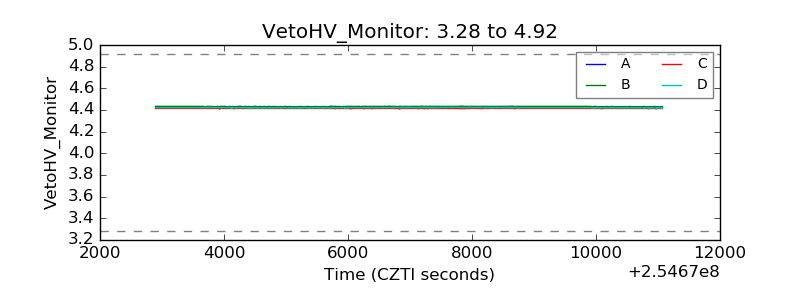 |
| Veto LLD | 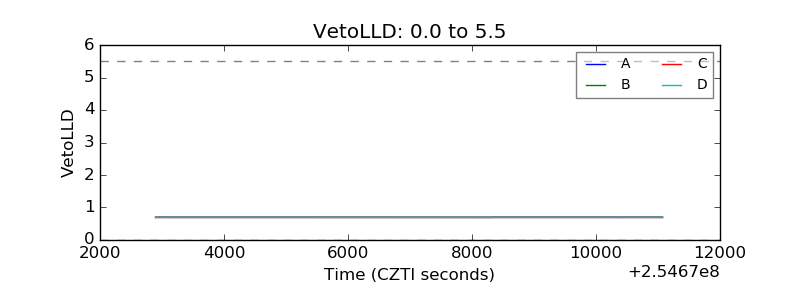 |
| Alpha Counter | 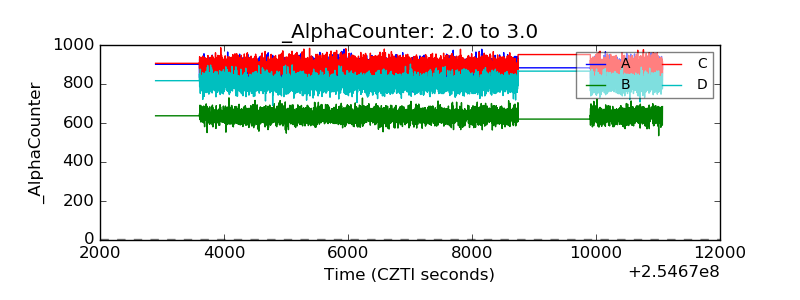 |
| _CPM_Rate | 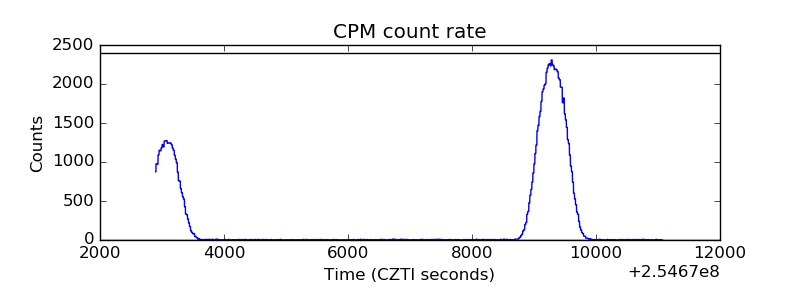 |
| CZT Counter |  |
| +2.5 Volts monitor |  |
| +5 Volts monitor |  |
| _ROLL_ROT | 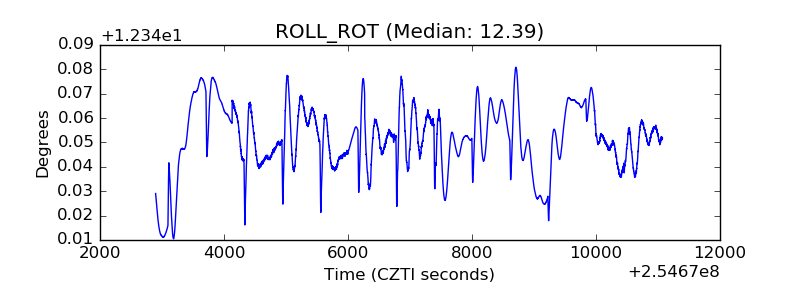 |
| _Roll_DEC | 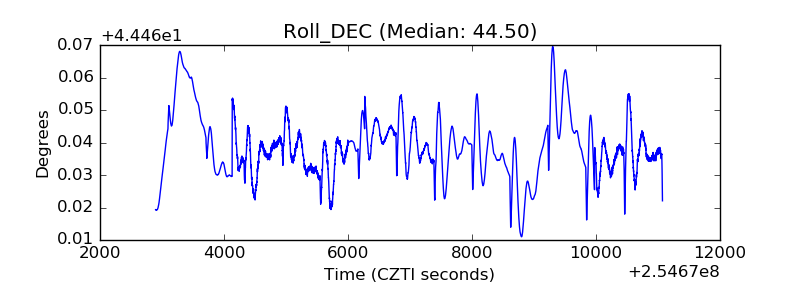 |
| _Roll_RA | 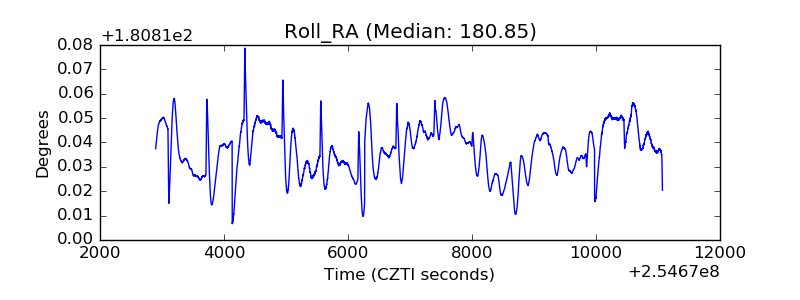 |
| Veto Counter | 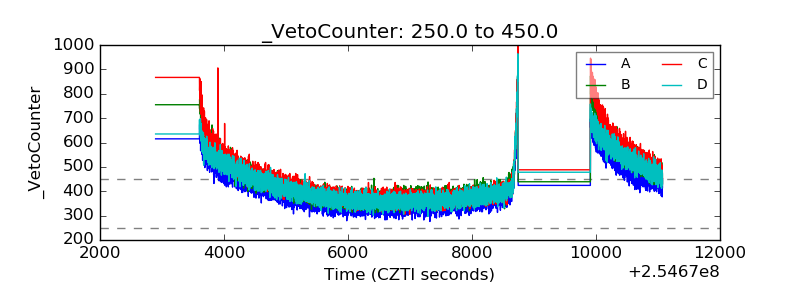 |