| Param | Original file | Final file |
|---|---|---|
| Filename | modeM0/AS1G08_071T01_9000001874_12606cztM0_level2.evt | modeM0/AS1G08_071T01_9000001874_12606cztM0_level2_quad_clean.evt |
| Size (bytes) | 530,461,440 | 101,684,160 |
| Size | 505.9 MB | 97.0 MB |
| Events in quadrant A | 3,270,627 | 666,686 |
| Events in quadrant B | 4,648,679 | 646,311 |
| Events in quadrant C | 3,734,137 | 678,311 |
| Events in quadrant D | 3,976,331 | 640,416 |
| Mode SS | |||
|---|---|---|---|
| Quadrant | BADHDUFLAG | Total packets | Discarded packets |
| A | 0 | 132 | 0 |
| B | 0 | 132 | 0 |
| C | 0 | 132 | 0 |
| D | 0 | 132 | 0 |
| Mode M0 | |||
|---|---|---|---|
| Quadrant | BADHDUFLAG | Total packets | Discarded packets |
| A | 0 | 13969 | 3 |
| B | 0 | 18176 | 2 |
| C | 0 | 15356 | 2 |
| D | 0 | 16194 | 2 |
| Mode M9 | |||
|---|---|---|---|
| Quadrant | BADHDUFLAG | Total packets | Discarded packets |
| A | 0 | 26 | 0 |
| B | 0 | 26 | 0 |
| C | 0 | 26 | 0 |
| D | 0 | 26 | 0 |
| Quadrant | Total seconds | Saturated seconds | Saturation percentage |
|---|---|---|---|
| A | 6417 | 55 | 0.857098% |
| B | 6417 | 649 | 10.113760% |
| C | 6417 | 140 | 2.181705% |
| D | 6417 | 253 | 3.942652% |
Noise dominated data is calculated using 1-second bins in cleaned event files. If a bin has >2000 counts, and if more than 50% of those come from <1% of pixels, then it is considered to be noise-dominated and hence unusable.
| Quadrant | # 1 sec bins | Bins with >0 counts | Bins with >2000 counts | High rate bins dominated by noise | Noise dominated (total time) | Noise dominated (detector-on time) | Marked lightcurve |
|---|---|---|---|---|---|---|---|
| A | 9033 | 6418 | 1 | 1 | 0.01% | 0.02% | 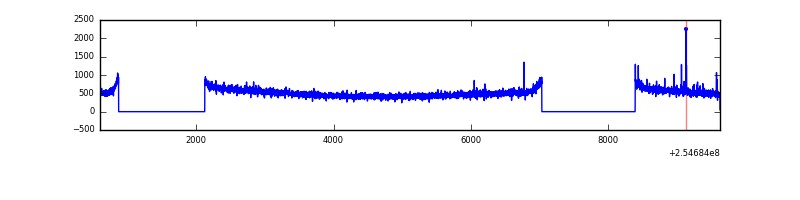 |
| B | 9033 | 6418 | 456 | 456 | 5.05% | 7.11% | 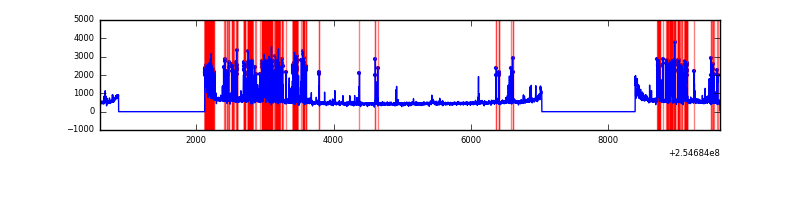 |
| C | 9033 | 6419 | 97 | 97 | 1.07% | 1.51% | 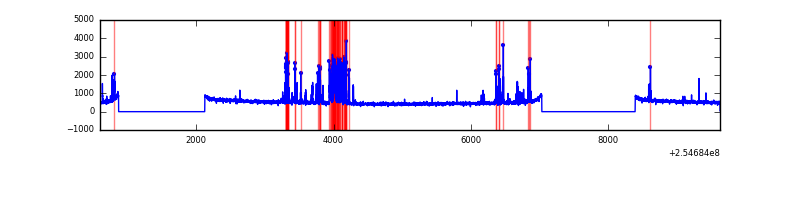 |
| D | 9033 | 6419 | 128 | 128 | 1.42% | 1.99% | 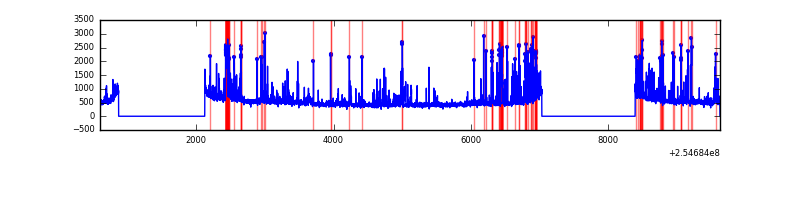 |
Top three noisy pixels from each quadrant. If the there are fewer than three noisy pixels in the level2.evt file, extra rows are filled as -1
| Pixel properties | Quadrant properties | ||||||
|---|---|---|---|---|---|---|---|
| Quadrant | DetID | PixID | Counts | Sigma | Mean | Median | Sigma |
| A | 3 | 1 | 45110 | 262.91 | 832 | 815 | 168.5 |
| A | 9 | 143 | 17823 | 100.95 | 832 | 815 | 168.5 |
| A | 12 | 189 | 9067 | 48.98 | 832 | 815 | 168.5 |
| B | 4 | 239 | 1416519 | 9573.31 | 792 | 773 | 147.9 |
| B | 0 | 85 | 43626 | 289.77 | 792 | 773 | 147.9 |
| B | 3 | 209 | 30613 | 201.78 | 792 | 773 | 147.9 |
| C | 15 | 208 | 479466 | 2543.66 | 825 | 832 | 188.2 |
| C | 14 | 234 | 38971 | 202.69 | 825 | 832 | 188.2 |
| C | 13 | 61 | 6124 | 28.12 | 825 | 832 | 188.2 |
| D | 1 | 52 | 670448 | 3518.55 | 803 | 783 | 190.3 |
| D | 10 | 199 | 154941 | 809.98 | 803 | 783 | 190.3 |
| D | 13 | 249 | 57878 | 299.99 | 803 | 783 | 190.3 |
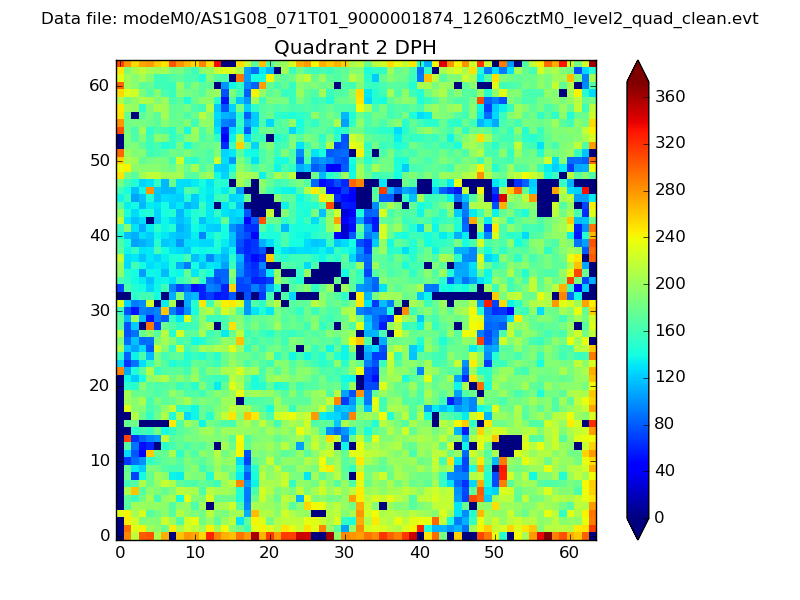
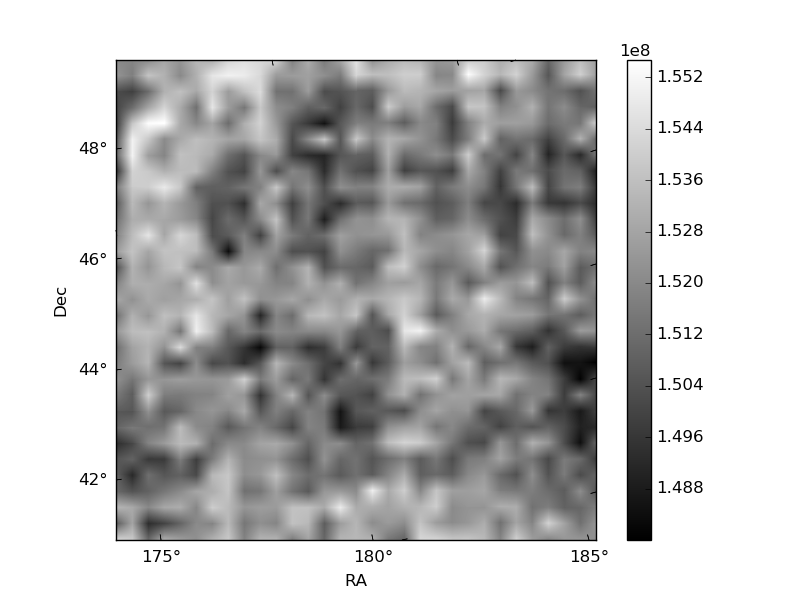
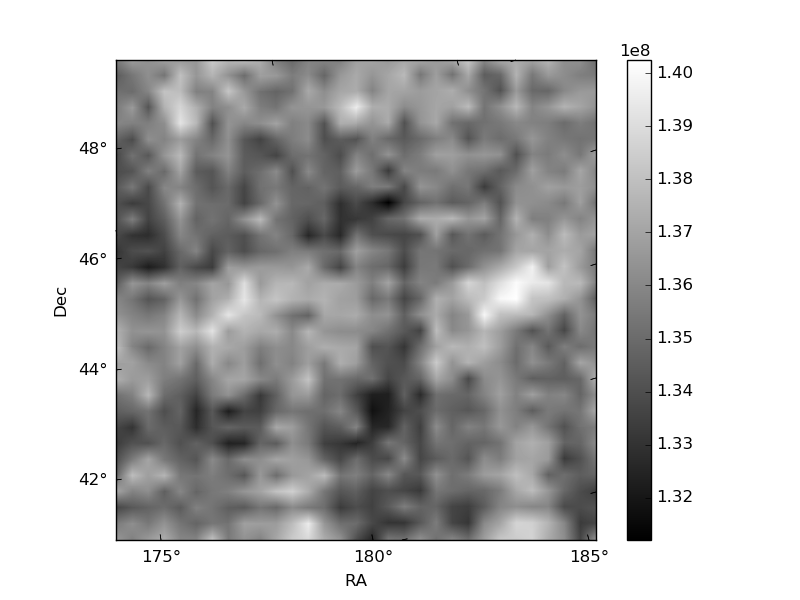
Histogram calculated using DETX and DETY for each event in the final _common_clean file
| Quadrant A | 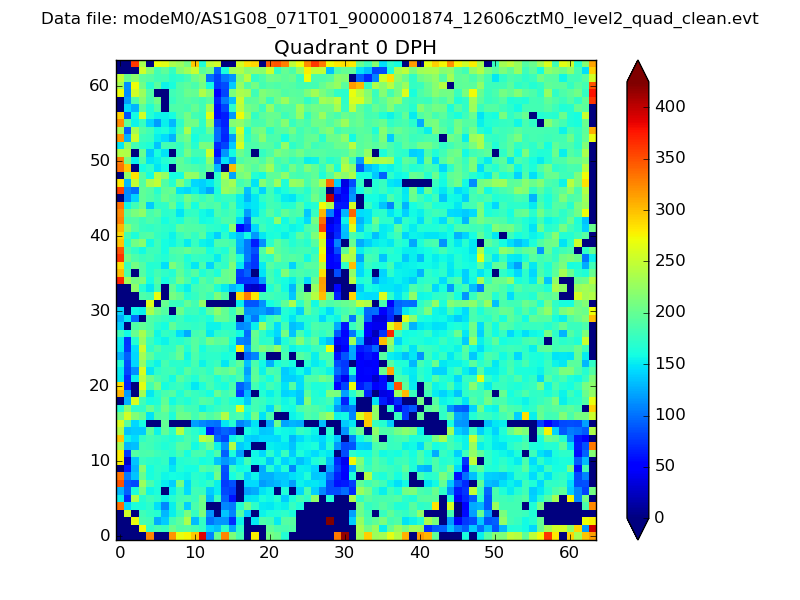 |
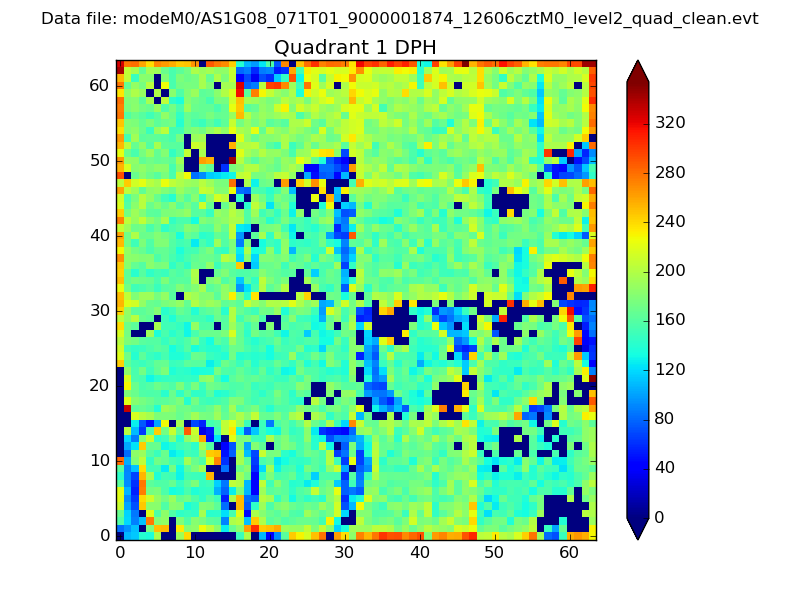 |
Quadrant B |
|---|---|---|---|
| Quadrant D | 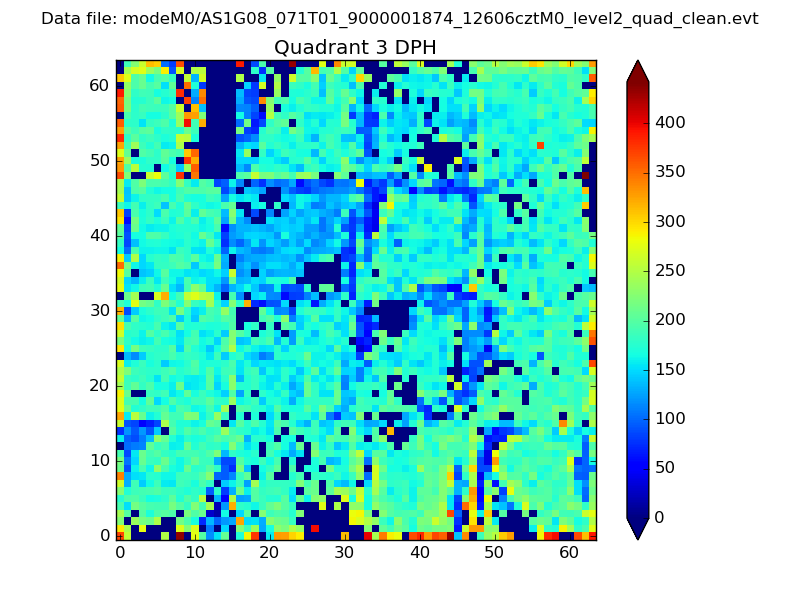 |
 |
Quadrant C |
| Plot type | Count rate plots | Images |
|---|---|---|
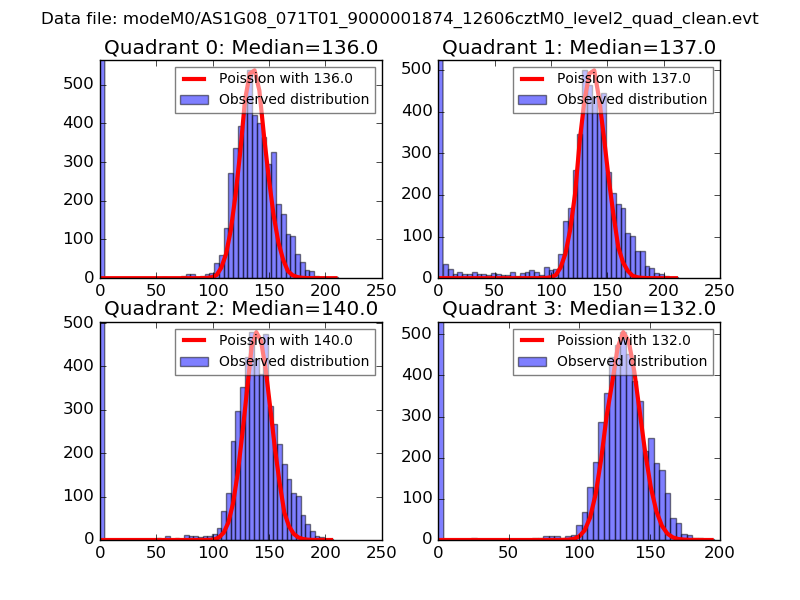
| Comparison with Poisson distribution Blue bars denote a histogram of data divided into 1 sec bins. Red curve is a Poisson curve with rate = median count rate of data. |
 |
 |
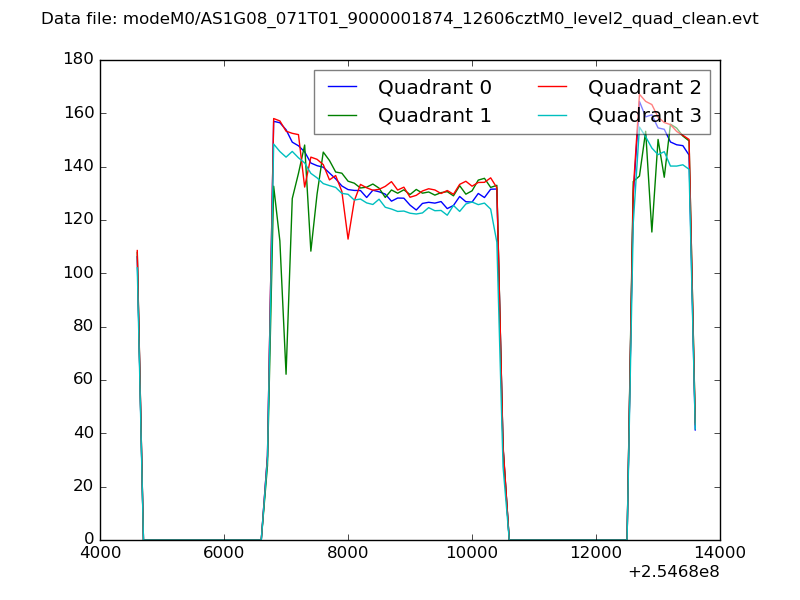
| Quadrant-wise count rates Data is divided into 100 sec bins |
 |
|
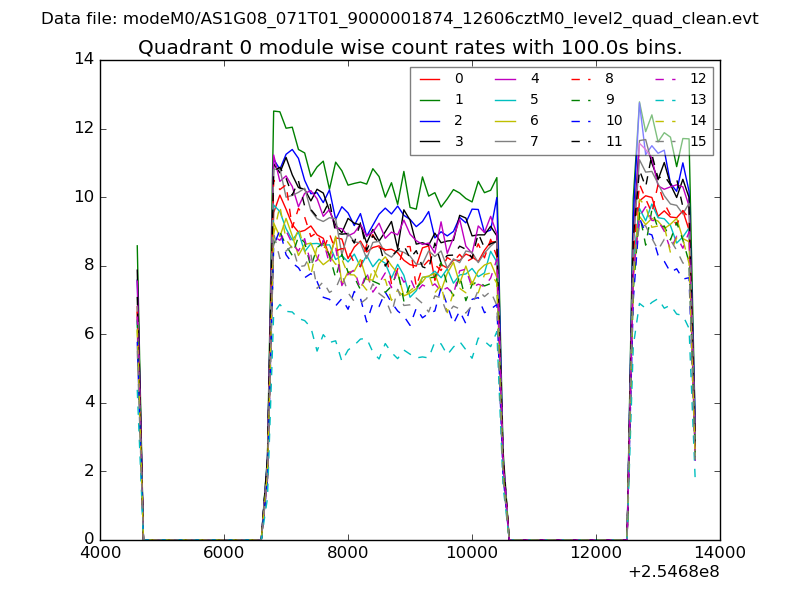
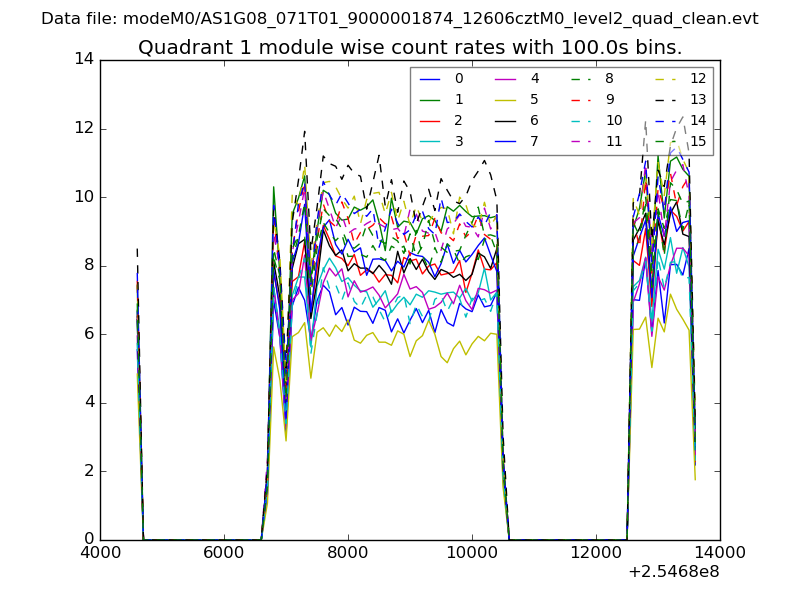
| Module-wise count rates for Quadrant A Data is divided into 100 sec bins |
 |
 |
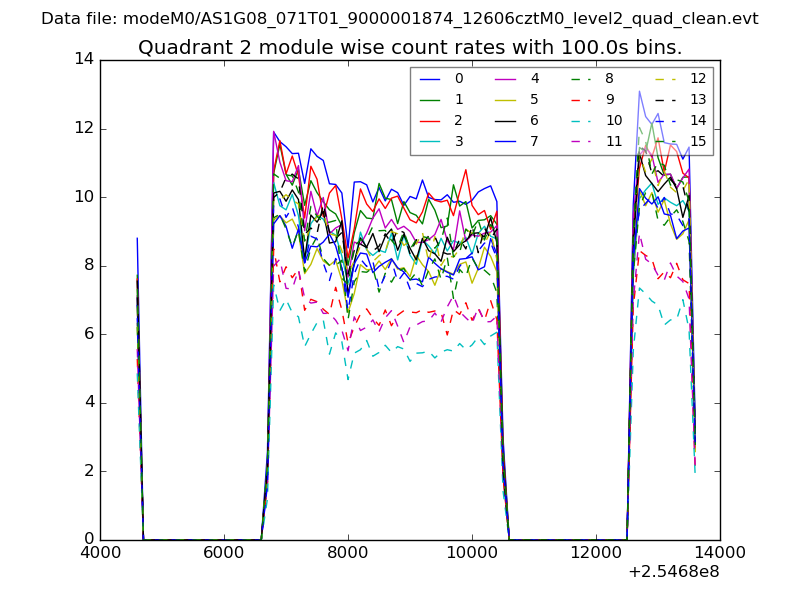
| Module-wise count rates for Quadrant B Data is divided into 100 sec bins |
 |
 |
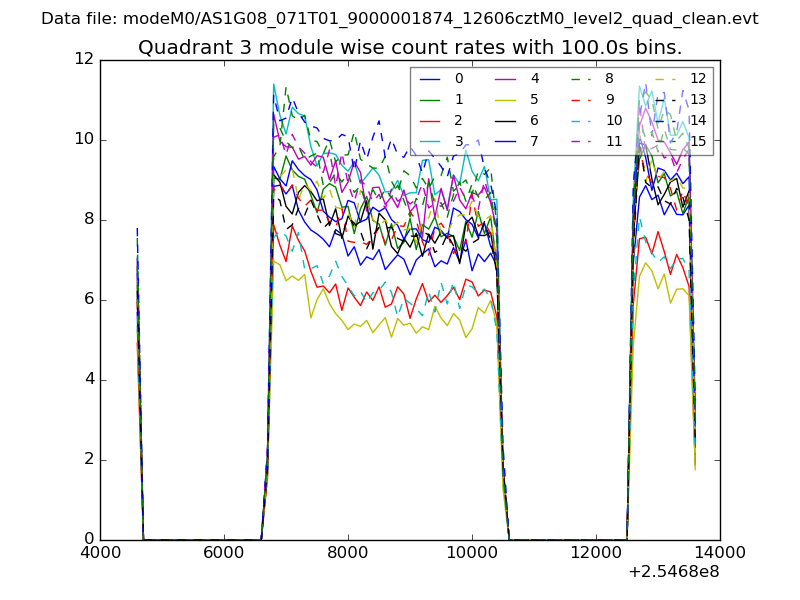
| Module-wise count rates for Quadrant C Data is divided into 100 sec bins |
 |
 |
| Module-wise count rates for Quadrant D Data is divided into 100 sec bins |
 |
 |
| Parameter | Plot |
|---|---|
| CZT HV Monitor | 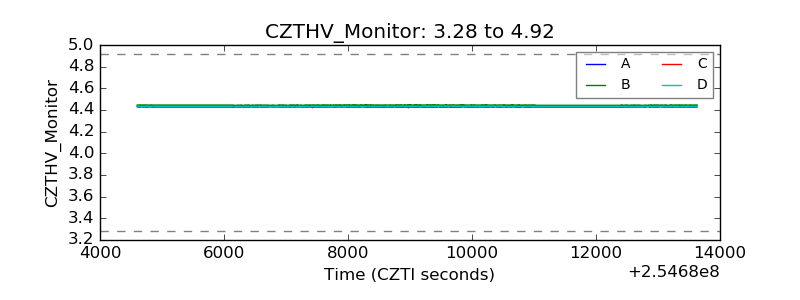 |
| D_VDD | 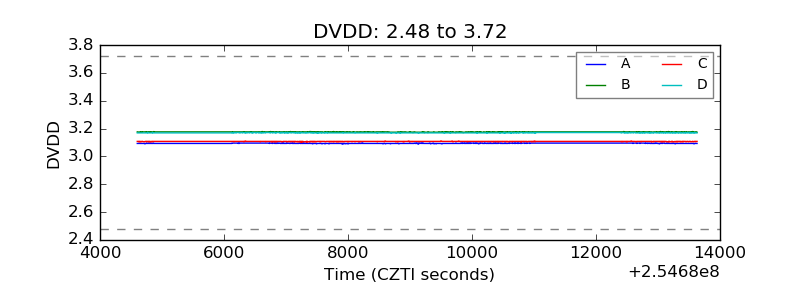 |
| Temperature 1 | 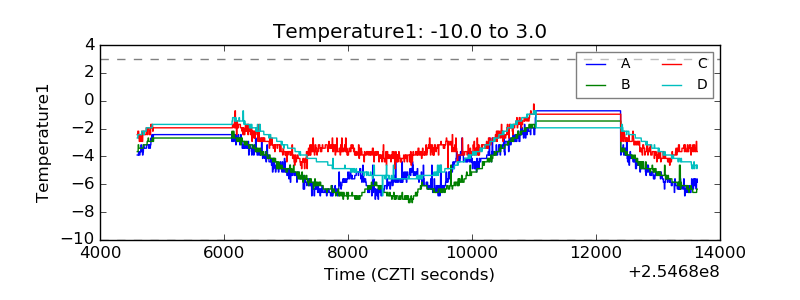 |
| Veto HV Monitor | 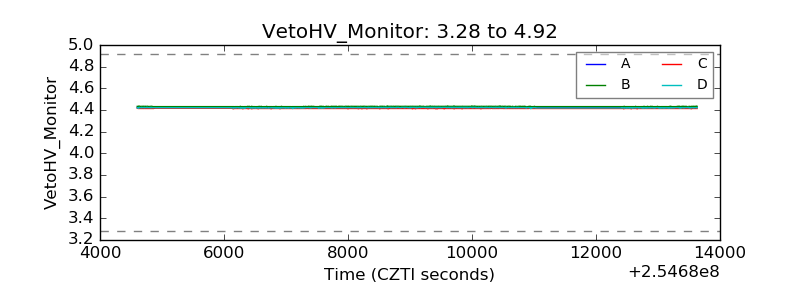 |
| Veto LLD | 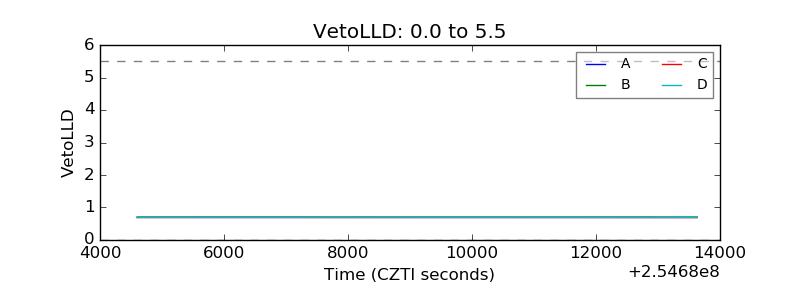 |
| Alpha Counter | 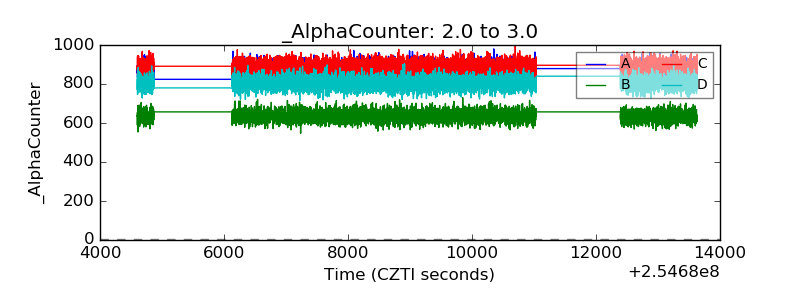 |
| _CPM_Rate | 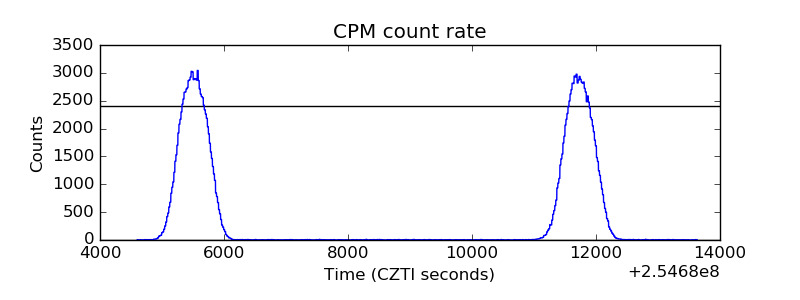 |
| CZT Counter | 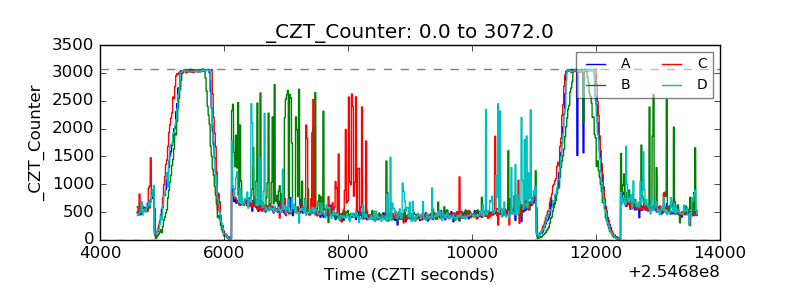 |
| +2.5 Volts monitor |  |
| +5 Volts monitor |  |
| _ROLL_ROT | 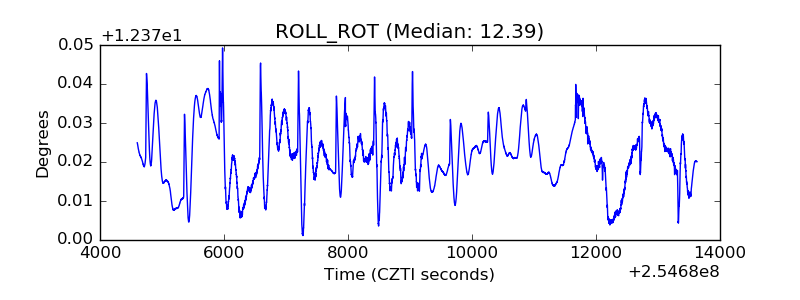 |
| _Roll_DEC | 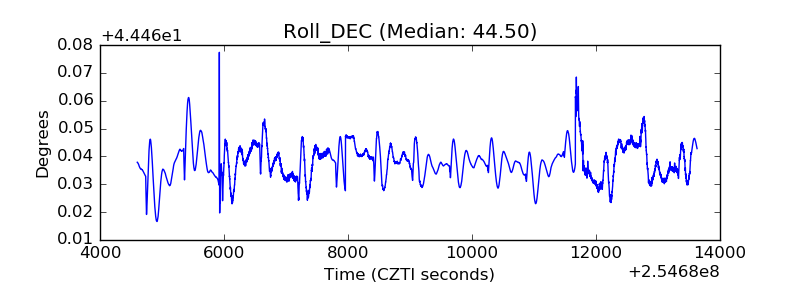 |
| _Roll_RA | 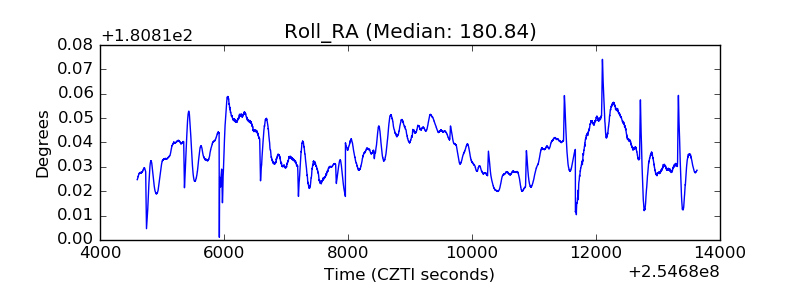 |
| Veto Counter | 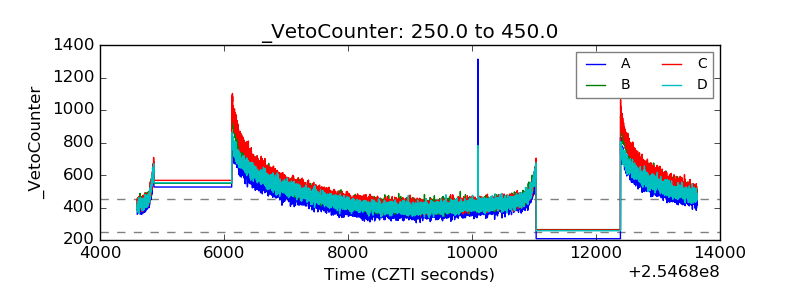 |