| Param | Original file | Final file |
|---|---|---|
| Filename | modeM0/AS1G08_071T01_9000001874_12607cztM0_level2.evt | modeM0/AS1G08_071T01_9000001874_12607cztM0_level2_quad_clean.evt |
| Size (bytes) | 463,910,400 | 104,806,080 |
| Size | 442.4 MB | 100.0 MB |
| Events in quadrant A | 3,002,713 | 687,547 |
| Events in quadrant B | 3,957,893 | 693,468 |
| Events in quadrant C | 3,022,282 | 709,836 |
| Events in quadrant D | 3,654,418 | 659,545 |
| Mode SS | |||
|---|---|---|---|
| Quadrant | BADHDUFLAG | Total packets | Discarded packets |
| A | 0 | 124 | 0 |
| B | 0 | 124 | 0 |
| C | 0 | 124 | 0 |
| D | 0 | 124 | 0 |
| Mode M0 | |||
|---|---|---|---|
| Quadrant | BADHDUFLAG | Total packets | Discarded packets |
| A | 0 | 12943 | 3 |
| B | 0 | 15753 | 2 |
| C | 0 | 12952 | 2 |
| D | 0 | 14986 | 2 |
| Mode M9 | |||
|---|---|---|---|
| Quadrant | BADHDUFLAG | Total packets | Discarded packets |
| A | 0 | 18 | 0 |
| B | 0 | 18 | 0 |
| C | 0 | 18 | 0 |
| D | 0 | 19 | 0 |
| Quadrant | Total seconds | Saturated seconds | Saturation percentage |
|---|---|---|---|
| A | 6065 | 42 | 0.692498% |
| B | 6065 | 364 | 6.001649% |
| C | 6065 | 31 | 0.511129% |
| D | 6065 | 146 | 2.407255% |
Noise dominated data is calculated using 1-second bins in cleaned event files. If a bin has >2000 counts, and if more than 50% of those come from <1% of pixels, then it is considered to be noise-dominated and hence unusable.
| Quadrant | # 1 sec bins | Bins with >0 counts | Bins with >2000 counts | High rate bins dominated by noise | Noise dominated (total time) | Noise dominated (detector-on time) | Marked lightcurve |
|---|---|---|---|---|---|---|---|
| A | 7426 | 6067 | 1 | 1 | 0.01% | 0.02% | 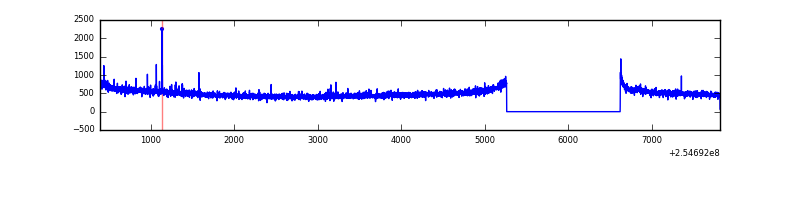 |
| B | 7426 | 6066 | 274 | 274 | 3.69% | 4.52% | 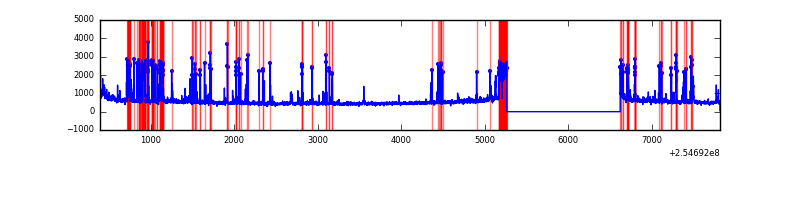 |
| C | 7426 | 6067 | 2 | 2 | 0.03% | 0.03% | 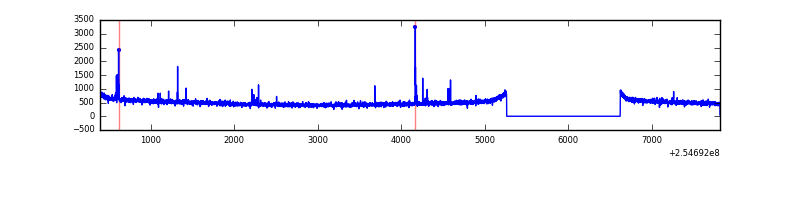 |
| D | 7426 | 6067 | 90 | 90 | 1.21% | 1.48% | 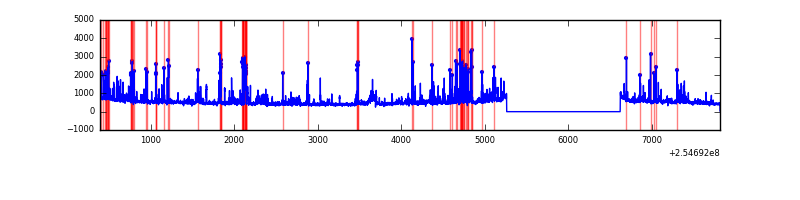 |
Top three noisy pixels from each quadrant. If the there are fewer than three noisy pixels in the level2.evt file, extra rows are filled as -1
| Pixel properties | Quadrant properties | ||||||
|---|---|---|---|---|---|---|---|
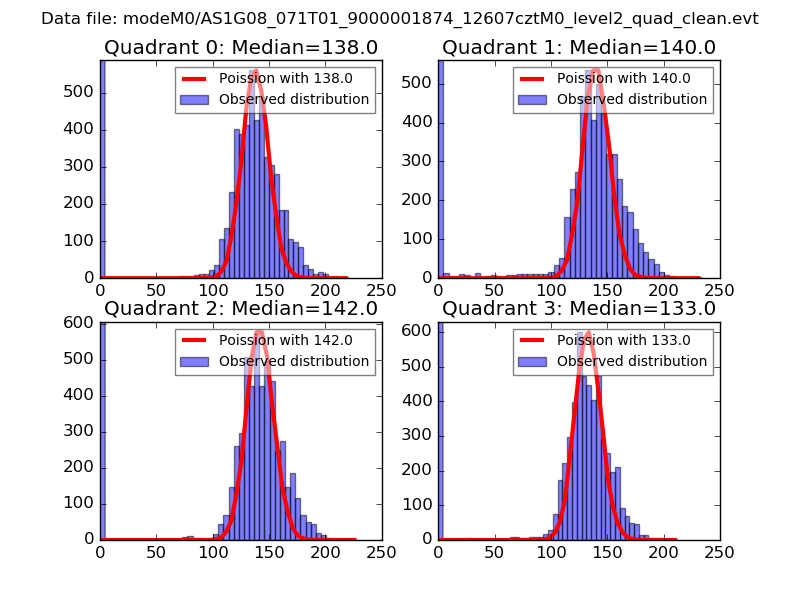
| Quadrant | DetID | PixID | Counts | Sigma | Mean | Median | Sigma |
| A | 3 | 1 | 24770 | 154.61 | 765 | 751 | 155.4 |
| A | 9 | 143 | 20142 | 124.82 | 765 | 751 | 155.4 |
| A | 12 | 189 | 12893 | 78.16 | 765 | 751 | 155.4 |
| B | 4 | 239 | 858159 | 6131.7 | 749 | 731 | 139.8 |
| B | 0 | 85 | 40538 | 284.67 | 749 | 731 | 139.8 |
| B | 3 | 64 | 35461 | 248.36 | 749 | 731 | 139.8 |
| C | 14 | 234 | 34607 | 194.62 | 763 | 768 | 173.9 |
| C | 15 | 208 | 10935 | 58.47 | 763 | 768 | 173.9 |
| C | 13 | 61 | 5644 | 28.04 | 763 | 768 | 173.9 |
| D | 1 | 52 | 582722 | 3284.16 | 741 | 722 | 177.2 |
| D | 10 | 199 | 155981 | 876.11 | 741 | 722 | 177.2 |
| D | 13 | 249 | 28987 | 159.5 | 741 | 722 | 177.2 |
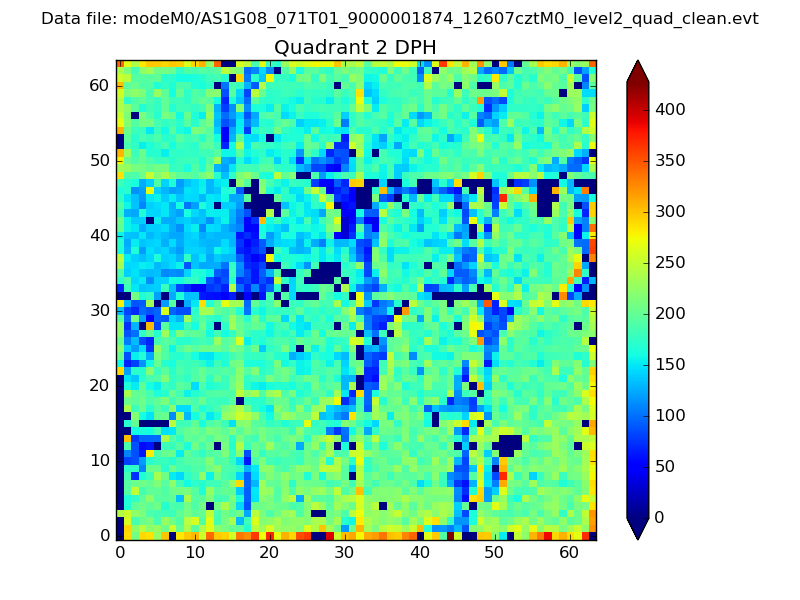
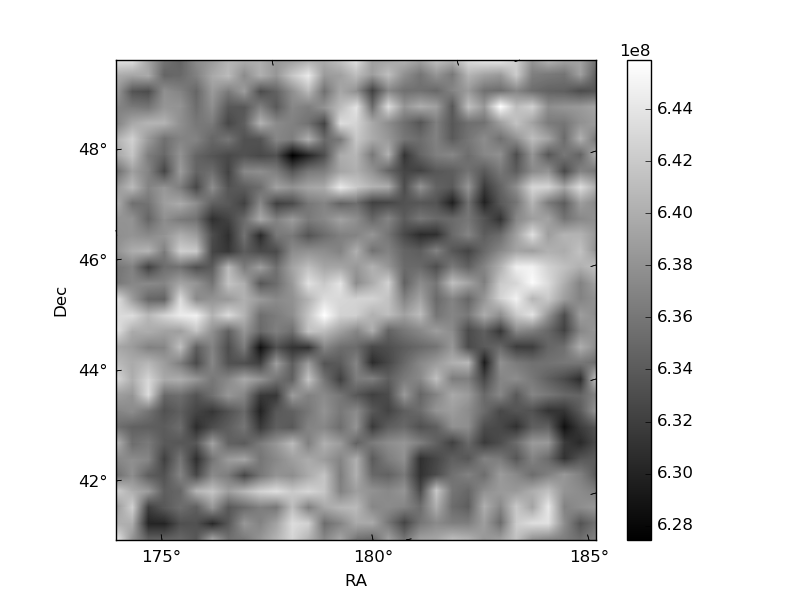
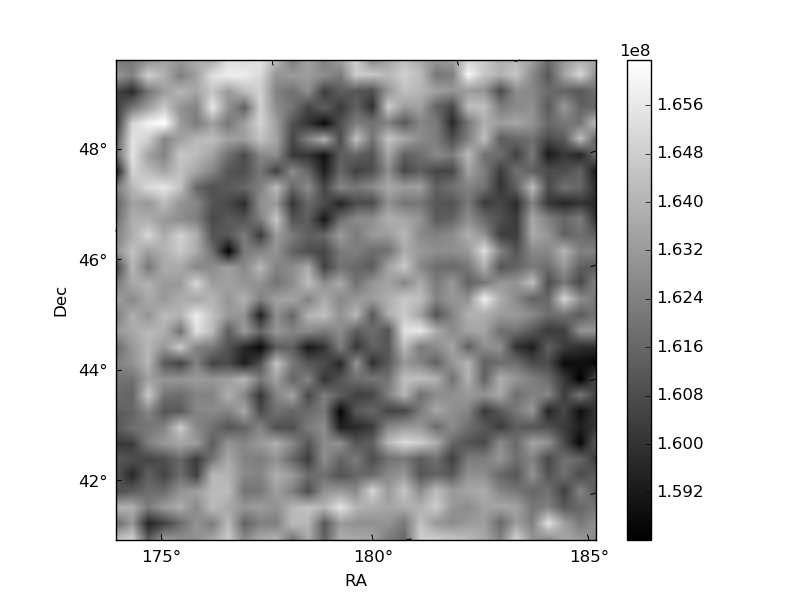
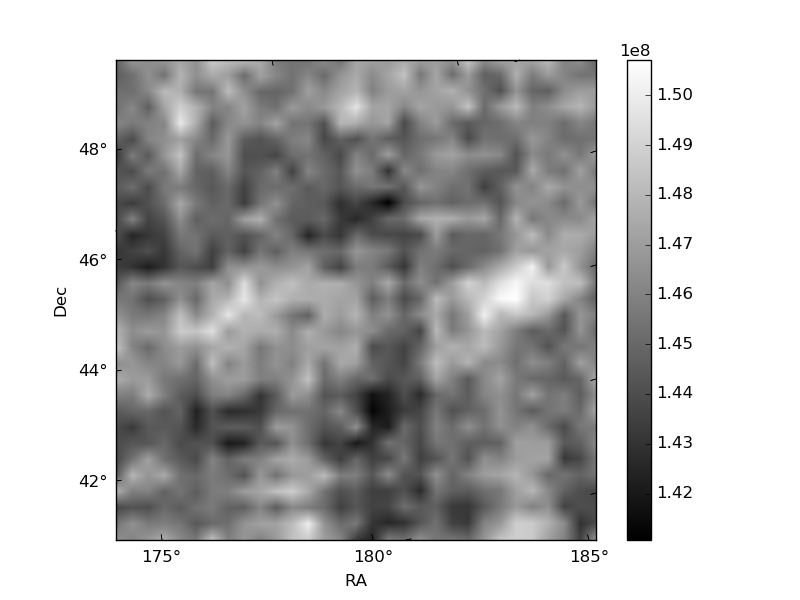
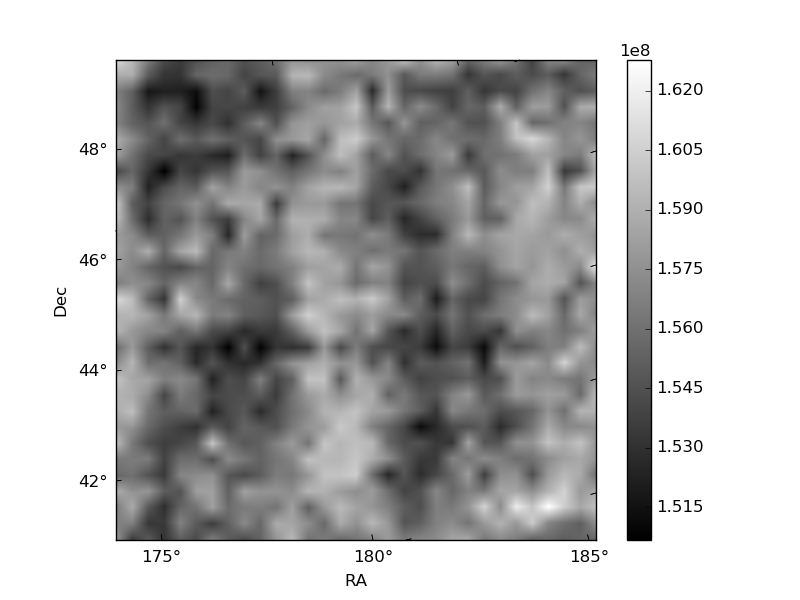
Histogram calculated using DETX and DETY for each event in the final _common_clean file
| Quadrant A | 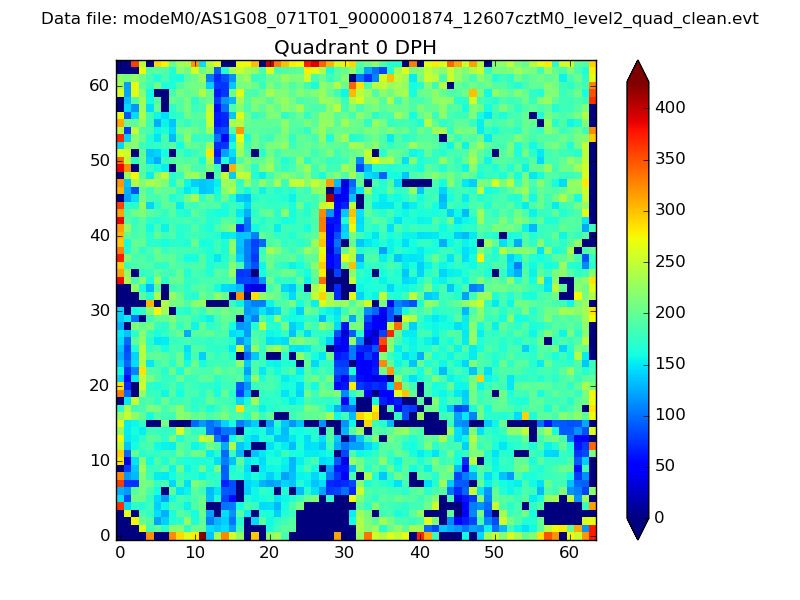 |
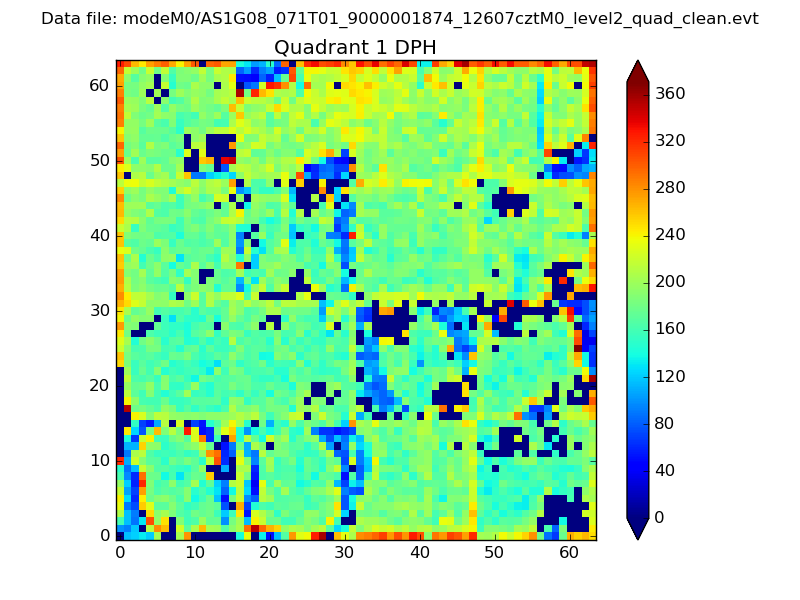 |
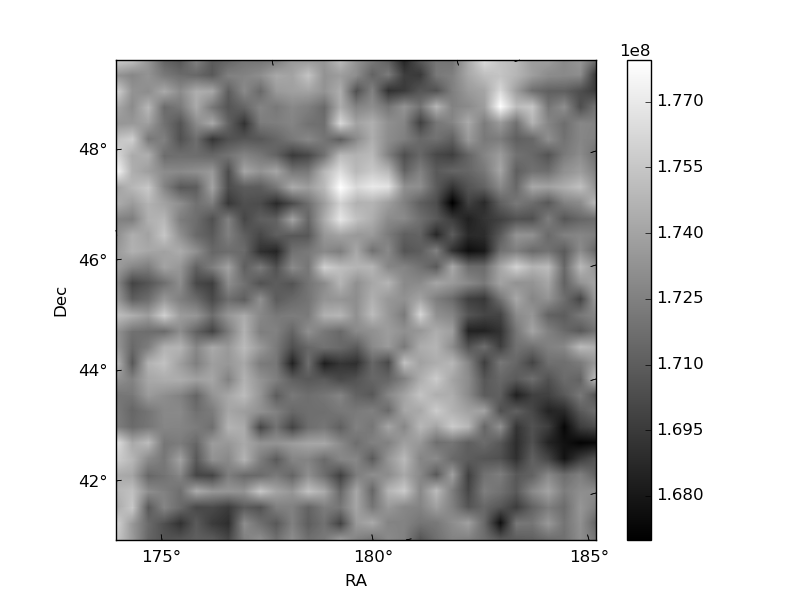
Quadrant B |
|---|---|---|---|
| Quadrant D | 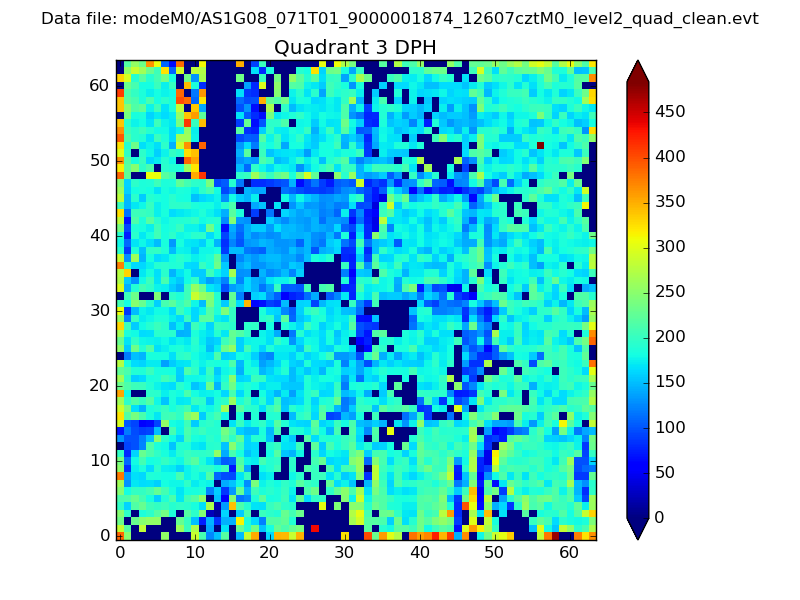 |
 |
Quadrant C |
| Plot type | Count rate plots | Images |
|---|---|---|
| Comparison with Poisson distribution Blue bars denote a histogram of data divided into 1 sec bins. Red curve is a Poisson curve with rate = median count rate of data. |
 |
 |
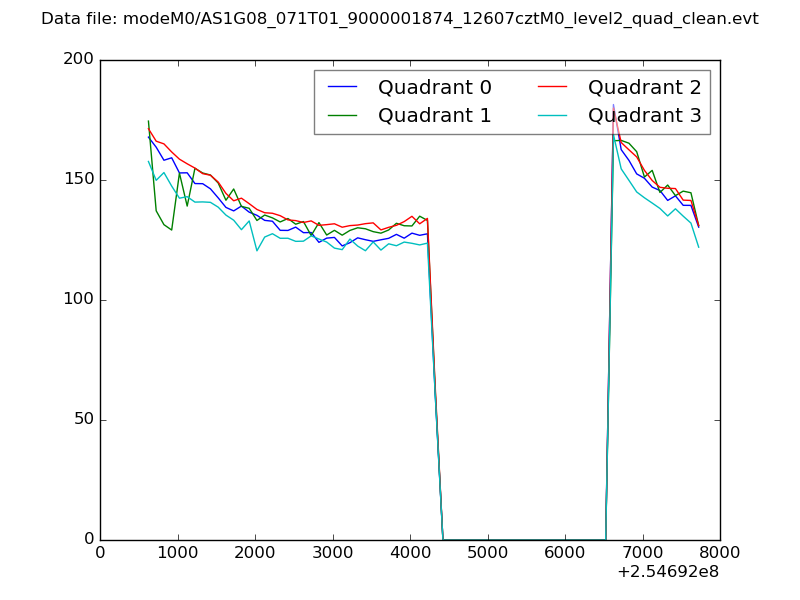
| Quadrant-wise count rates Data is divided into 100 sec bins |
 |
|
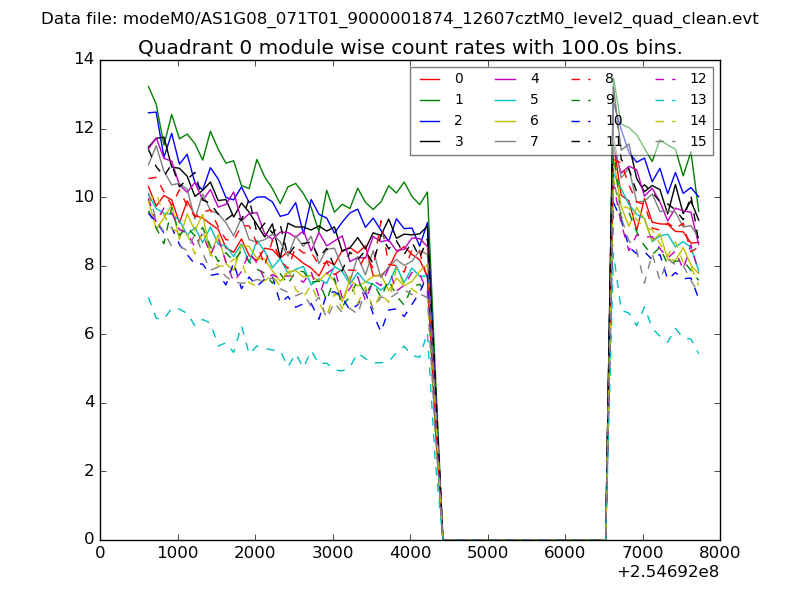
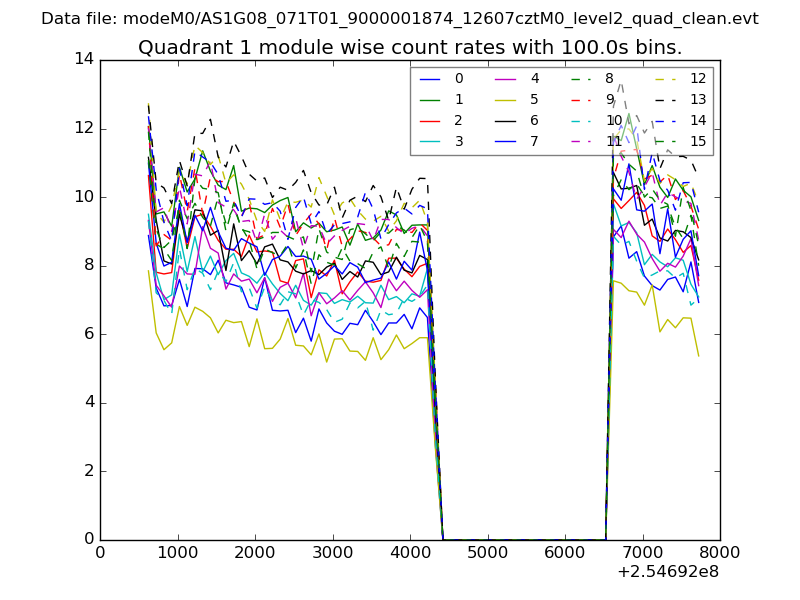
| Module-wise count rates for Quadrant A Data is divided into 100 sec bins |
 |
 |
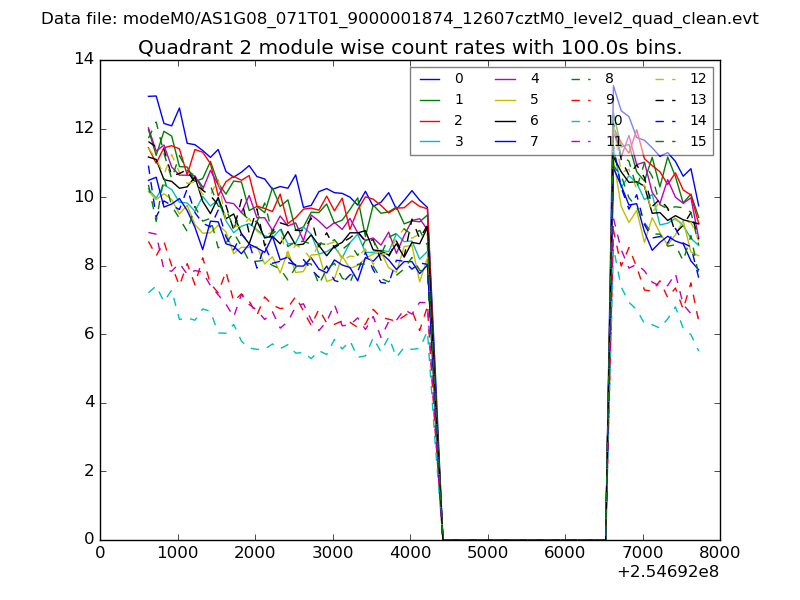
| Module-wise count rates for Quadrant B Data is divided into 100 sec bins |
 |
 |
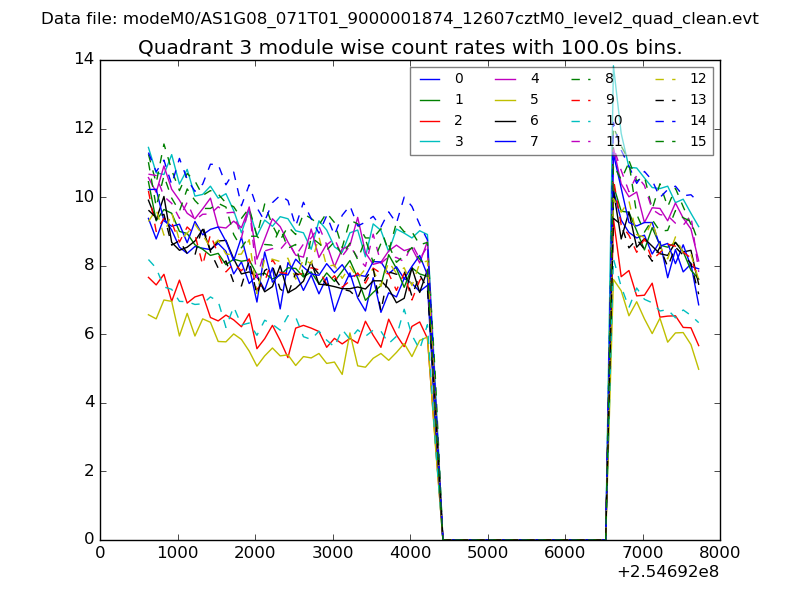
| Module-wise count rates for Quadrant C Data is divided into 100 sec bins |
 |
 |
| Module-wise count rates for Quadrant D Data is divided into 100 sec bins |
 |
 |
| Parameter | Plot |
|---|---|
| CZT HV Monitor | 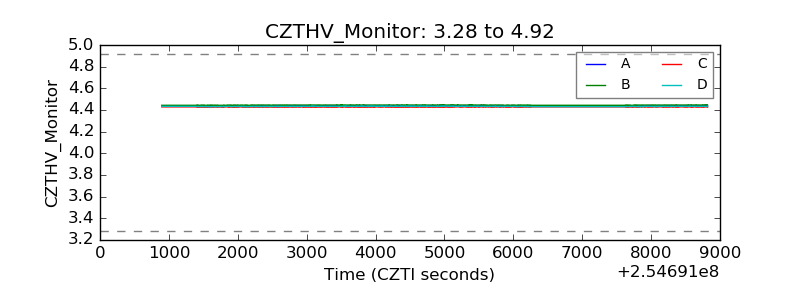 |
| D_VDD | 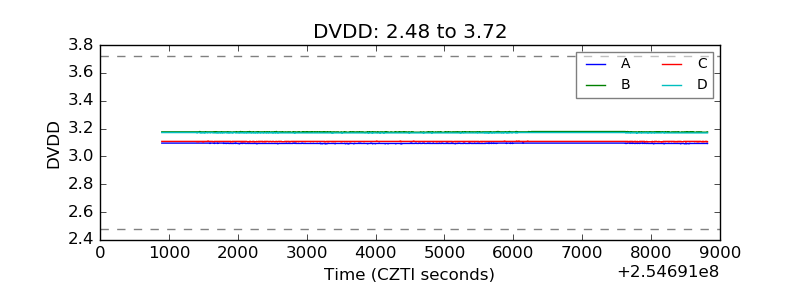 |
| Temperature 1 | 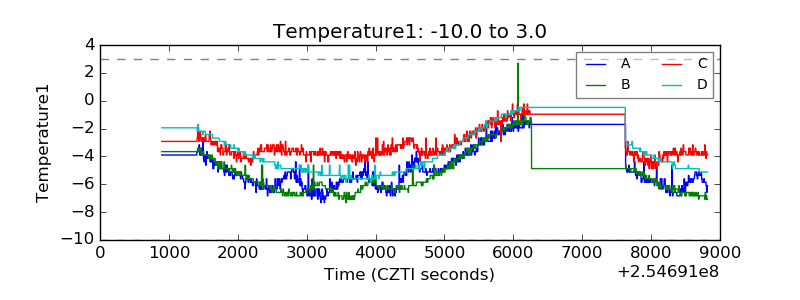 |
| Veto HV Monitor | 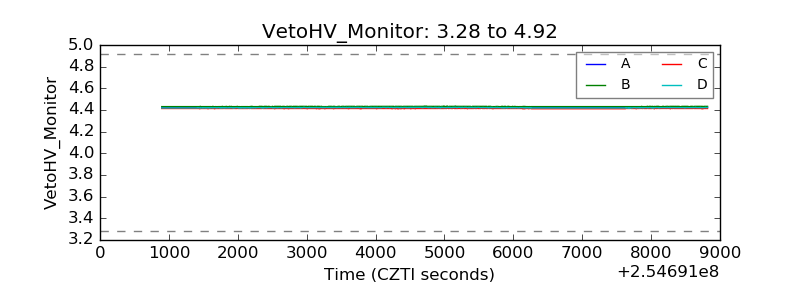 |
| Veto LLD |  |
| Alpha Counter | 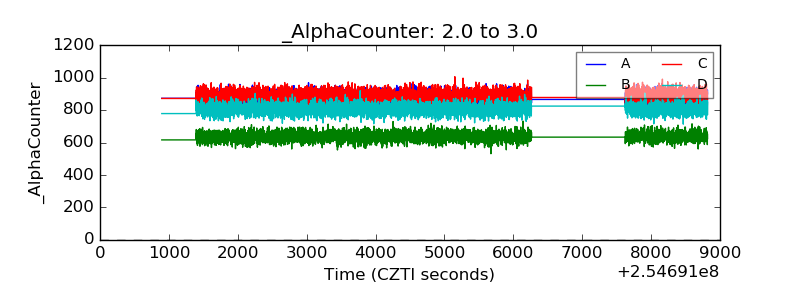 |
| _CPM_Rate | 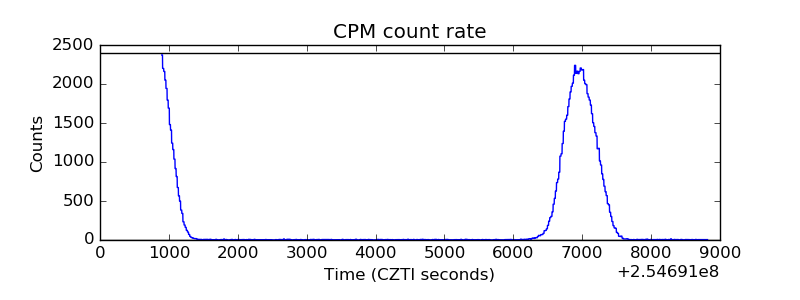 |
| CZT Counter | 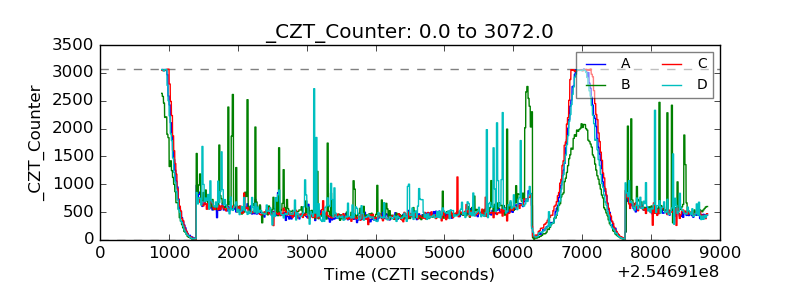 |
| +2.5 Volts monitor |  |
| +5 Volts monitor |  |
| _ROLL_ROT | 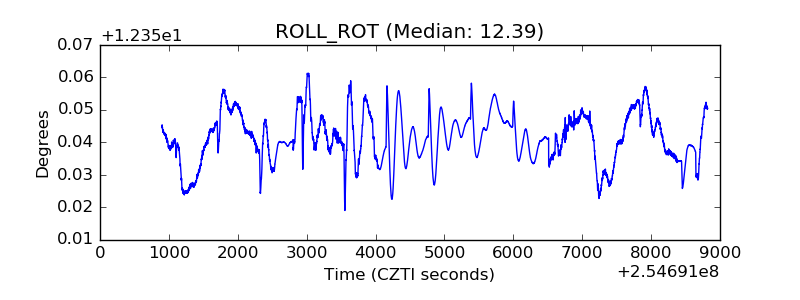 |
| _Roll_DEC | 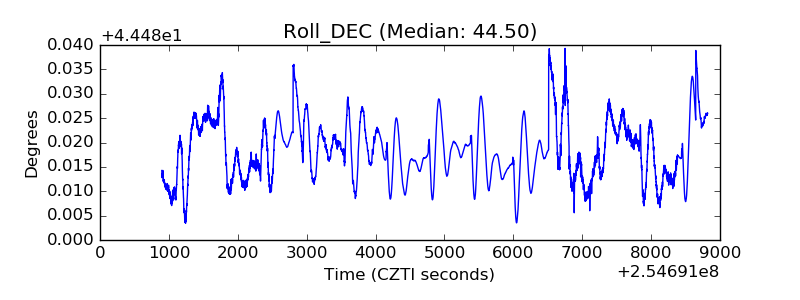 |
| _Roll_RA | 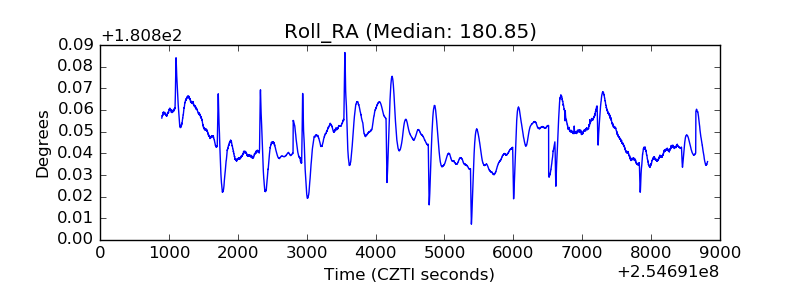 |
| Veto Counter | 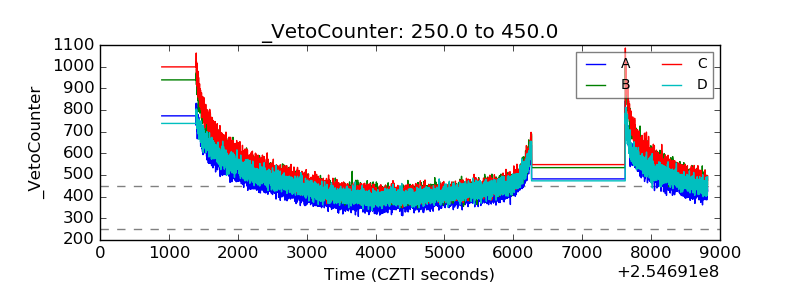 |