| Param | Original file | Final file |
|---|---|---|
| Filename | modeM0/AS1G08_071T01_9000001874_12608cztM0_level2.evt | modeM0/AS1G08_071T01_9000001874_12608cztM0_level2_quad_clean.evt |
| Size (bytes) | 489,643,200 | 101,664,000 |
| Size | 467.0 MB | 97.0 MB |
| Events in quadrant A | 3,236,909 | 652,093 |
| Events in quadrant B | 4,161,467 | 669,472 |
| Events in quadrant C | 3,256,054 | 668,785 |
| Events in quadrant D | 3,724,933 | 626,888 |
| Mode SS | |||
|---|---|---|---|
| Quadrant | BADHDUFLAG | Total packets | Discarded packets |
| A | 0 | 136 | 0 |
| B | 0 | 136 | 0 |
| C | 0 | 136 | 0 |
| D | 0 | 136 | 0 |
| Mode M0 | |||
|---|---|---|---|
| Quadrant | BADHDUFLAG | Total packets | Discarded packets |
| A | 0 | 14080 | 3 |
| B | 0 | 16713 | 2 |
| C | 0 | 14102 | 2 |
| D | 0 | 15778 | 2 |
| Mode M9 | |||
|---|---|---|---|
| Quadrant | BADHDUFLAG | Total packets | Discarded packets |
| A | 0 | 27 | 0 |
| B | 0 | 27 | 0 |
| C | 0 | 27 | 0 |
| D | 0 | 27 | 0 |
| Quadrant | Total seconds | Saturated seconds | Saturation percentage |
|---|---|---|---|
| A | 6622 | 56 | 0.845666% |
| B | 6622 | 362 | 5.466626% |
| C | 6622 | 52 | 0.785261% |
| D | 6622 | 90 | 1.359106% |
Noise dominated data is calculated using 1-second bins in cleaned event files. If a bin has >2000 counts, and if more than 50% of those come from <1% of pixels, then it is considered to be noise-dominated and hence unusable.
| Quadrant | # 1 sec bins | Bins with >0 counts | Bins with >2000 counts | High rate bins dominated by noise | Noise dominated (total time) | Noise dominated (detector-on time) | Marked lightcurve |
|---|---|---|---|---|---|---|---|
| A | 9268 | 6625 | 0 | 0 | 0.00% | 0.00% | 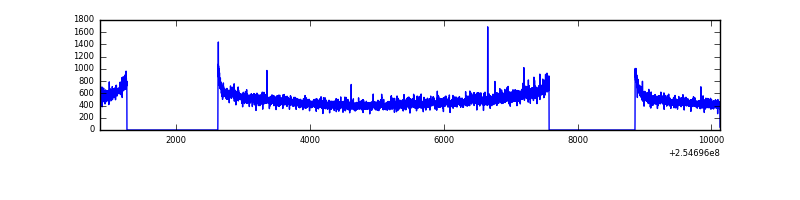 |
| B | 9268 | 6624 | 241 | 241 | 2.60% | 3.64% | 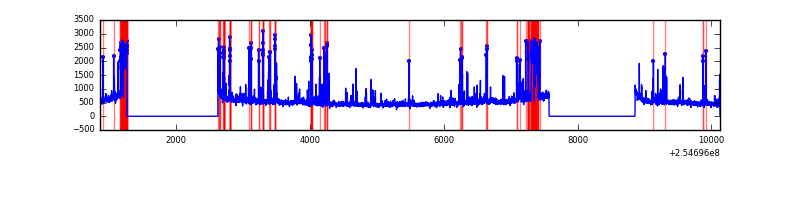 |
| C | 9268 | 6625 | 12 | 12 | 0.13% | 0.18% |  |
| D | 9268 | 6625 | 36 | 36 | 0.39% | 0.54% | 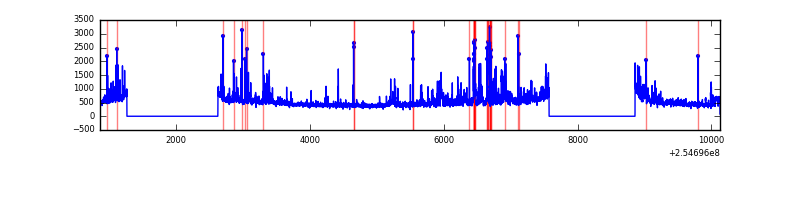 |
Top three noisy pixels from each quadrant. If the there are fewer than three noisy pixels in the level2.evt file, extra rows are filled as -1
| Pixel properties | Quadrant properties | ||||||
|---|---|---|---|---|---|---|---|
| Quadrant | DetID | PixID | Counts | Sigma | Mean | Median | Sigma |
| A | 12 | 189 | 37484 | 219.67 | 820 | 800 | 167.0 |
| A | 3 | 1 | 29100 | 169.47 | 820 | 800 | 167.0 |
| A | 9 | 143 | 16807 | 95.85 | 820 | 800 | 167.0 |
| B | 4 | 239 | 842825 | 5570.32 | 804 | 785 | 151.2 |
| B | 11 | 51 | 52883 | 344.64 | 804 | 785 | 151.2 |
| B | 0 | 214 | 51366 | 334.61 | 804 | 785 | 151.2 |
| C | 15 | 208 | 76691 | 406.3 | 814 | 819 | 186.7 |
| C | 13 | 61 | 5887 | 27.14 | 814 | 819 | 186.7 |
| C | 14 | 234 | 5508 | 25.11 | 814 | 819 | 186.7 |
| D | 1 | 52 | 537164 | 2822.55 | 795 | 774 | 190.0 |
| D | 10 | 157 | 41932 | 216.58 | 795 | 774 | 190.0 |
| D | 2 | 14 | 32757 | 168.3 | 795 | 774 | 190.0 |
Histogram calculated using DETX and DETY for each event in the final _common_clean file
| Quadrant A |  |
 |
Quadrant B |
|---|---|---|---|
| Quadrant D |  |
 |
Quadrant C |
| Plot type | Count rate plots | Images |
|---|---|---|
| Comparison with Poisson distribution Blue bars denote a histogram of data divided into 1 sec bins. Red curve is a Poisson curve with rate = median count rate of data. |
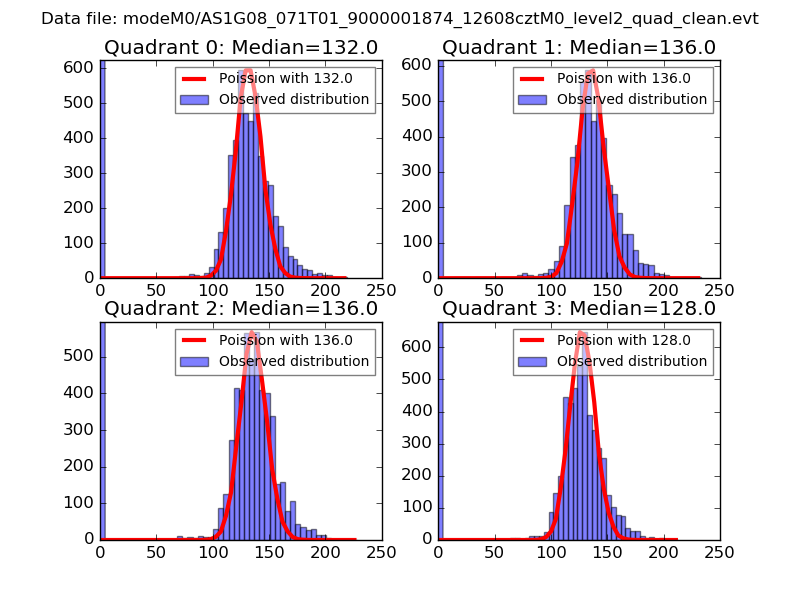 |
 |
| Quadrant-wise count rates Data is divided into 100 sec bins |
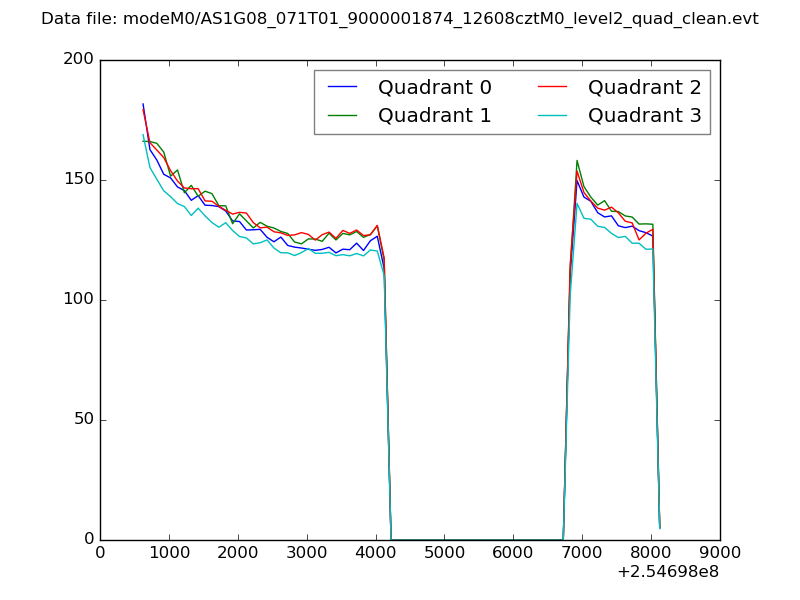 |
|
| Module-wise count rates for Quadrant A Data is divided into 100 sec bins |
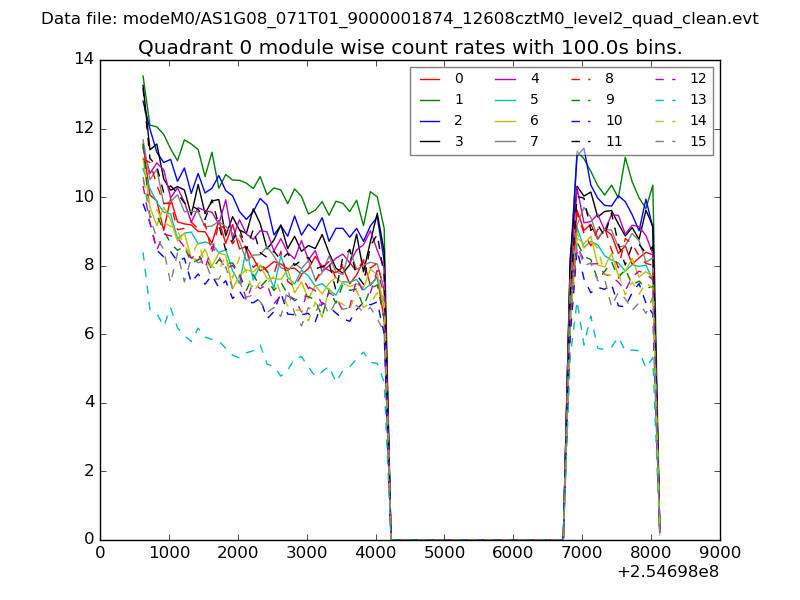 |
 |
| Module-wise count rates for Quadrant B Data is divided into 100 sec bins |
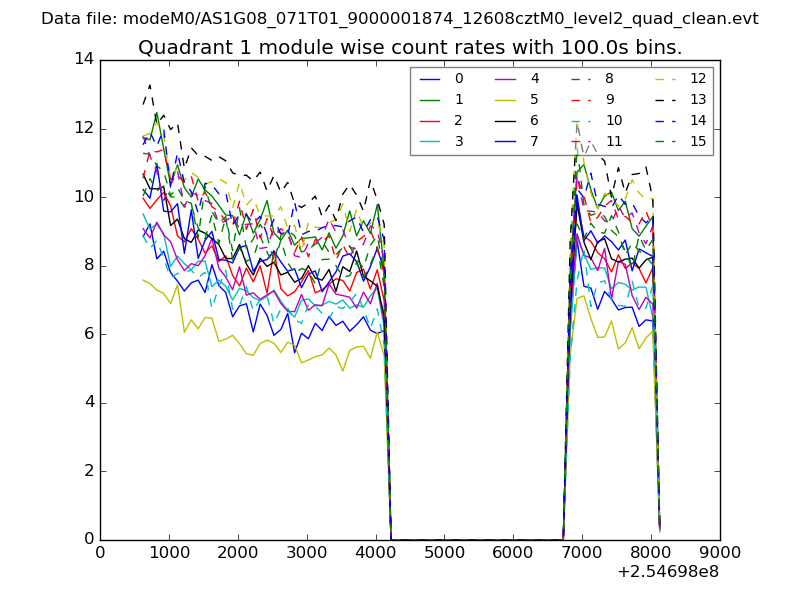 |
 |
| Module-wise count rates for Quadrant C Data is divided into 100 sec bins |
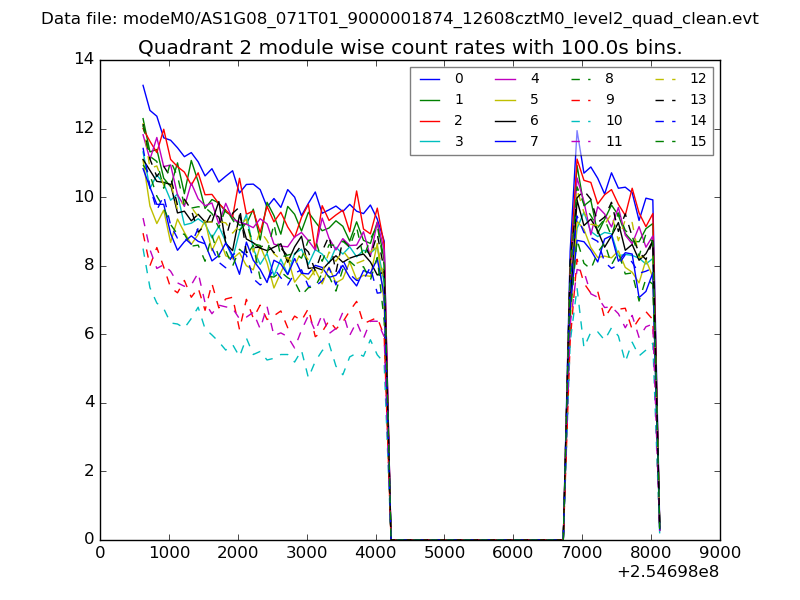 |
 |
| Module-wise count rates for Quadrant D Data is divided into 100 sec bins |
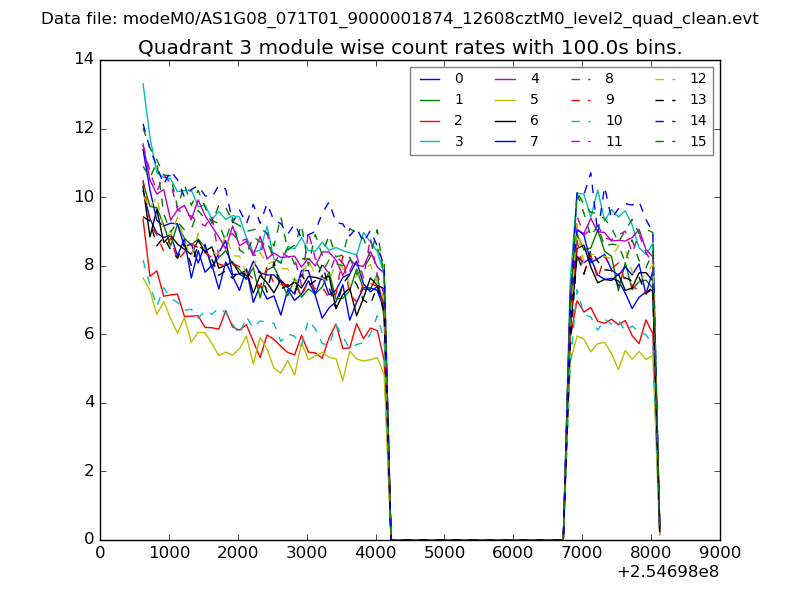 |
 |
| Parameter | Plot |
|---|---|
| CZT HV Monitor | 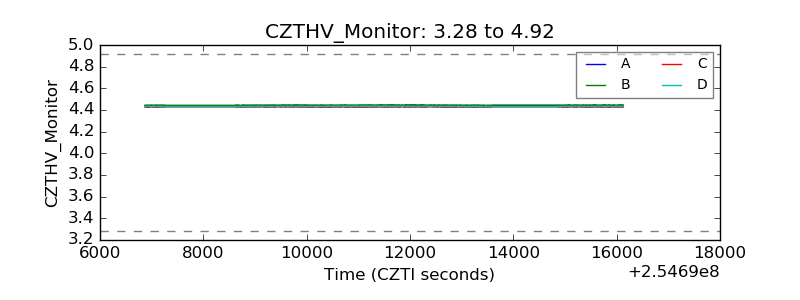 |
| D_VDD |  |
| Temperature 1 |  |
| Veto HV Monitor |  |
| Veto LLD |  |
| Alpha Counter | 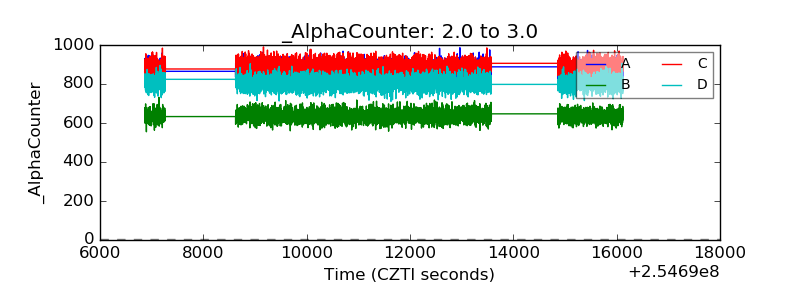 |
| _CPM_Rate | 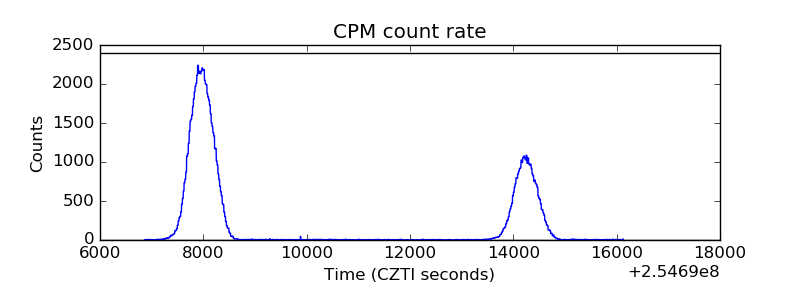 |
| CZT Counter |  |
| +2.5 Volts monitor |  |
| +5 Volts monitor |  |
| _ROLL_ROT |  |
| _Roll_DEC |  |
| _Roll_RA |  |
| Veto Counter | 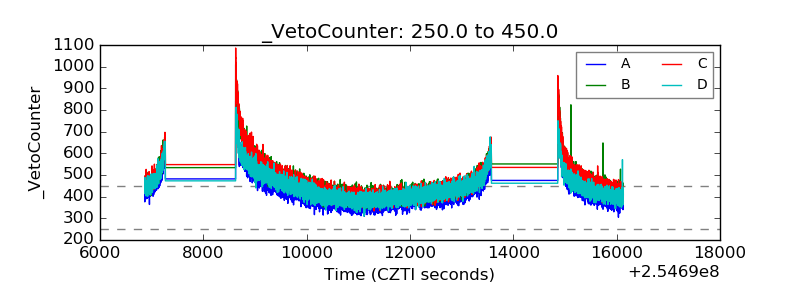 |