| Param | Original file | Final file |
|---|---|---|
| Filename | modeM0/AS1G08_071T01_9000001874_12609cztM0_level2.evt | modeM0/AS1G08_071T01_9000001874_12609cztM0_level2_quad_clean.evt |
| Size (bytes) | 468,276,480 | 88,257,600 |
| Size | 446.6 MB | 84.2 MB |
| Events in quadrant A | 2,984,128 | 557,051 |
| Events in quadrant B | 3,718,703 | 571,755 |
| Events in quadrant C | 3,209,371 | 565,167 |
| Events in quadrant D | 3,833,001 | 530,511 |
| Mode SS | |||
|---|---|---|---|
| Quadrant | BADHDUFLAG | Total packets | Discarded packets |
| A | 0 | 130 | 0 |
| B | 0 | 130 | 0 |
| C | 0 | 130 | 0 |
| D | 0 | 130 | 0 |
| Mode M0 | |||
|---|---|---|---|
| Quadrant | BADHDUFLAG | Total packets | Discarded packets |
| A | 0 | 13338 | 3 |
| B | 0 | 15534 | 2 |
| C | 0 | 14013 | 2 |
| D | 0 | 15993 | 2 |
| Mode M9 | |||
|---|---|---|---|
| Quadrant | BADHDUFLAG | Total packets | Discarded packets |
| A | 0 | 18 | 0 |
| B | 0 | 18 | 0 |
| C | 0 | 18 | 0 |
| D | 0 | 19 | 0 |
| Quadrant | Total seconds | Saturated seconds | Saturation percentage |
|---|---|---|---|
| A | 6427 | 20 | 0.311187% |
| B | 6427 | 183 | 2.847363% |
| C | 6427 | 77 | 1.198071% |
| D | 6427 | 110 | 1.711529% |
Noise dominated data is calculated using 1-second bins in cleaned event files. If a bin has >2000 counts, and if more than 50% of those come from <1% of pixels, then it is considered to be noise-dominated and hence unusable.
| Quadrant | # 1 sec bins | Bins with >0 counts | Bins with >2000 counts | High rate bins dominated by noise | Noise dominated (total time) | Noise dominated (detector-on time) | Marked lightcurve |
|---|---|---|---|---|---|---|---|
| A | 7473 | 6429 | 0 | 0 | 0.00% | 0.00% | 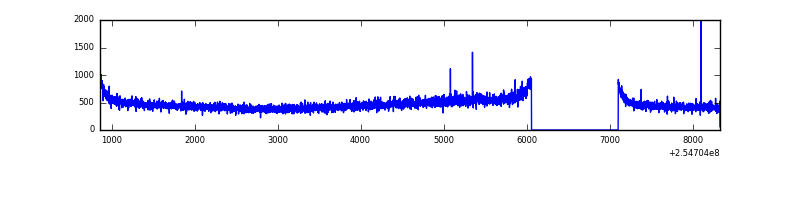 |
| B | 7473 | 6429 | 73 | 73 | 0.98% | 1.14% | 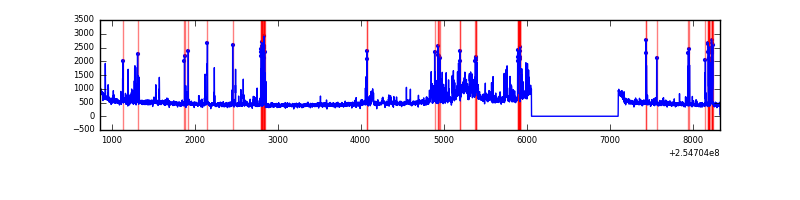 |
| C | 7473 | 6429 | 67 | 67 | 0.90% | 1.04% | 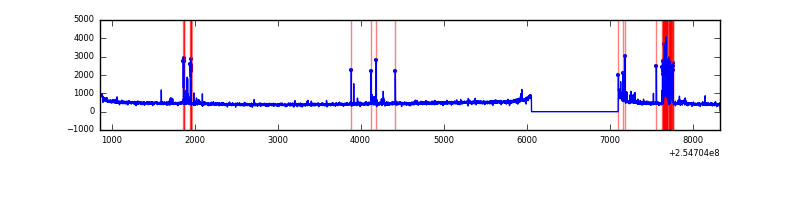 |
| D | 7473 | 6429 | 60 | 60 | 0.80% | 0.93% | 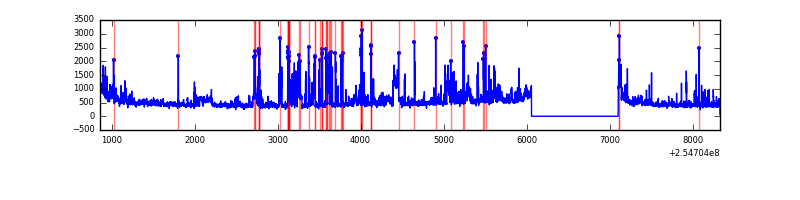 |
Top three noisy pixels from each quadrant. If the there are fewer than three noisy pixels in the level2.evt file, extra rows are filled as -1
| Pixel properties | Quadrant properties | ||||||
|---|---|---|---|---|---|---|---|
| Quadrant | DetID | PixID | Counts | Sigma | Mean | Median | Sigma |
| A | 3 | 1 | 35370 | 224.04 | 760 | 743 | 154.6 |
| A | 12 | 189 | 25662 | 161.23 | 760 | 743 | 154.6 |
| A | 0 | 226 | 6644 | 38.18 | 760 | 743 | 154.6 |
| B | 4 | 239 | 457449 | 3129.94 | 765 | 747 | 145.9 |
| B | 0 | 85 | 218782 | 1494.27 | 765 | 747 | 145.9 |
| B | 0 | 214 | 30602 | 204.61 | 765 | 747 | 145.9 |
| C | 15 | 208 | 268970 | 1558.28 | 746 | 750 | 172.1 |
| C | 14 | 234 | 32496 | 184.43 | 746 | 750 | 172.1 |
| C | 13 | 61 | 5417 | 27.11 | 746 | 750 | 172.1 |
| D | 1 | 52 | 690474 | 3941.07 | 730 | 710 | 175.0 |
| D | 10 | 157 | 266631 | 1519.38 | 730 | 710 | 175.0 |
| D | 10 | 199 | 39518 | 221.74 | 730 | 710 | 175.0 |
Histogram calculated using DETX and DETY for each event in the final _common_clean file
| Quadrant A | 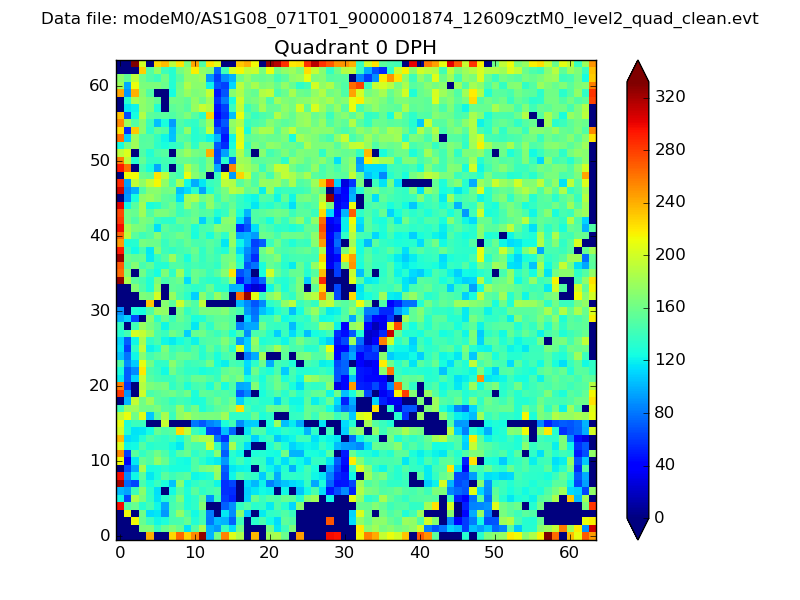 |
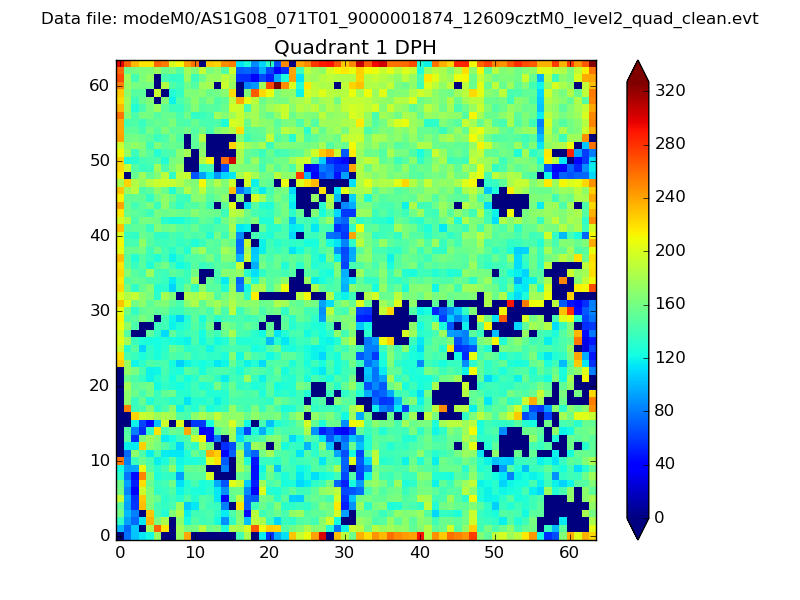 |
Quadrant B |
|---|---|---|---|
| Quadrant D |  |
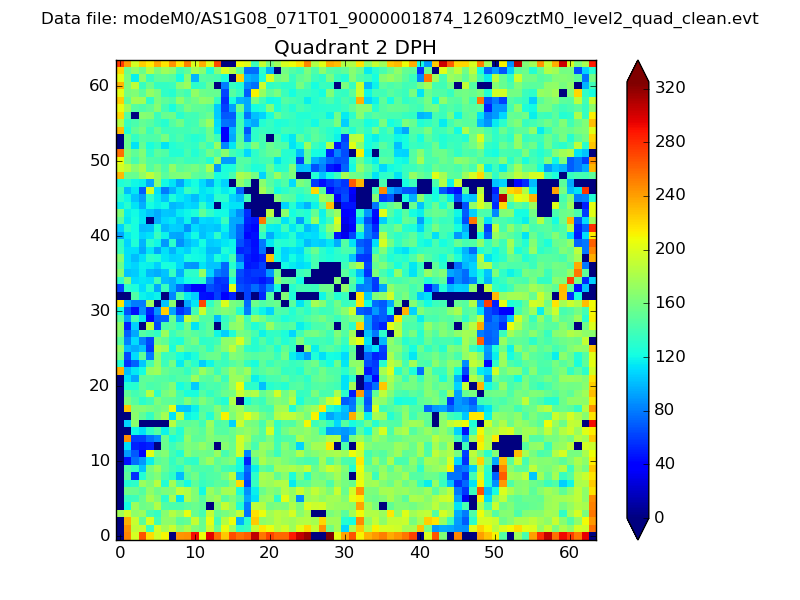 |
Quadrant C |
| Plot type | Count rate plots | Images |
|---|---|---|
| Comparison with Poisson distribution Blue bars denote a histogram of data divided into 1 sec bins. Red curve is a Poisson curve with rate = median count rate of data. |
 |
 |
| Quadrant-wise count rates Data is divided into 100 sec bins |
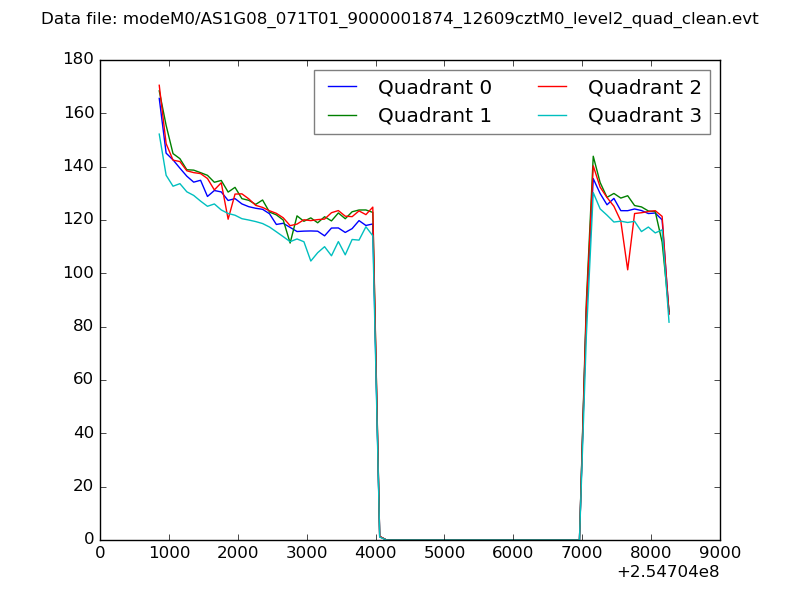 |
|
| Module-wise count rates for Quadrant A Data is divided into 100 sec bins |
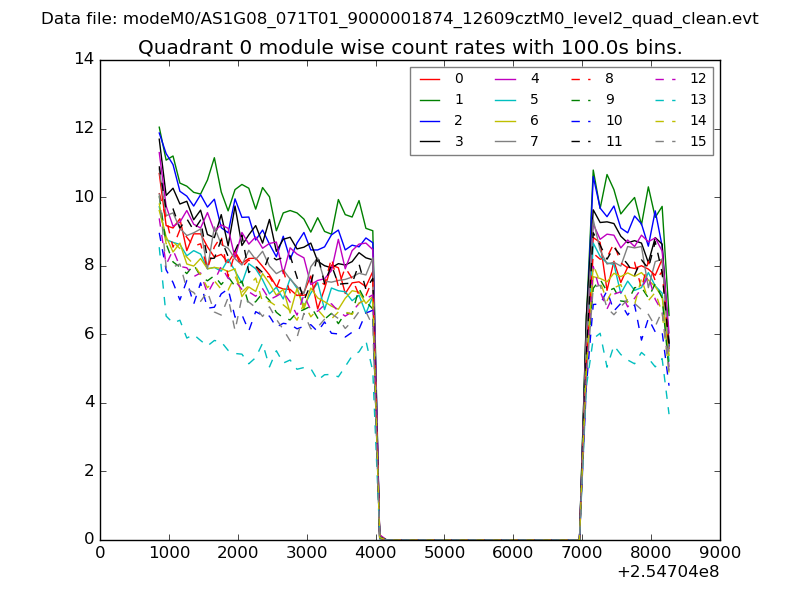 |
 |
| Module-wise count rates for Quadrant B Data is divided into 100 sec bins |
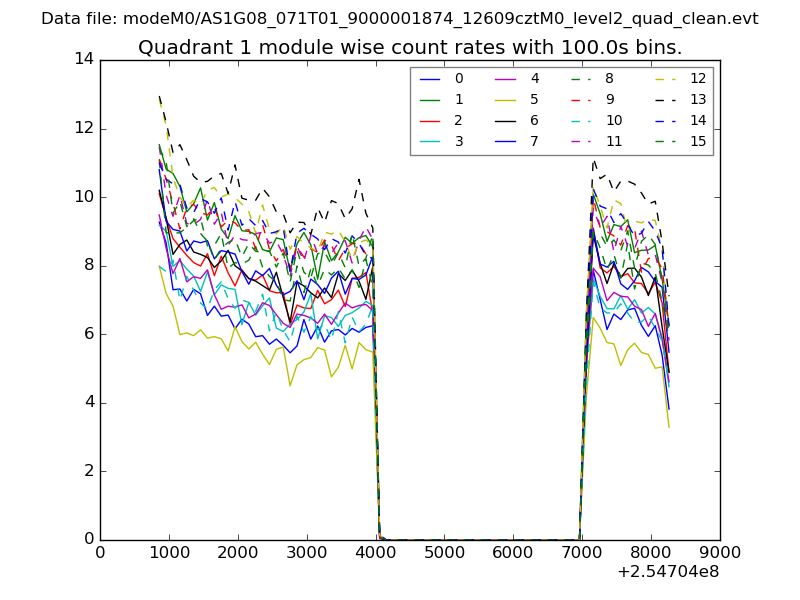 |
 |
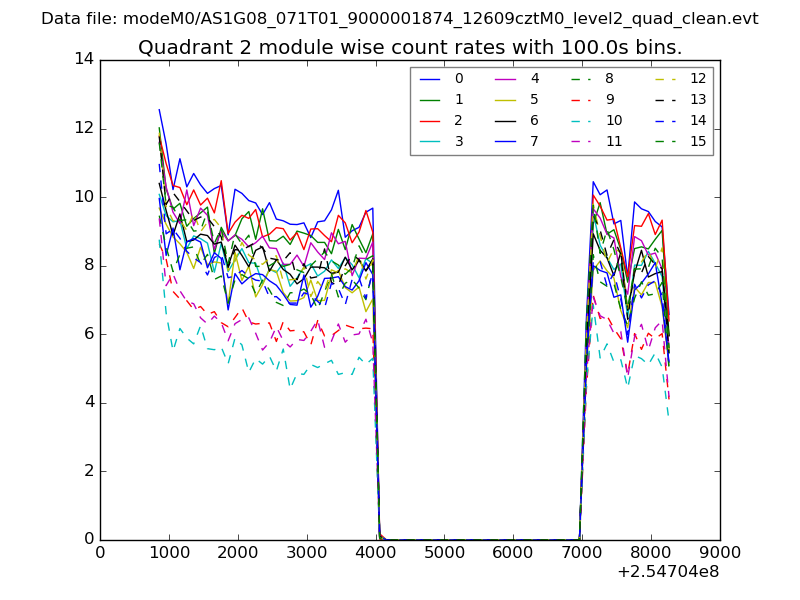
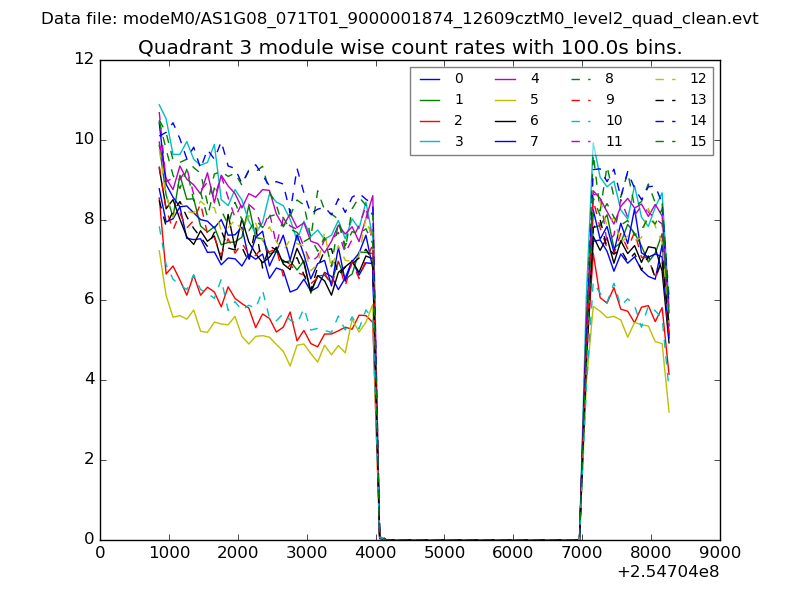
| Module-wise count rates for Quadrant C Data is divided into 100 sec bins |
 |
 |
| Module-wise count rates for Quadrant D Data is divided into 100 sec bins |
 |
 |
| Parameter | Plot |
|---|---|
| CZT HV Monitor |  |
| D_VDD | 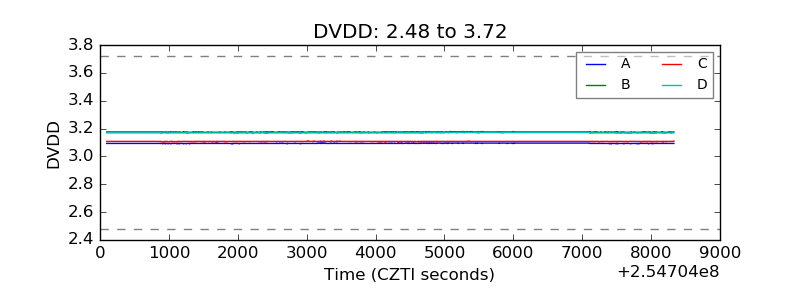 |
| Temperature 1 | 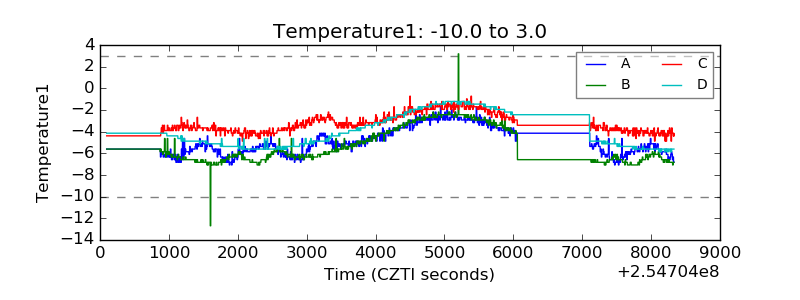 |
| Veto HV Monitor | 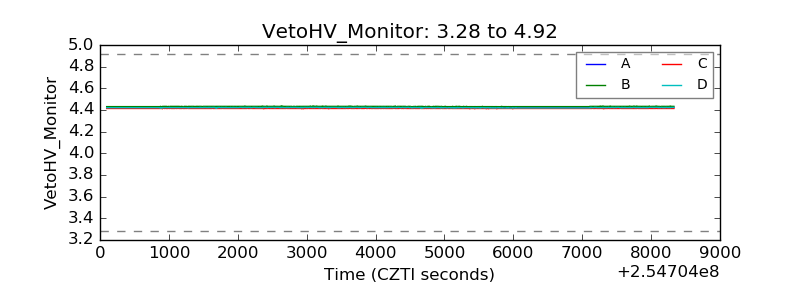 |
| Veto LLD | 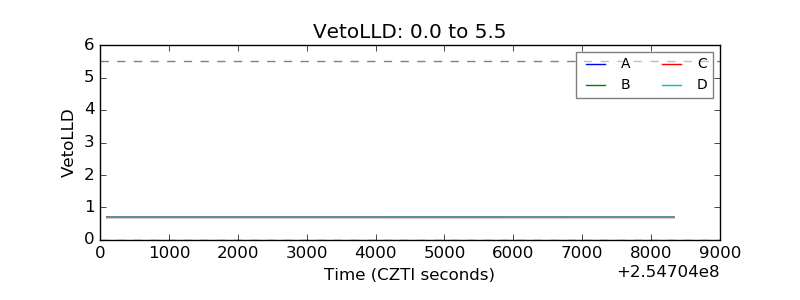 |
| Alpha Counter | 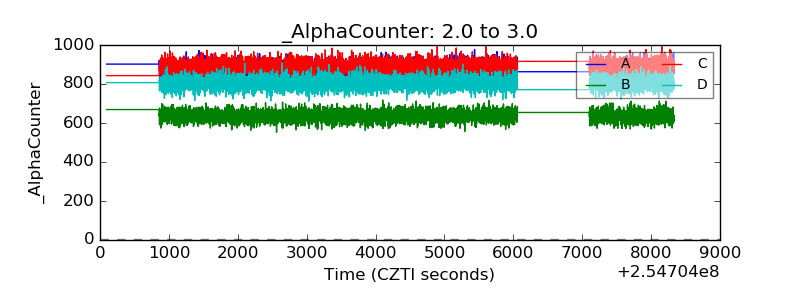 |
| _CPM_Rate | 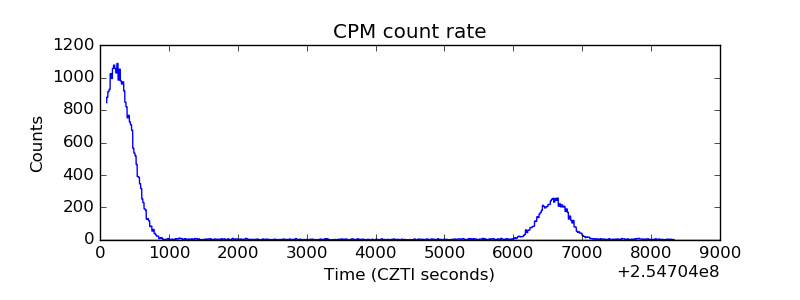 |
| CZT Counter | 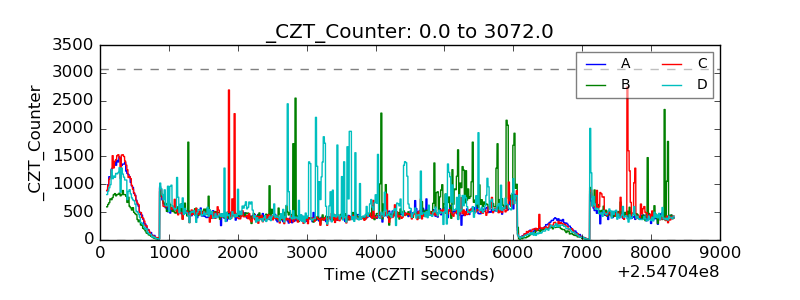 |
| +2.5 Volts monitor |  |
| +5 Volts monitor | 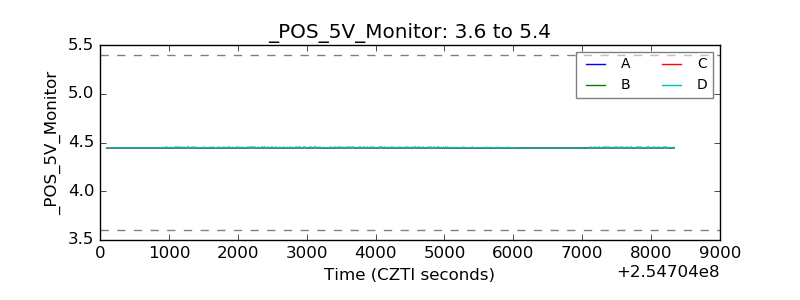 |
| _ROLL_ROT | 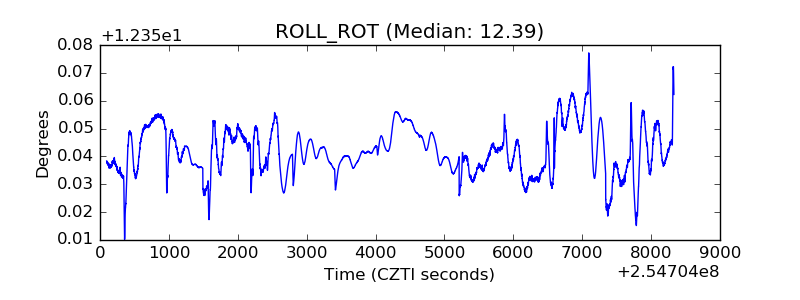 |
| _Roll_DEC | 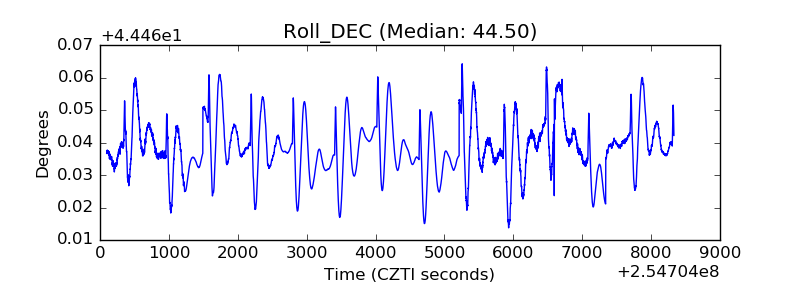 |
| _Roll_RA | 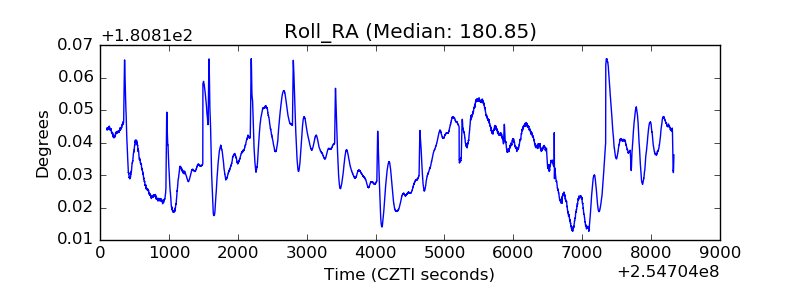 |
| Veto Counter | 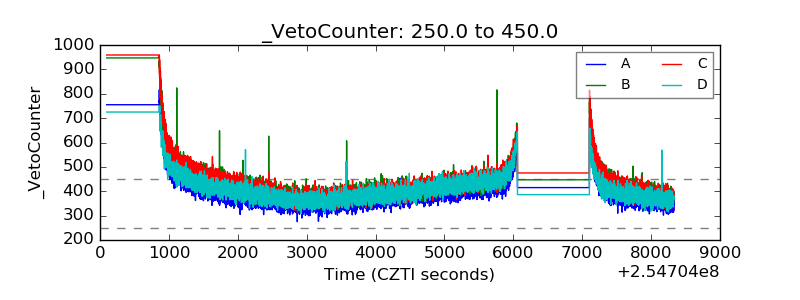 |