| Param | Original file | Final file |
|---|---|---|
| Filename | modeM0/AS1G08_071T01_9000001874_12612cztM0_level2.evt | modeM0/AS1G08_071T01_9000001874_12612cztM0_level2_quad_clean.evt |
| Size (bytes) | 1,378,967,040 | 255,453,120 |
| Size | 1.3 GB | 243.6 MB |
| Events in quadrant A | 9,354,578 | 1,595,942 |
| Events in quadrant B | 10,318,406 | 1,634,487 |
| Events in quadrant C | 9,563,521 | 1,623,837 |
| Events in quadrant D | 11,200,214 | 1,532,002 |
| Mode SS | |||
|---|---|---|---|
| Quadrant | BADHDUFLAG | Total packets | Discarded packets |
| A | 0 | 398 | 0 |
| B | 0 | 398 | 0 |
| C | 0 | 398 | 0 |
| D | 0 | 398 | 0 |
| Mode M0 | |||
|---|---|---|---|
| Quadrant | BADHDUFLAG | Total packets | Discarded packets |
| A | 0 | 41391 | 6 |
| B | 0 | 43712 | 5 |
| C | 0 | 42310 | 5 |
| D | 0 | 47036 | 5 |
| Mode M9 | |||
|---|---|---|---|
| Quadrant | BADHDUFLAG | Total packets | Discarded packets |
| A | 0 | 11 | 0 |
| B | 0 | 11 | 0 |
| C | 0 | 11 | 0 |
| D | 0 | 12 | 0 |
| Quadrant | Total seconds | Saturated seconds | Saturation percentage |
|---|---|---|---|
| A | 19602 | 479 | 2.443628% |
| B | 19602 | 623 | 3.178247% |
| C | 19602 | 369 | 1.882461% |
| D | 19602 | 641 | 3.270074% |
Noise dominated data is calculated using 1-second bins in cleaned event files. If a bin has >2000 counts, and if more than 50% of those come from <1% of pixels, then it is considered to be noise-dominated and hence unusable.
| Quadrant | # 1 sec bins | Bins with >0 counts | Bins with >2000 counts | High rate bins dominated by noise | Noise dominated (total time) | Noise dominated (detector-on time) | Marked lightcurve |
|---|---|---|---|---|---|---|---|
| A | 20388 | 19606 | 49 | 49 | 0.24% | 0.25% | 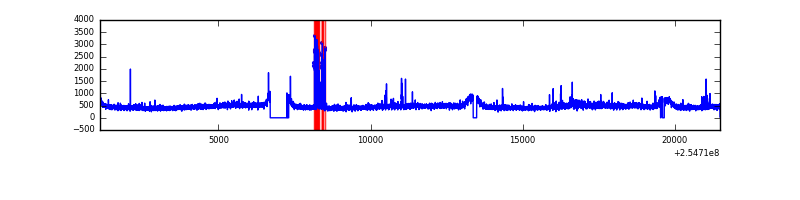 |
| B | 20388 | 19605 | 111 | 111 | 0.54% | 0.57% | 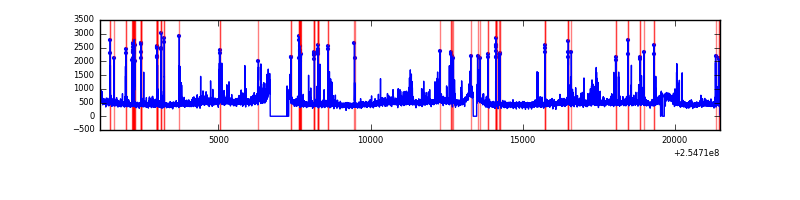 |
| C | 20388 | 19608 | 115 | 115 | 0.56% | 0.59% |  |
| D | 20388 | 19603 | 250 | 250 | 1.23% | 1.28% | 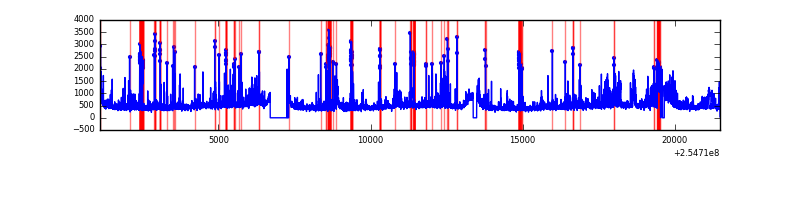 |
Top three noisy pixels from each quadrant. If the there are fewer than three noisy pixels in the level2.evt file, extra rows are filled as -1
| Pixel properties | Quadrant properties | ||||||
|---|---|---|---|---|---|---|---|
| Quadrant | DetID | PixID | Counts | Sigma | Mean | Median | Sigma |
| A | 9 | 143 | 274596 | 578.38 | 2306 | 2250 | 470.9 |
| A | 3 | 1 | 112851 | 234.88 | 2306 | 2250 | 470.9 |
| A | 12 | 189 | 79980 | 165.07 | 2306 | 2250 | 470.9 |
| B | 4 | 239 | 685411 | 1549.42 | 2310 | 2250 | 440.9 |
| B | 0 | 85 | 148223 | 331.07 | 2310 | 2250 | 440.9 |
| B | 3 | 209 | 100446 | 222.71 | 2310 | 2250 | 440.9 |
| C | 15 | 208 | 748935 | 1436.99 | 2250 | 2257 | 519.6 |
| C | 14 | 234 | 24539 | 42.88 | 2250 | 2257 | 519.6 |
| C | 13 | 61 | 16607 | 27.62 | 2250 | 2257 | 519.6 |
| D | 1 | 52 | 1171359 | 2175.27 | 2218 | 2148 | 537.5 |
| D | 1 | 255 | 506726 | 938.75 | 2218 | 2148 | 537.5 |
| D | 10 | 157 | 427889 | 792.08 | 2218 | 2148 | 537.5 |
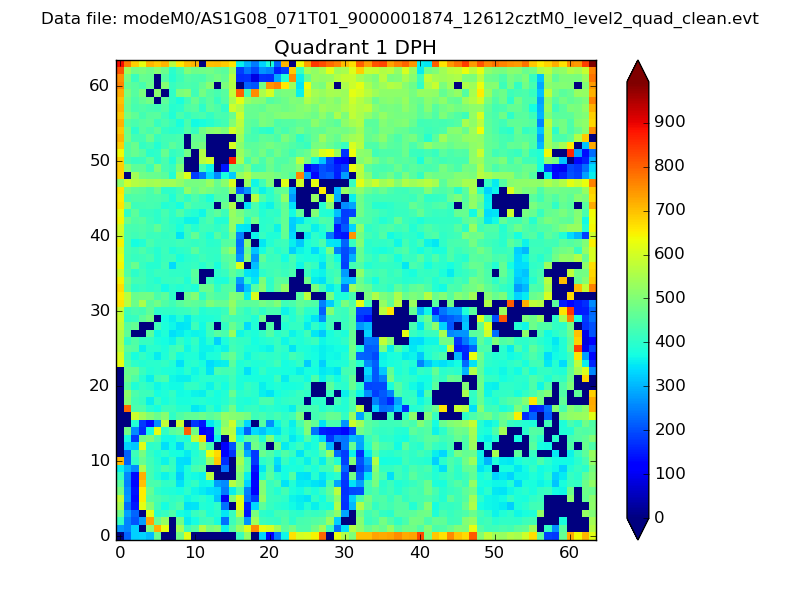
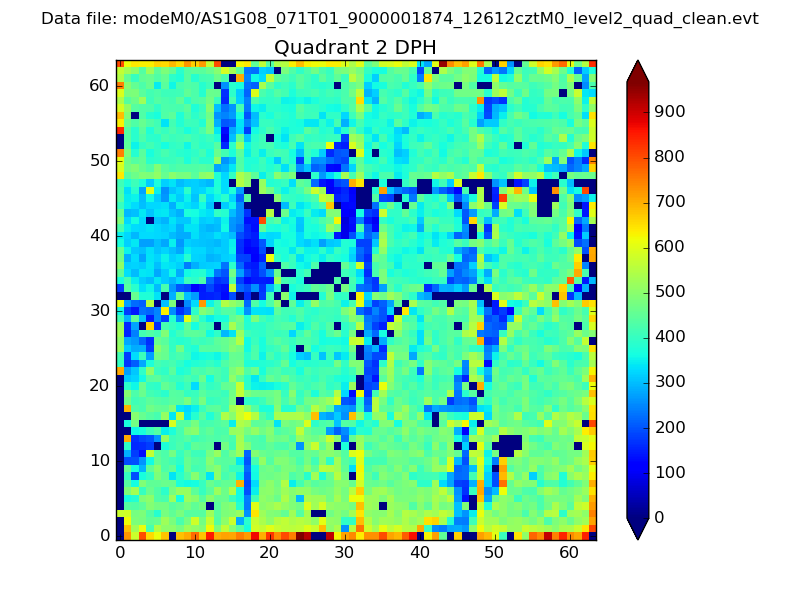
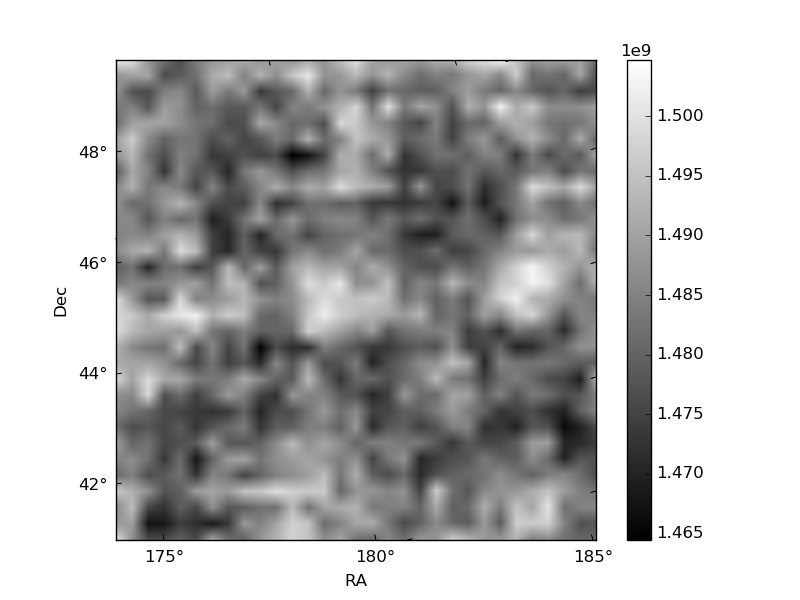
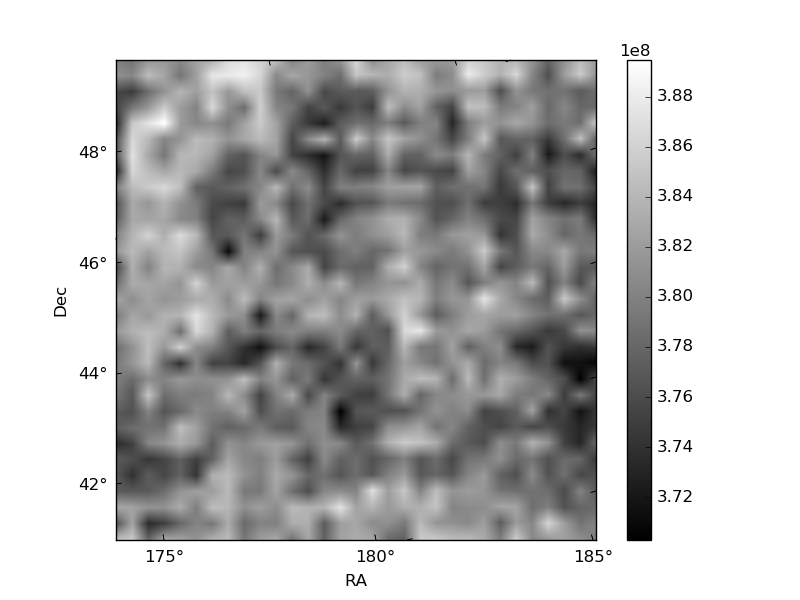
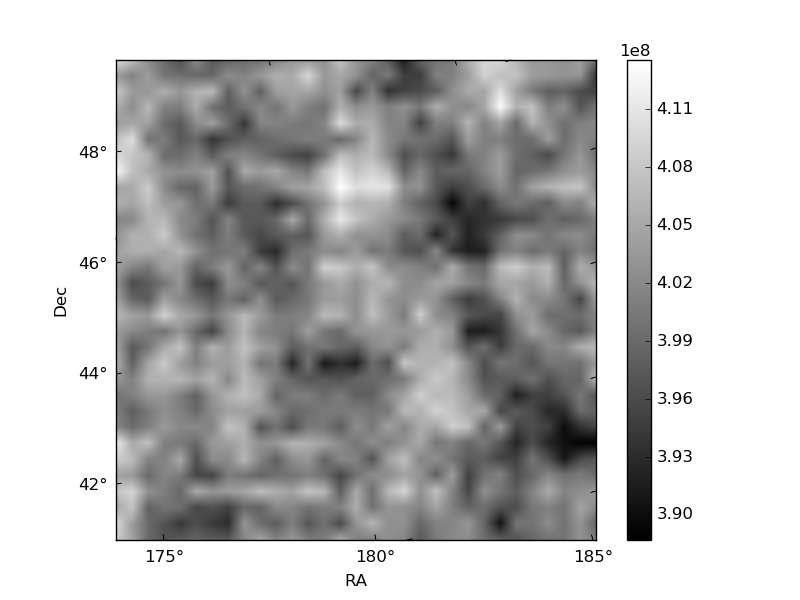
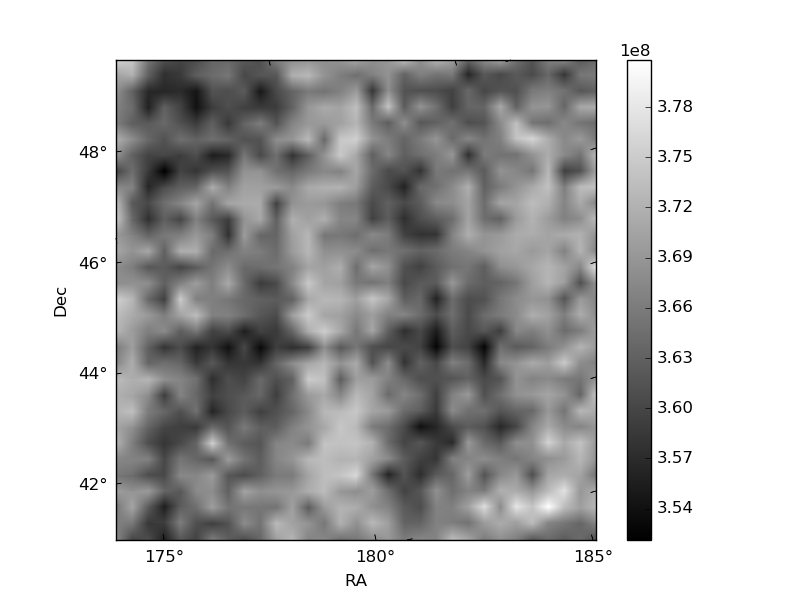
Histogram calculated using DETX and DETY for each event in the final _common_clean file
| Quadrant A | 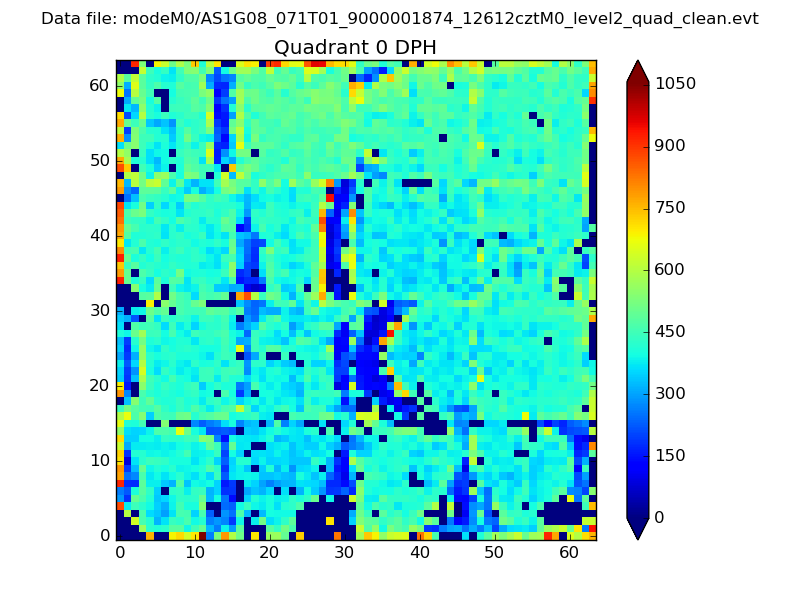 |
 |
Quadrant B |
|---|---|---|---|
| Quadrant D | 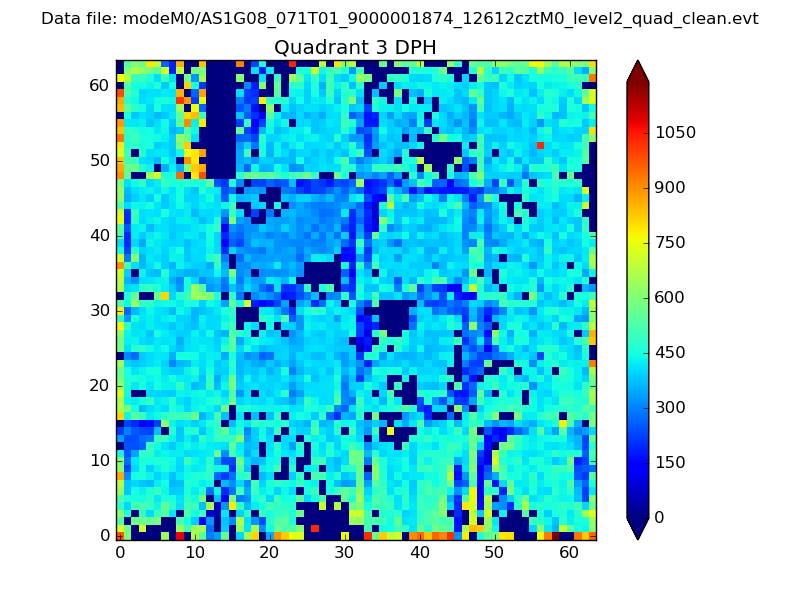 |
 |
Quadrant C |
| Plot type | Count rate plots | Images |
|---|---|---|
| Comparison with Poisson distribution Blue bars denote a histogram of data divided into 1 sec bins. Red curve is a Poisson curve with rate = median count rate of data. |
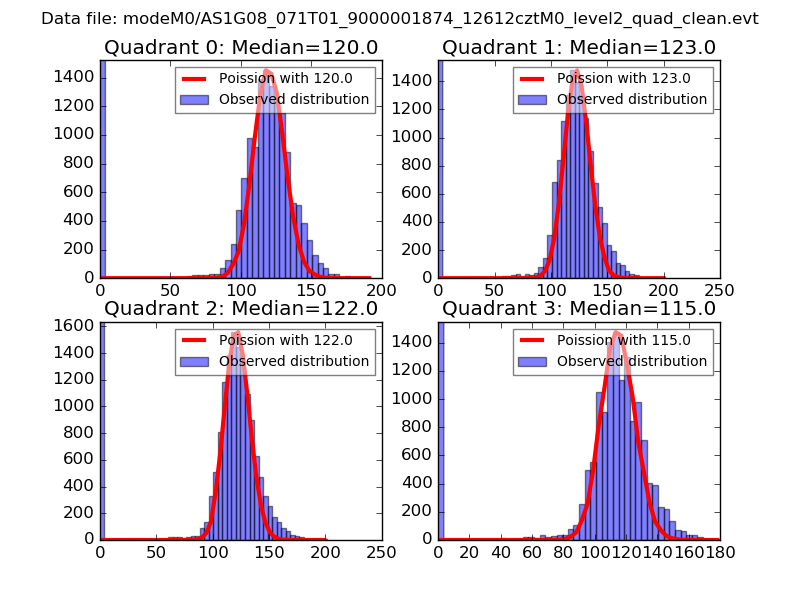 |
 |
| Quadrant-wise count rates Data is divided into 100 sec bins |
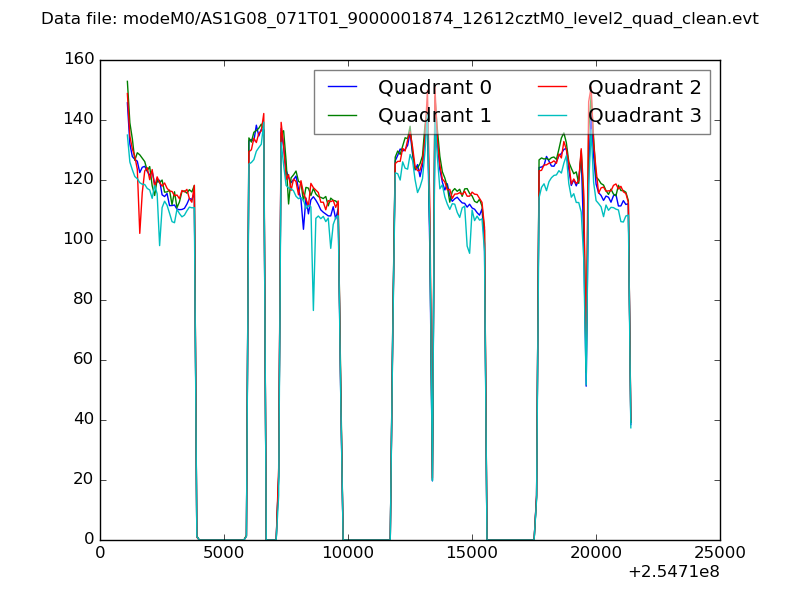 |
|
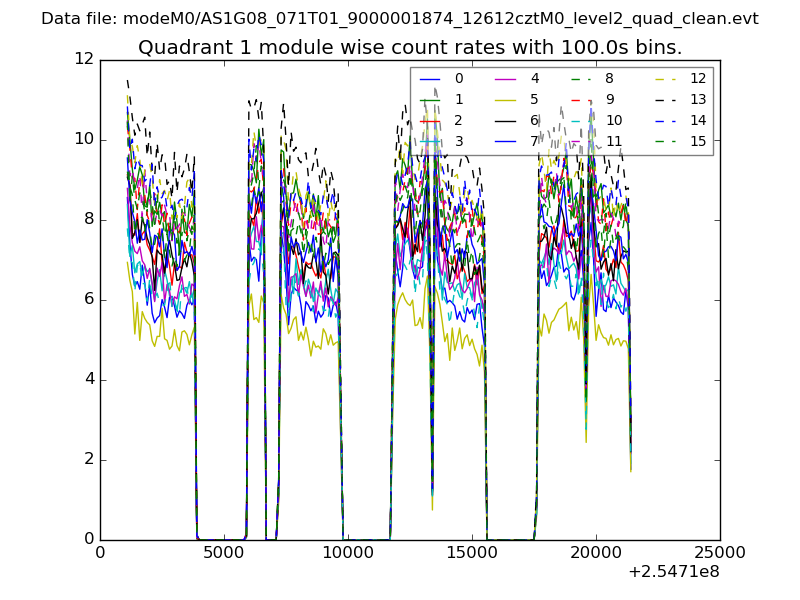
| Module-wise count rates for Quadrant A Data is divided into 100 sec bins |
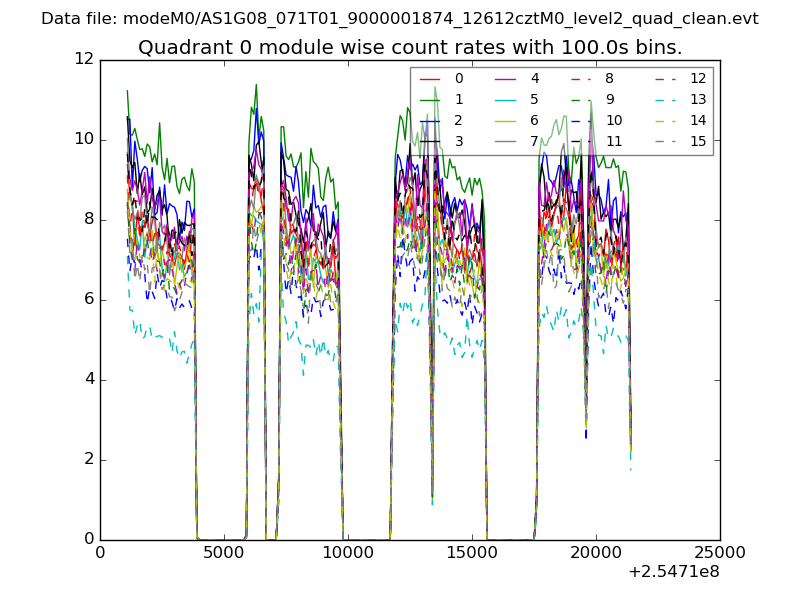 |
 |
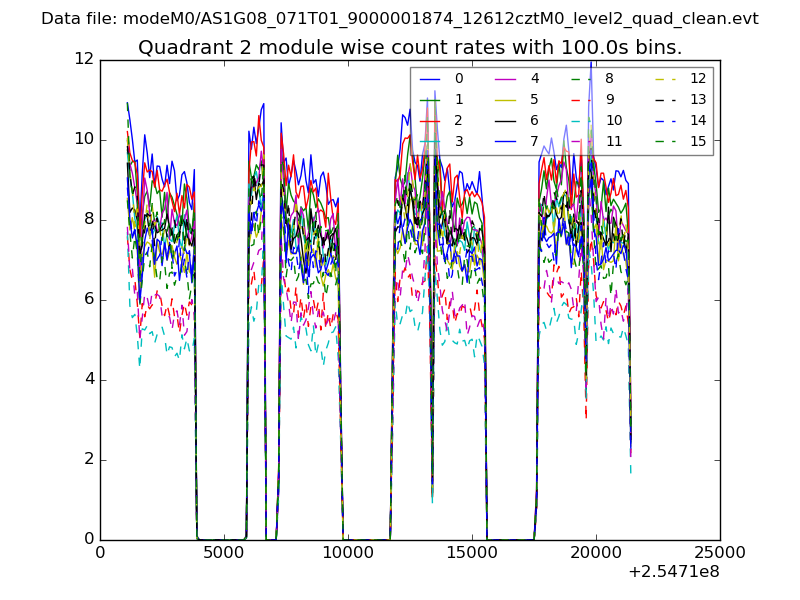
| Module-wise count rates for Quadrant B Data is divided into 100 sec bins |
 |
 |
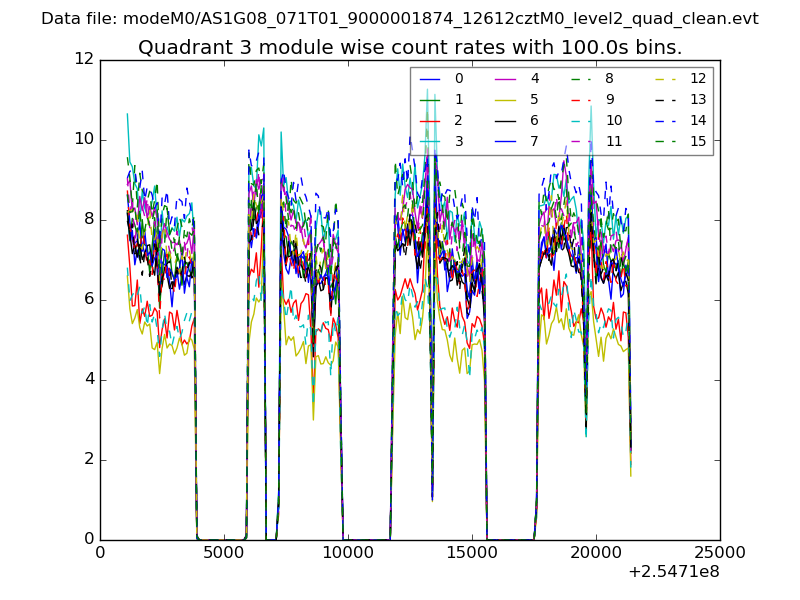
| Module-wise count rates for Quadrant C Data is divided into 100 sec bins |
 |
 |
| Module-wise count rates for Quadrant D Data is divided into 100 sec bins |
 |
 |
| Parameter | Plot |
|---|---|
| CZT HV Monitor | 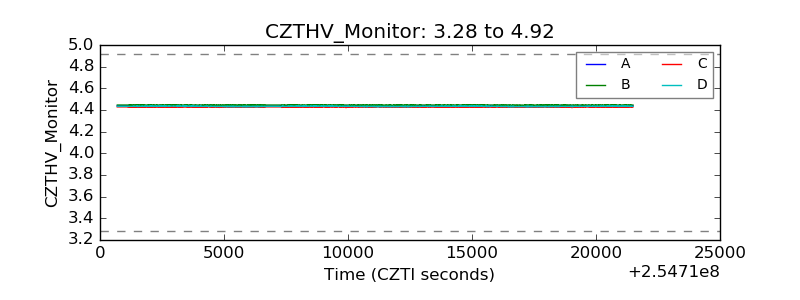 |
| D_VDD |  |
| Temperature 1 | 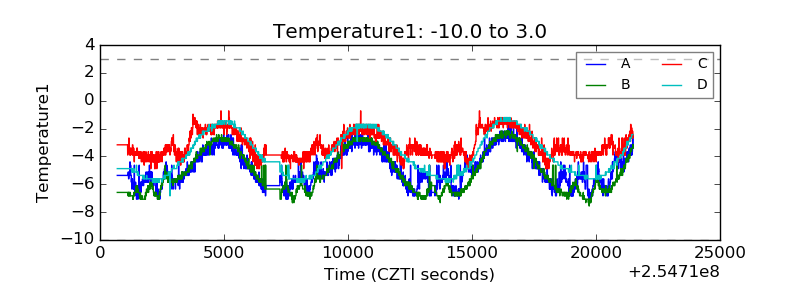 |
| Veto HV Monitor |  |
| Veto LLD | 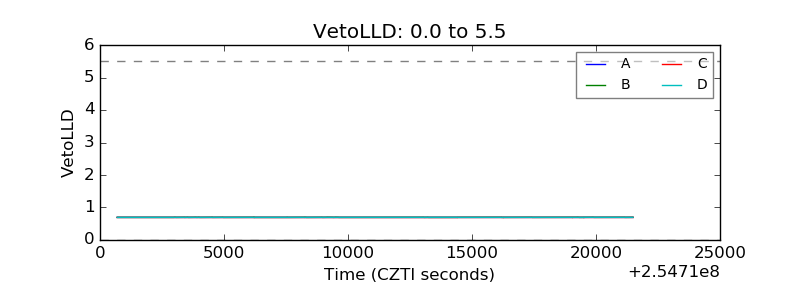 |
| Alpha Counter | 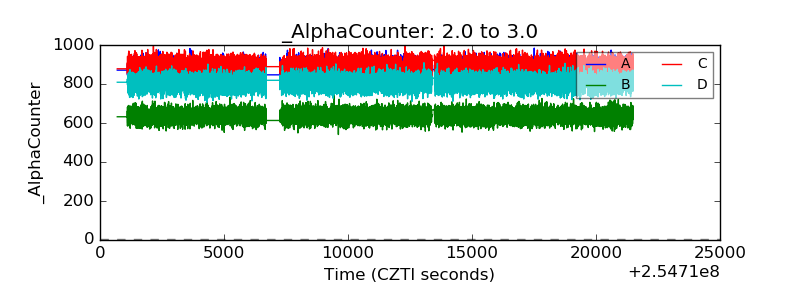 |
| _CPM_Rate | 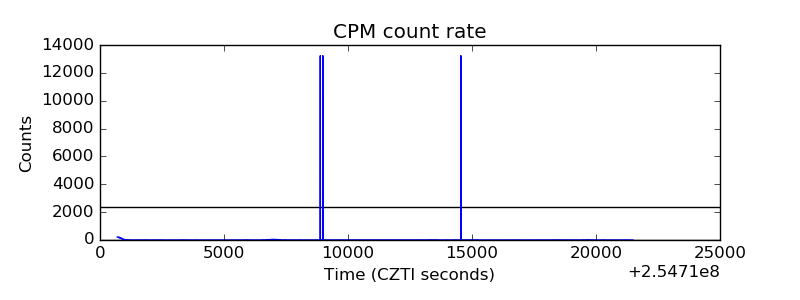 |
| CZT Counter | 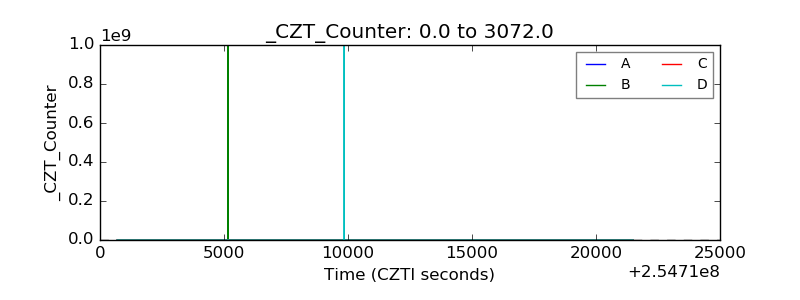 |
| +2.5 Volts monitor |  |
| +5 Volts monitor |  |
| _ROLL_ROT | 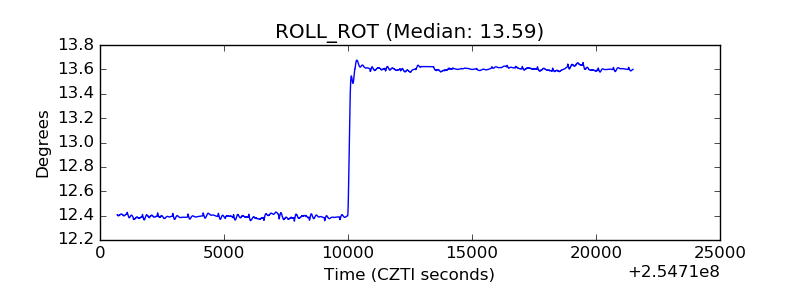 |
| _Roll_DEC | 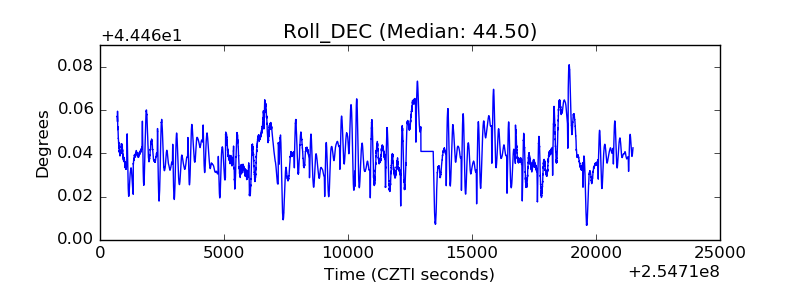 |
| _Roll_RA | 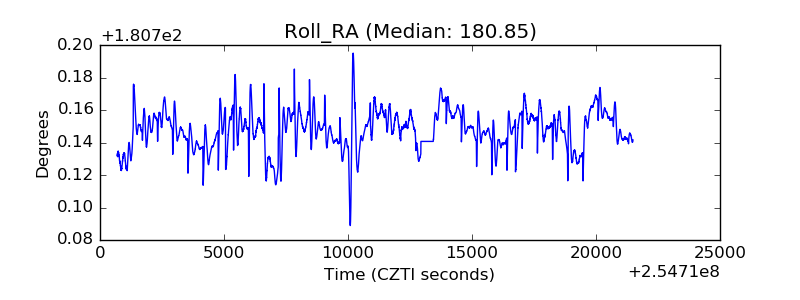 |
| Veto Counter | 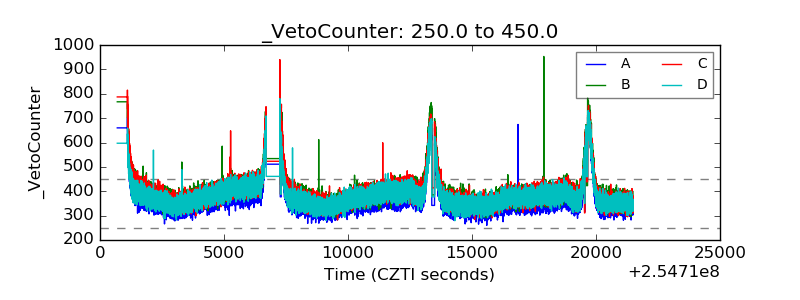 |