| Param | Original file | Final file |
|---|---|---|
| Filename | modeM0/AS1G08_071T01_9000001874_12615cztM0_level2.evt | modeM0/AS1G08_071T01_9000001874_12615cztM0_level2_quad_clean.evt |
| Size (bytes) | 1,350,213,120 | 206,245,440 |
| Size | 1.3 GB | 196.7 MB |
| Events in quadrant A | 8,336,033 | 1,263,170 |
| Events in quadrant B | 10,225,732 | 1,262,093 |
| Events in quadrant C | 8,388,569 | 1,272,143 |
| Events in quadrant D | 12,718,542 | 1,201,621 |
| Mode SS | |||
|---|---|---|---|
| Quadrant | BADHDUFLAG | Total packets | Discarded packets |
| A | 0 | 368 | 0 |
| B | 0 | 368 | 0 |
| C | 0 | 368 | 0 |
| D | 0 | 368 | 0 |
| Mode M0 | |||
|---|---|---|---|
| Quadrant | BADHDUFLAG | Total packets | Discarded packets |
| A | 0 | 36940 | 4 |
| B | 0 | 41967 | 3 |
| C | 0 | 37565 | 3 |
| D | 0 | 49974 | 3 |
| Mode M9 | |||
|---|---|---|---|
| Quadrant | BADHDUFLAG | Total packets | Discarded packets |
| A | 0 | 16 | 0 |
| B | 0 | 16 | 0 |
| C | 0 | 16 | 0 |
| D | 0 | 16 | 0 |
| Quadrant | Total seconds | Saturated seconds | Saturation percentage |
|---|---|---|---|
| A | 18093 | 240 | 1.326480% |
| B | 18093 | 695 | 3.841265% |
| C | 18093 | 191 | 1.055657% |
| D | 18093 | 689 | 3.808103% |
Noise dominated data is calculated using 1-second bins in cleaned event files. If a bin has >2000 counts, and if more than 50% of those come from <1% of pixels, then it is considered to be noise-dominated and hence unusable.
| Quadrant | # 1 sec bins | Bins with >0 counts | Bins with >2000 counts | High rate bins dominated by noise | Noise dominated (total time) | Noise dominated (detector-on time) | Marked lightcurve |
|---|---|---|---|---|---|---|---|
| A | 19759 | 18094 | 4 | 4 | 0.02% | 0.02% |  |
| B | 19759 | 18094 | 419 | 419 | 2.12% | 2.32% |  |
| C | 19759 | 18095 | 30 | 30 | 0.15% | 0.17% |  |
| D | 19759 | 18095 | 482 | 482 | 2.44% | 2.66% |  |
Top three noisy pixels from each quadrant. If the there are fewer than three noisy pixels in the level2.evt file, extra rows are filled as -1
| Pixel properties | Quadrant properties | ||||||
|---|---|---|---|---|---|---|---|
| Quadrant | DetID | PixID | Counts | Sigma | Mean | Median | Sigma |
| A | 12 | 189 | 103314 | 236.42 | 2112 | 2062 | 428.3 |
| A | 3 | 1 | 67934 | 153.81 | 2112 | 2062 | 428.3 |
| A | 9 | 143 | 33776 | 74.05 | 2112 | 2062 | 428.3 |
| B | 4 | 239 | 1605345 | 3986.38 | 2088 | 2032 | 402.2 |
| B | 11 | 51 | 132075 | 323.33 | 2088 | 2032 | 402.2 |
| B | 0 | 214 | 76484 | 185.11 | 2088 | 2032 | 402.2 |
| C | 15 | 208 | 324271 | 678.75 | 2054 | 2058 | 474.7 |
| C | 14 | 234 | 56685 | 115.07 | 2054 | 2058 | 474.7 |
| C | 13 | 61 | 14769 | 26.78 | 2054 | 2058 | 474.7 |
| D | 10 | 157 | 2794851 | 5743.14 | 2021 | 1951 | 486.3 |
| D | 1 | 52 | 1984624 | 4077.04 | 2021 | 1951 | 486.3 |
| D | 13 | 249 | 115131 | 232.74 | 2021 | 1951 | 486.3 |
Histogram calculated using DETX and DETY for each event in the final _common_clean file
| Quadrant A |  |
 |
Quadrant B |
|---|---|---|---|
| Quadrant D |  |
 |
Quadrant C |
| Plot type | Count rate plots | Images |
|---|---|---|
| Comparison with Poisson distribution Blue bars denote a histogram of data divided into 1 sec bins. Red curve is a Poisson curve with rate = median count rate of data. |
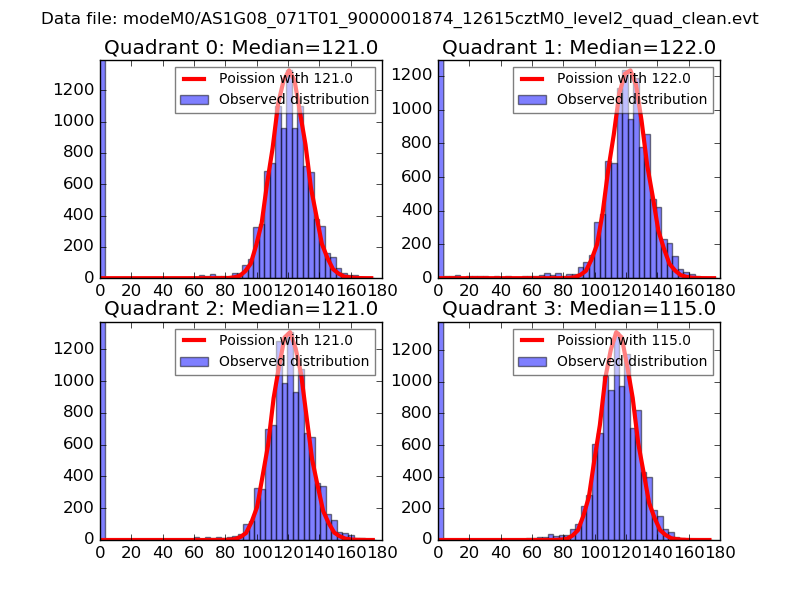 |
 |
| Quadrant-wise count rates Data is divided into 100 sec bins |
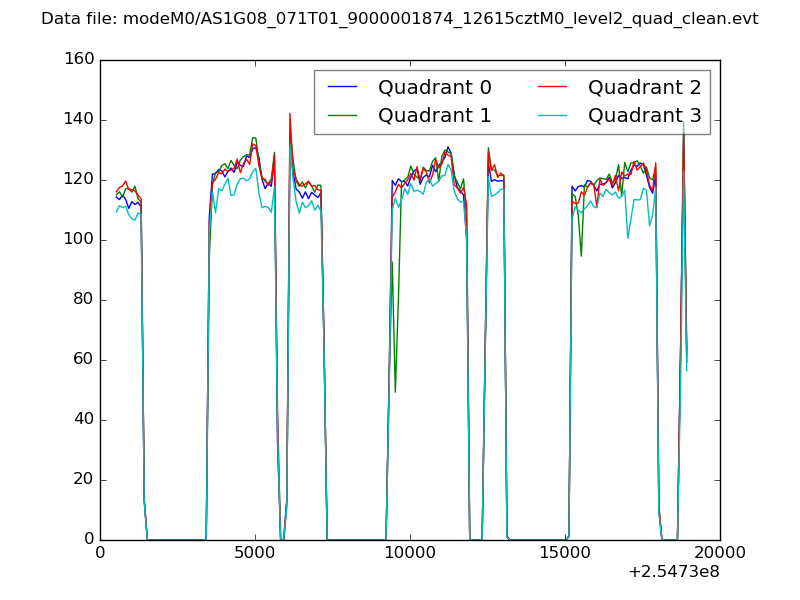 |
|
| Module-wise count rates for Quadrant A Data is divided into 100 sec bins |
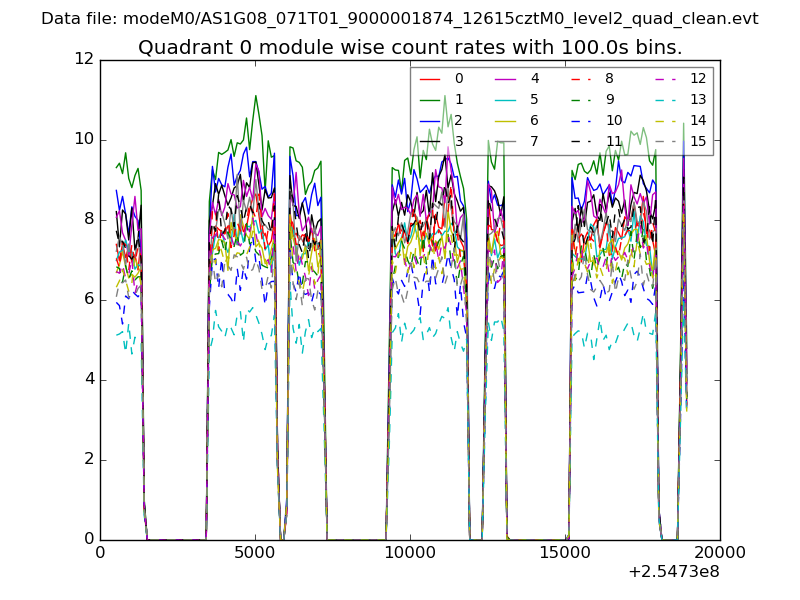 |
 |
| Module-wise count rates for Quadrant B Data is divided into 100 sec bins |
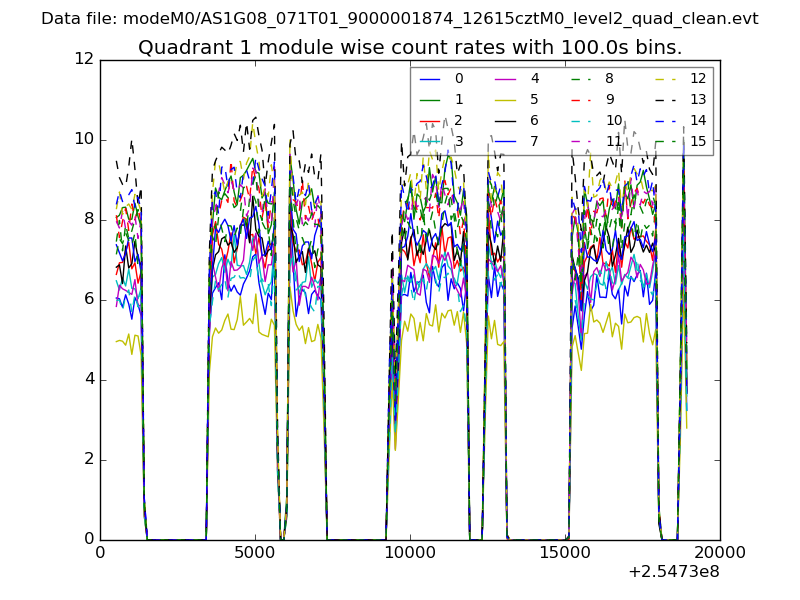 |
 |
| Module-wise count rates for Quadrant C Data is divided into 100 sec bins |
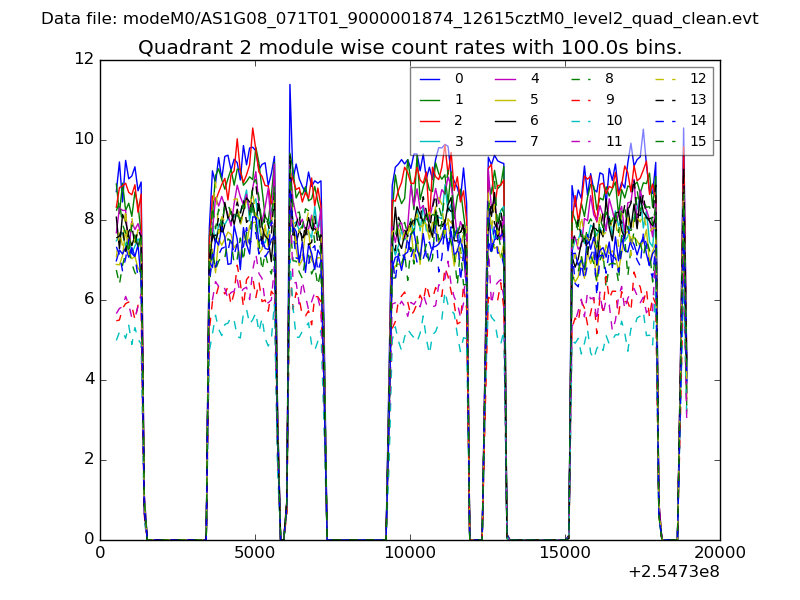 |
 |
| Module-wise count rates for Quadrant D Data is divided into 100 sec bins |
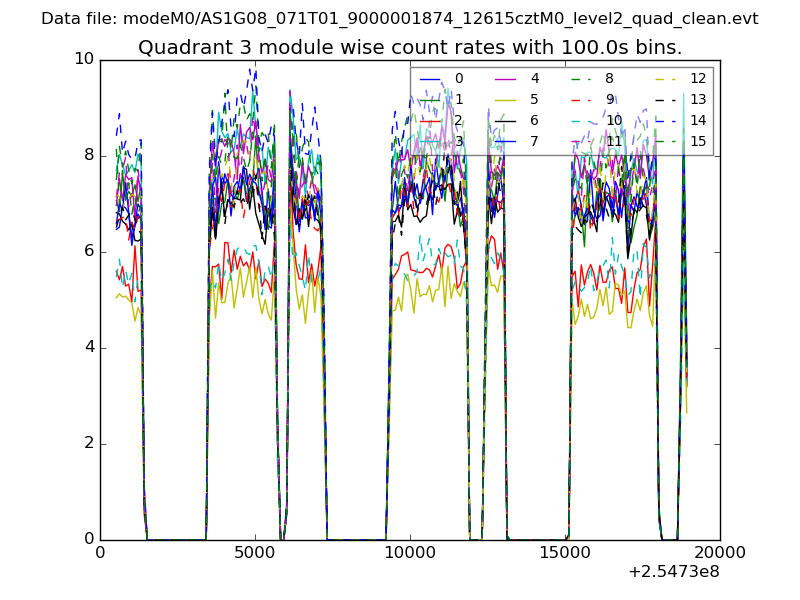 |
 |
| Parameter | Plot |
|---|---|
| CZT HV Monitor | 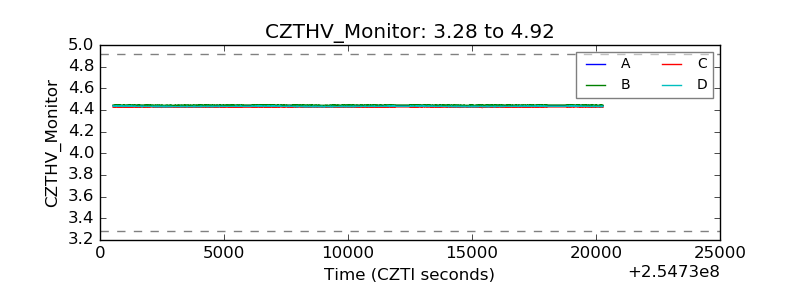 |
| D_VDD |  |
| Temperature 1 |  |
| Veto HV Monitor |  |
| Veto LLD |  |
| Alpha Counter | 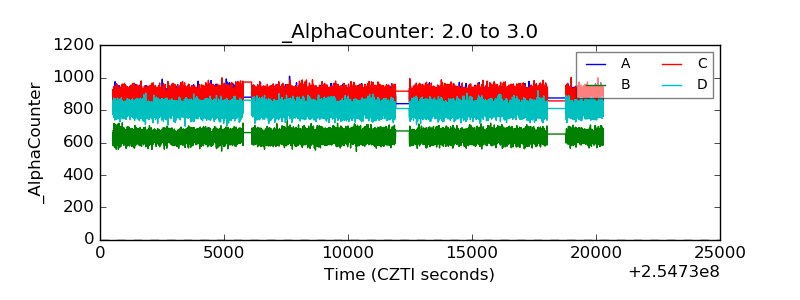 |
| _CPM_Rate | 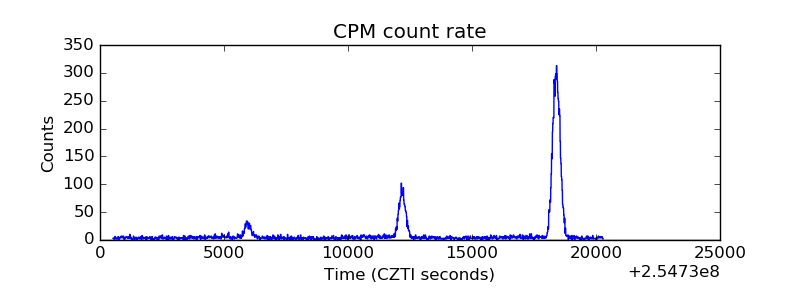 |
| CZT Counter |  |
| +2.5 Volts monitor |  |
| +5 Volts monitor |  |
| _ROLL_ROT | 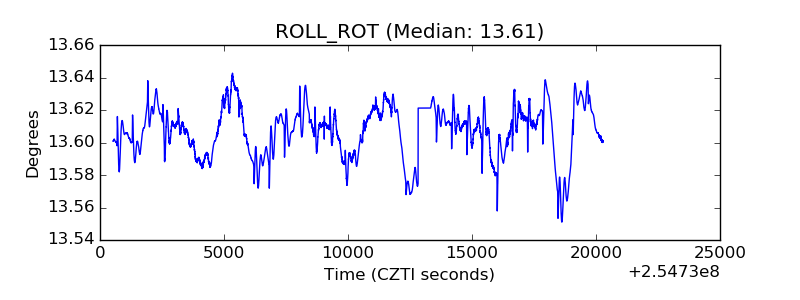 |
| _Roll_DEC |  |
| _Roll_RA |  |
| Veto Counter | 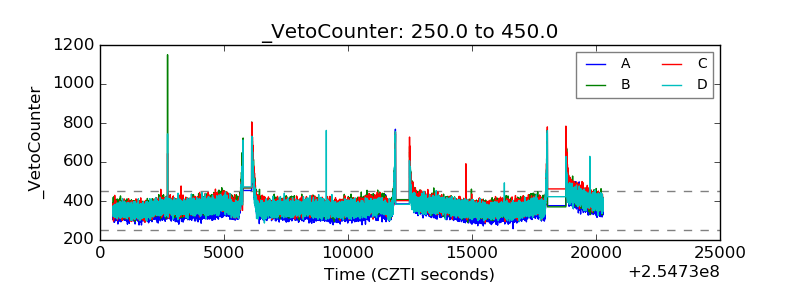 |