| Param | Original file | Final file |
|---|---|---|
| Filename | modeM0/AS1G08_071T01_9000001874_12618cztM0_level2.evt | modeM0/AS1G08_071T01_9000001874_12618cztM0_level2_quad_clean.evt |
| Size (bytes) | 500,209,920 | 68,688,000 |
| Size | 477.0 MB | 65.5 MB |
| Events in quadrant A | 3,294,546 | 409,914 |
| Events in quadrant B | 3,895,913 | 410,954 |
| Events in quadrant C | 3,275,612 | 411,600 |
| Events in quadrant D | 4,242,832 | 395,168 |
| Mode SS | |||
|---|---|---|---|
| Quadrant | BADHDUFLAG | Total packets | Discarded packets |
| A | 0 | 132 | 0 |
| B | 0 | 132 | 0 |
| C | 0 | 132 | 0 |
| D | 0 | 132 | 0 |
| Mode M0 | |||
|---|---|---|---|
| Quadrant | BADHDUFLAG | Total packets | Discarded packets |
| A | 0 | 14061 | 2 |
| B | 0 | 16012 | 1 |
| C | 0 | 13988 | 1 |
| D | 0 | 17069 | 1 |
| Mode M9 | |||
|---|---|---|---|
| Quadrant | BADHDUFLAG | Total packets | Discarded packets |
| A | 0 | 12 | 0 |
| B | 0 | 12 | 0 |
| C | 0 | 12 | 0 |
| D | 0 | 13 | 0 |
| Quadrant | Total seconds | Saturated seconds | Saturation percentage |
|---|---|---|---|
| A | 6481 | 75 | 1.157229% |
| B | 6481 | 243 | 3.749421% |
| C | 6481 | 78 | 1.203518% |
| D | 6481 | 229 | 3.533405% |
Noise dominated data is calculated using 1-second bins in cleaned event files. If a bin has >2000 counts, and if more than 50% of those come from <1% of pixels, then it is considered to be noise-dominated and hence unusable.
| Quadrant | # 1 sec bins | Bins with >0 counts | Bins with >2000 counts | High rate bins dominated by noise | Noise dominated (total time) | Noise dominated (detector-on time) | Marked lightcurve |
|---|---|---|---|---|---|---|---|
| A | 7573 | 6482 | 3 | 3 | 0.04% | 0.05% | 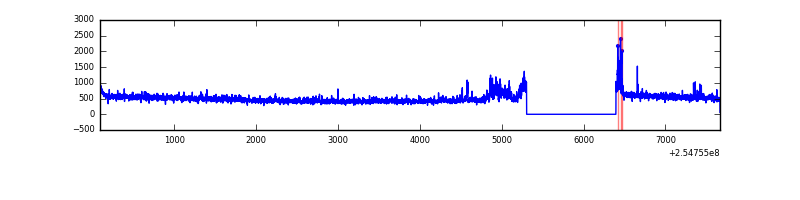 |
| B | 7573 | 6482 | 130 | 130 | 1.72% | 2.01% | 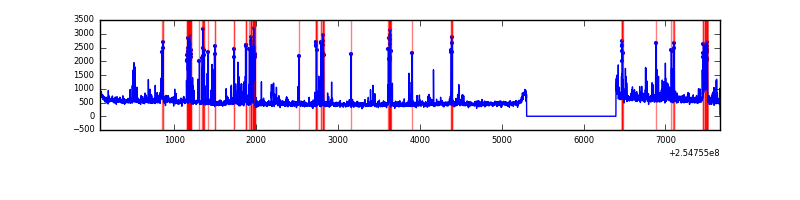 |
| C | 7573 | 6482 | 45 | 45 | 0.59% | 0.69% | 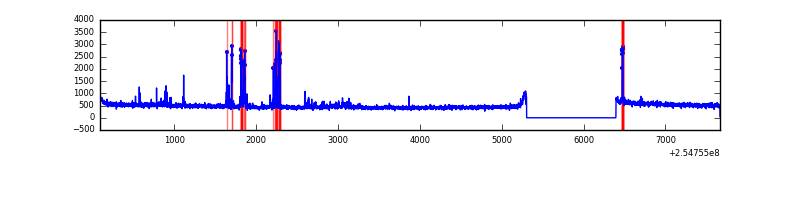 |
| D | 7573 | 6482 | 138 | 138 | 1.82% | 2.13% | 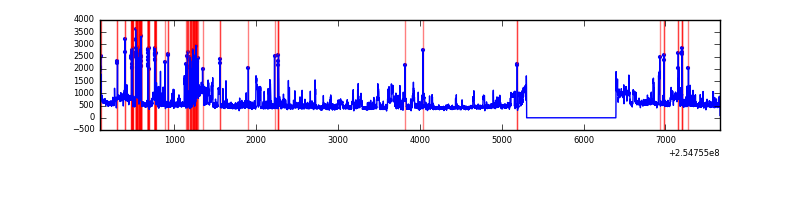 |
Top three noisy pixels from each quadrant. If the there are fewer than three noisy pixels in the level2.evt file, extra rows are filled as -1
| Pixel properties | Quadrant properties | ||||||
|---|---|---|---|---|---|---|---|
| Quadrant | DetID | PixID | Counts | Sigma | Mean | Median | Sigma |
| A | 3 | 1 | 179070 | 1081.61 | 802 | 783 | 164.8 |
| A | 12 | 189 | 28617 | 168.86 | 802 | 783 | 164.8 |
| A | 0 | 226 | 7156 | 38.66 | 802 | 783 | 164.8 |
| B | 4 | 239 | 538535 | 3568.98 | 793 | 773 | 150.7 |
| B | 3 | 64 | 91782 | 604.0 | 793 | 773 | 150.7 |
| B | 11 | 51 | 38425 | 249.88 | 793 | 773 | 150.7 |
| C | 15 | 208 | 215300 | 1187.41 | 780 | 784 | 180.7 |
| C | 14 | 234 | 20662 | 110.03 | 780 | 784 | 180.7 |
| C | 13 | 61 | 5752 | 27.5 | 780 | 784 | 180.7 |
| D | 10 | 157 | 708873 | 3854.33 | 765 | 745 | 183.7 |
| D | 1 | 52 | 545994 | 2967.78 | 765 | 745 | 183.7 |
| D | 13 | 249 | 42670 | 228.2 | 765 | 745 | 183.7 |
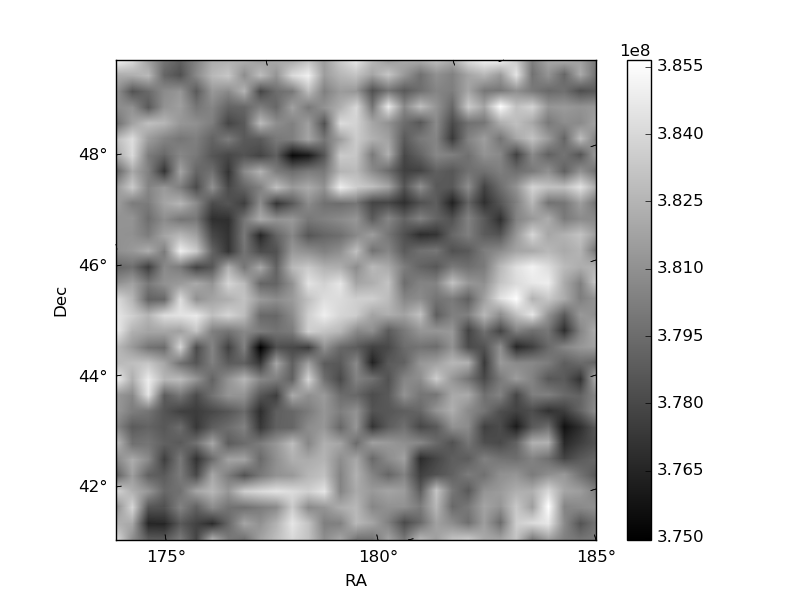
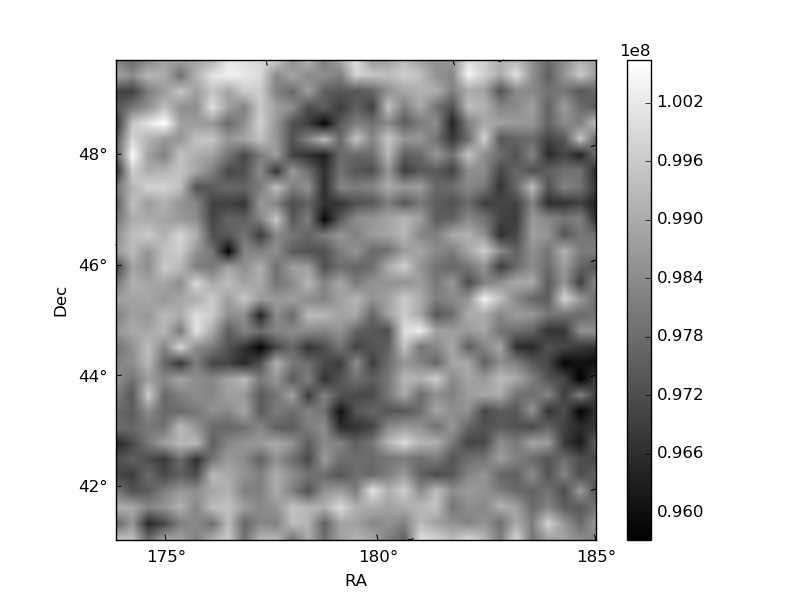
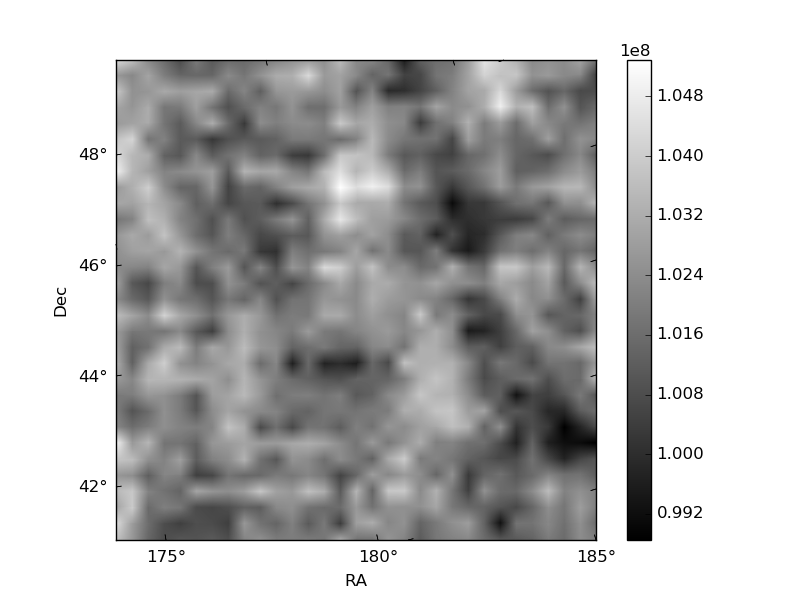
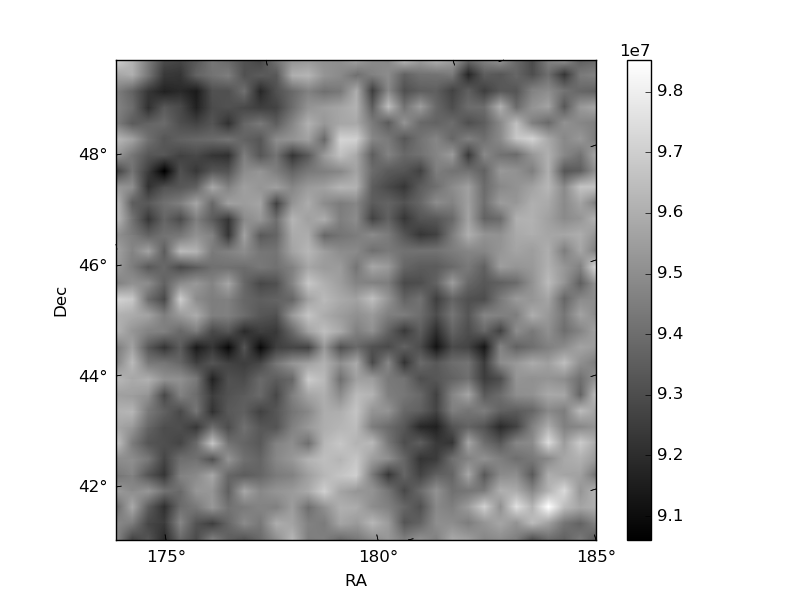
Histogram calculated using DETX and DETY for each event in the final _common_clean file
| Quadrant A | 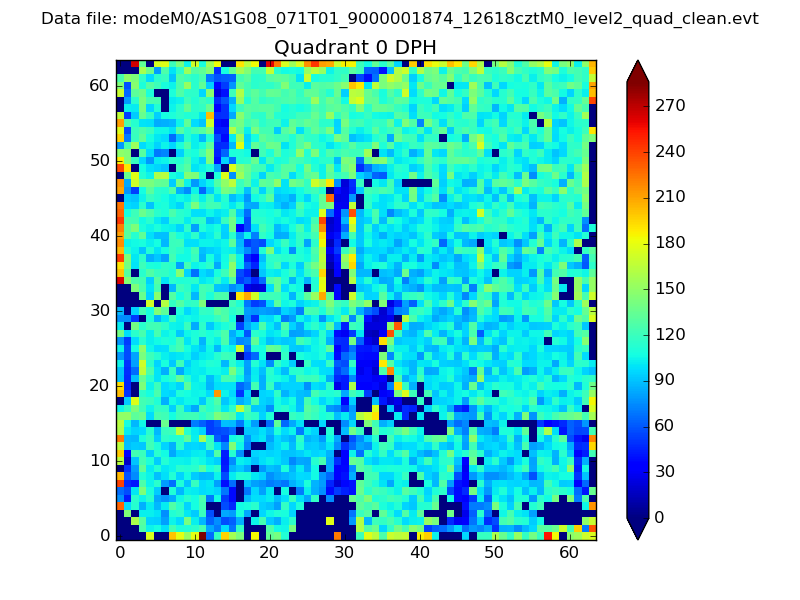 |
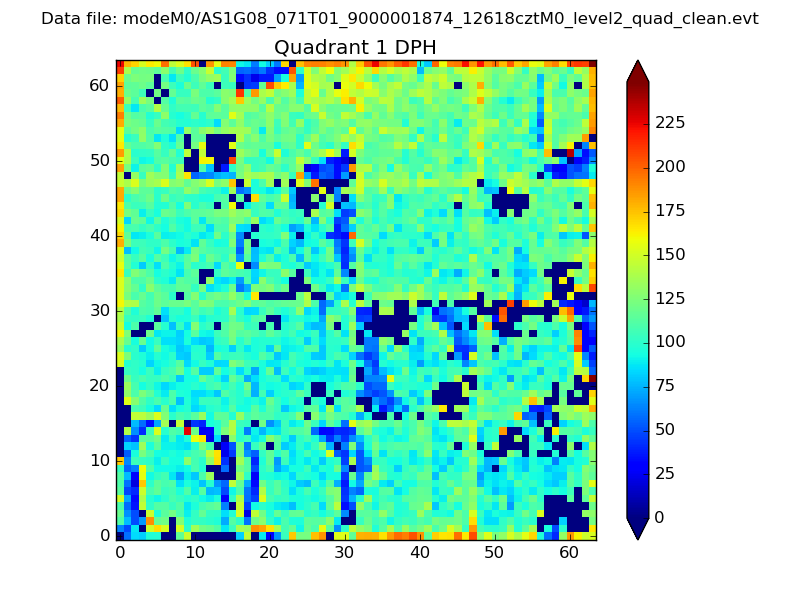 |
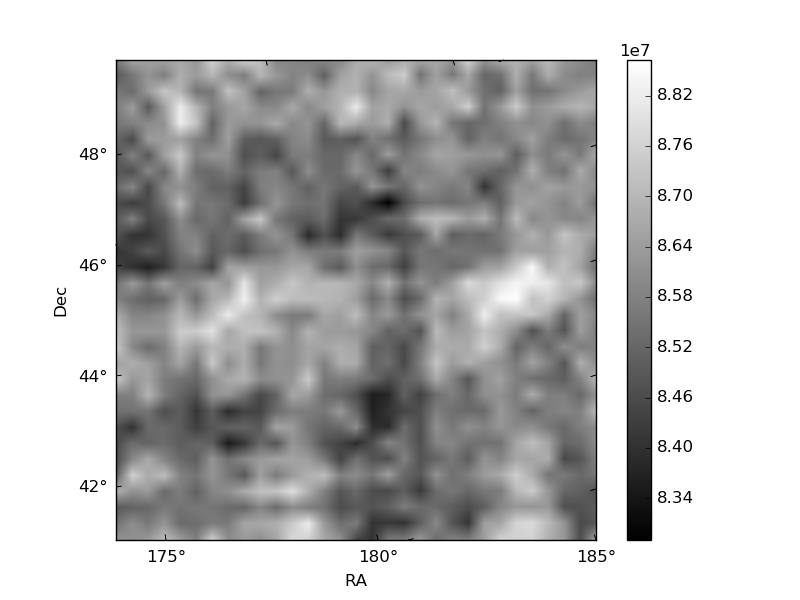
Quadrant B |
|---|---|---|---|
| Quadrant D | 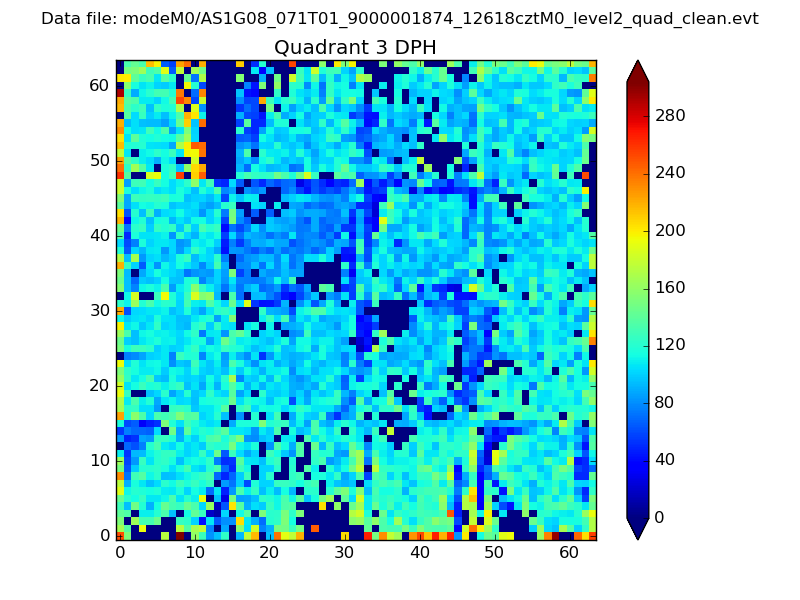 |
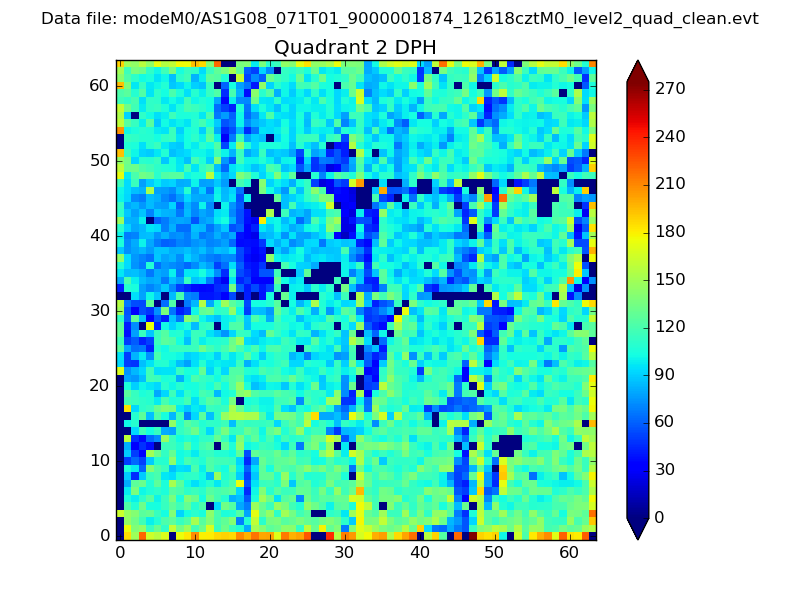 |
Quadrant C |
| Plot type | Count rate plots | Images |
|---|---|---|
| Comparison with Poisson distribution Blue bars denote a histogram of data divided into 1 sec bins. Red curve is a Poisson curve with rate = median count rate of data. |
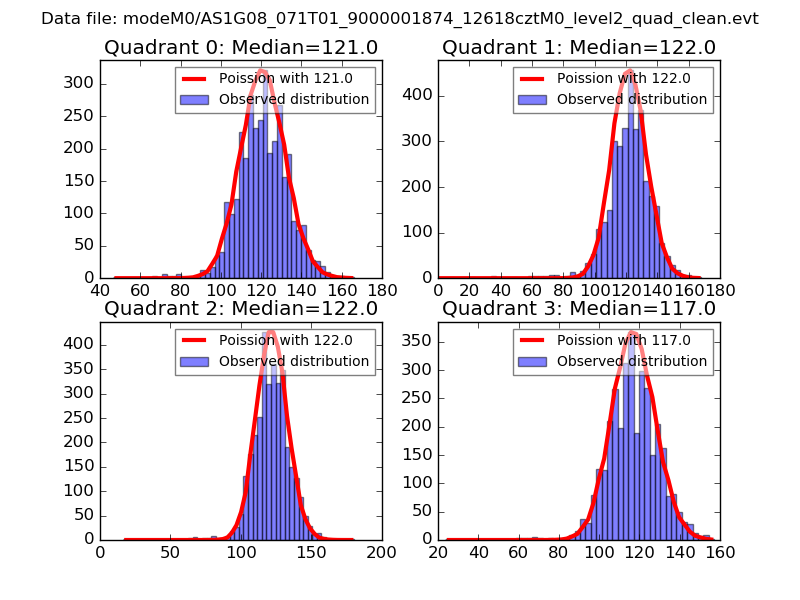 |
 |
| Quadrant-wise count rates Data is divided into 100 sec bins |
 |
|
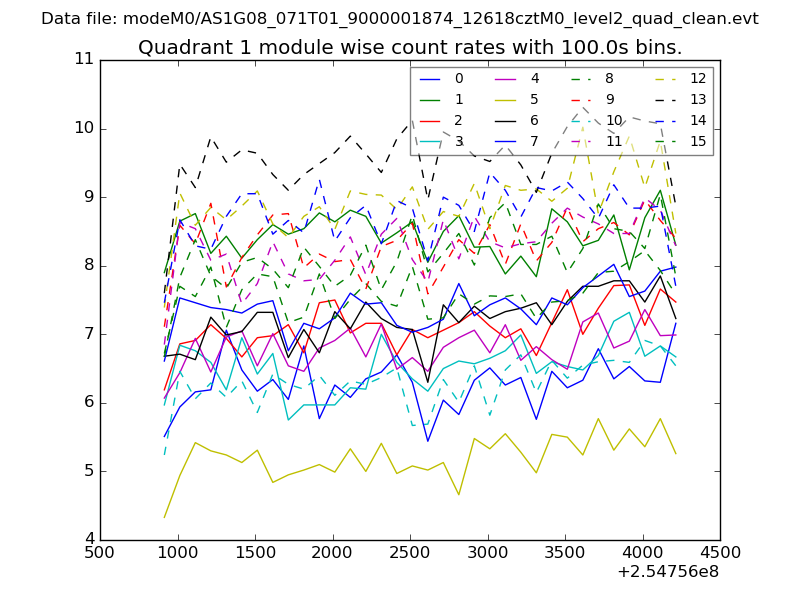
| Module-wise count rates for Quadrant A Data is divided into 100 sec bins |
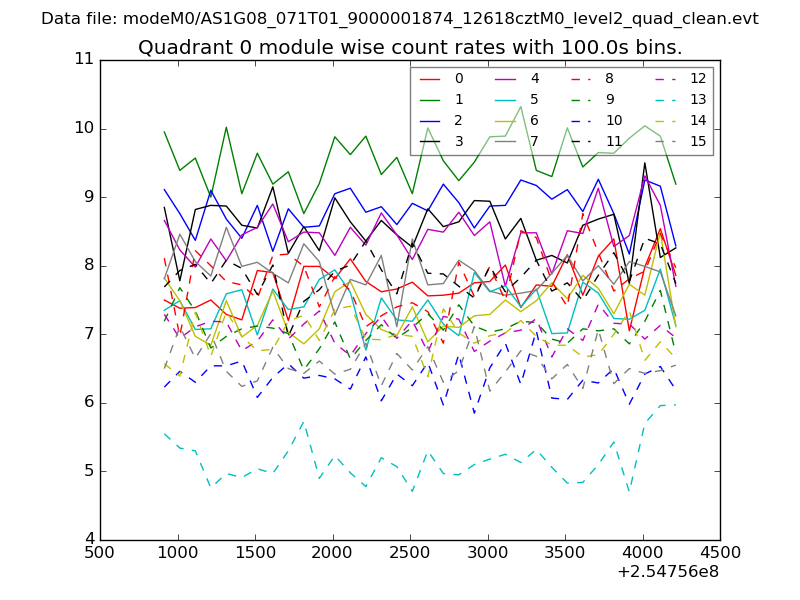 |
 |
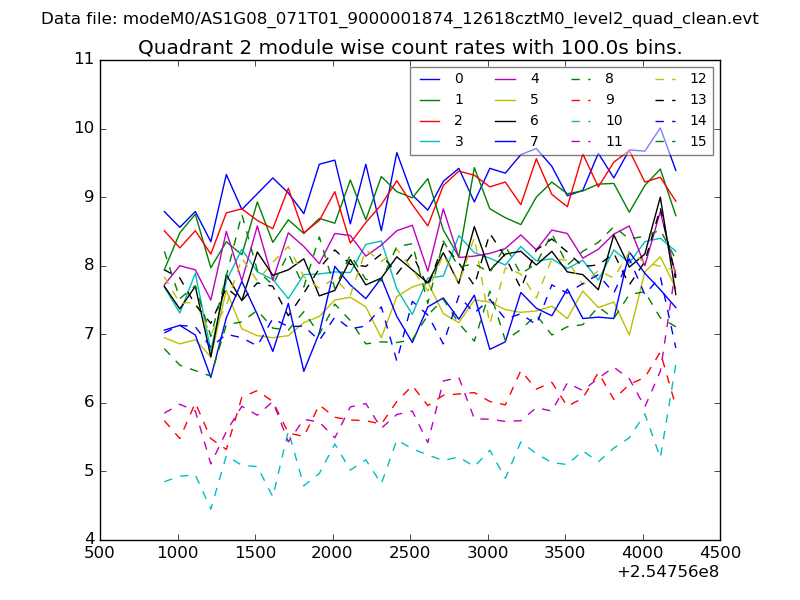
| Module-wise count rates for Quadrant B Data is divided into 100 sec bins |
 |
 |
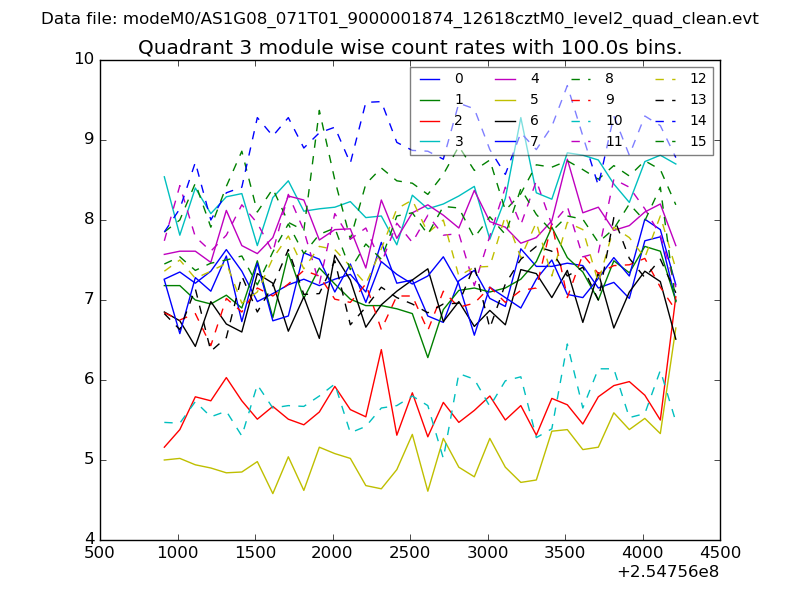
| Module-wise count rates for Quadrant C Data is divided into 100 sec bins |
 |
 |
| Module-wise count rates for Quadrant D Data is divided into 100 sec bins |
 |
 |
| Parameter | Plot |
|---|---|
| CZT HV Monitor | 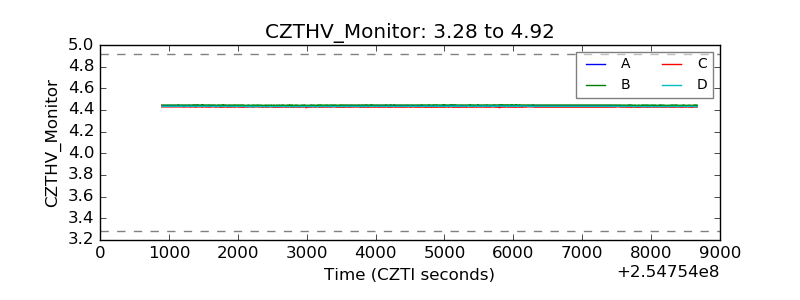 |
| D_VDD | 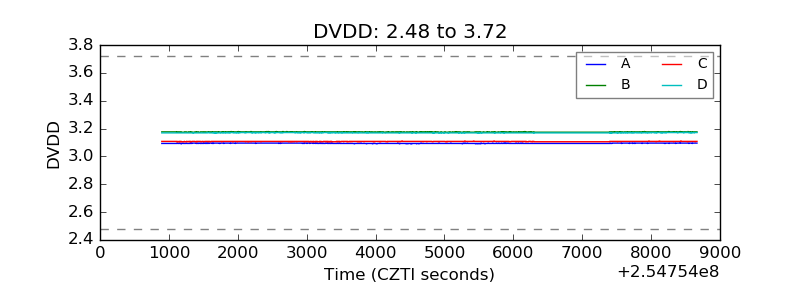 |
| Temperature 1 | 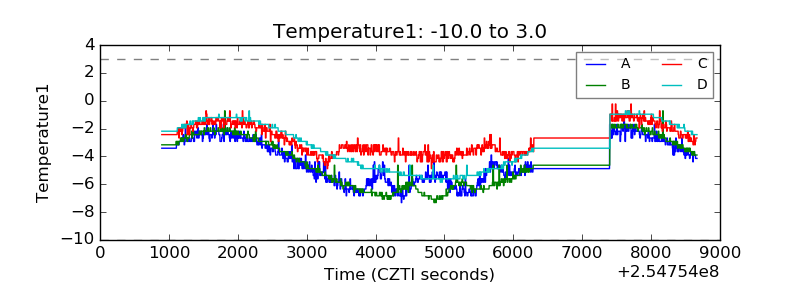 |
| Veto HV Monitor | 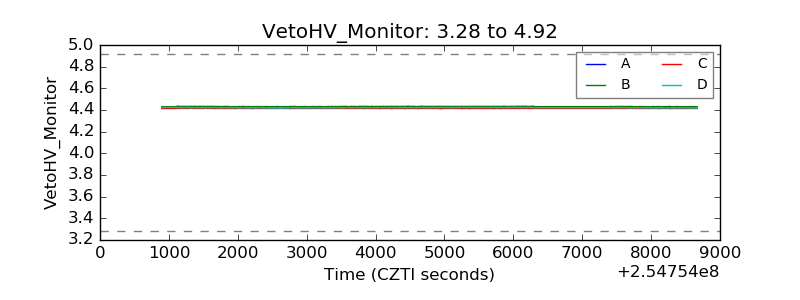 |
| Veto LLD | 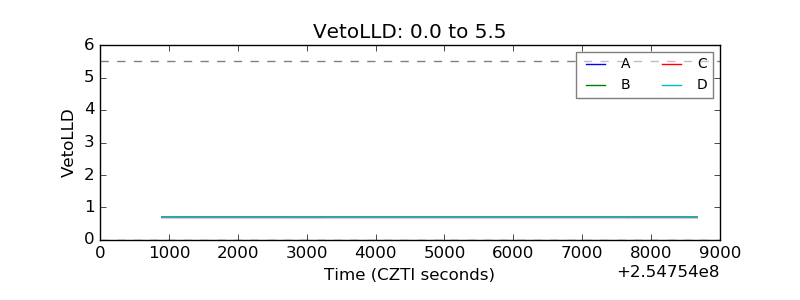 |
| Alpha Counter | 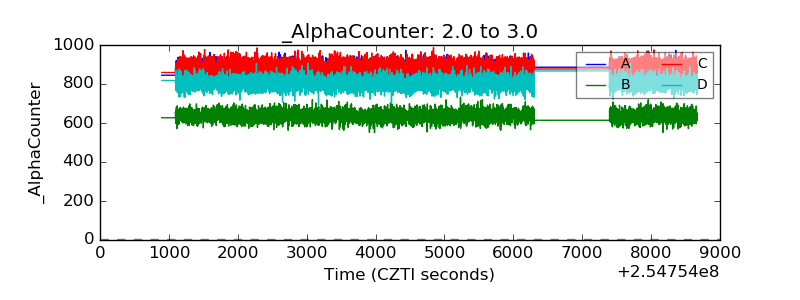 |
| _CPM_Rate | 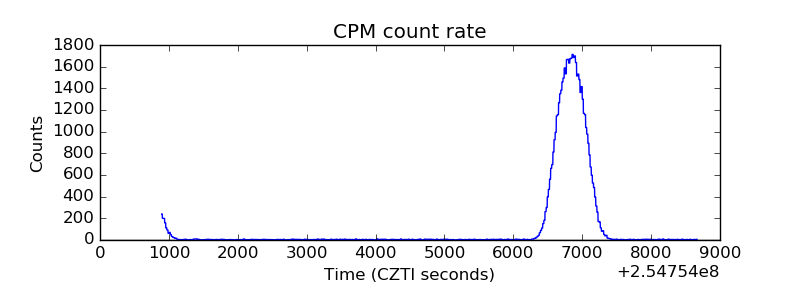 |
| CZT Counter | 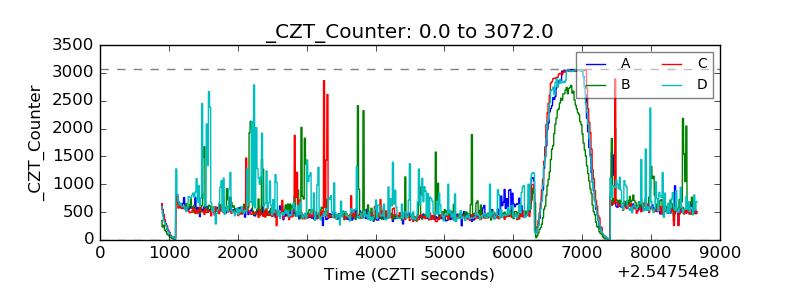 |
| +2.5 Volts monitor |  |
| +5 Volts monitor |  |
| _ROLL_ROT | 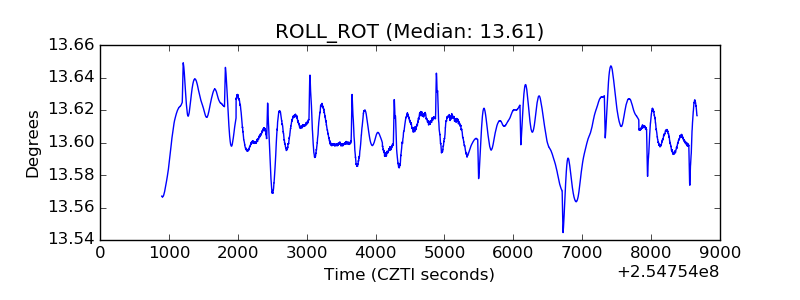 |
| _Roll_DEC | 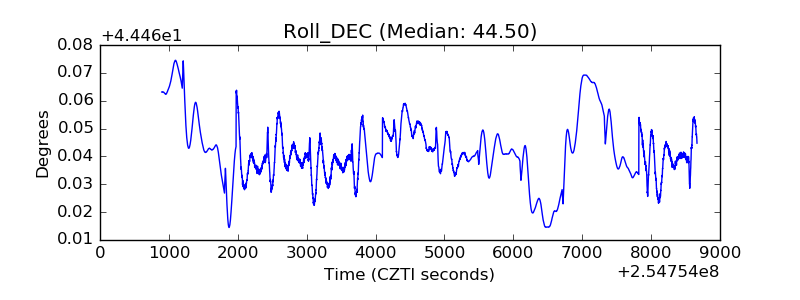 |
| _Roll_RA | 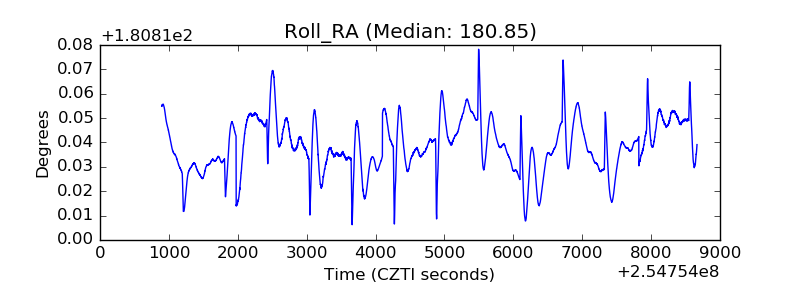 |
| Veto Counter | 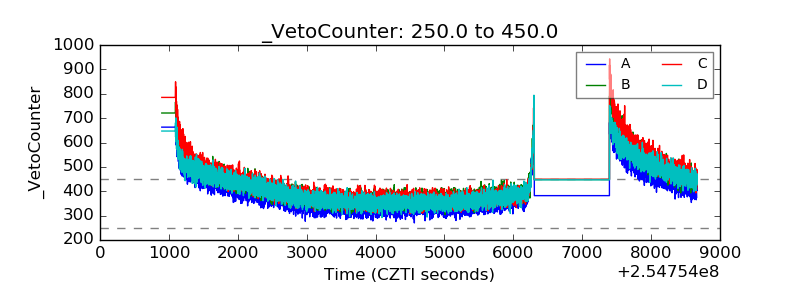 |