| Param | Original file | Final file |
|---|---|---|
| Filename | modeM0/AS1G08_071T01_9000001874_12619cztM0_level2.evt | modeM0/AS1G08_071T01_9000001874_12619cztM0_level2_quad_clean.evt |
| Size (bytes) | 532,468,800 | 79,882,560 |
| Size | 507.8 MB | 76.2 MB |
| Events in quadrant A | 3,254,061 | 505,223 |
| Events in quadrant B | 4,212,648 | 491,800 |
| Events in quadrant C | 3,642,421 | 497,613 |
| Events in quadrant D | 4,588,380 | 483,473 |
| Mode SS | |||
|---|---|---|---|
| Quadrant | BADHDUFLAG | Total packets | Discarded packets |
| A | 0 | 130 | 0 |
| B | 0 | 130 | 0 |
| C | 0 | 130 | 0 |
| D | 0 | 130 | 0 |
| Mode M0 | |||
|---|---|---|---|
| Quadrant | BADHDUFLAG | Total packets | Discarded packets |
| A | 0 | 13877 | 2 |
| B | 0 | 16954 | 1 |
| C | 0 | 15108 | 1 |
| D | 0 | 18082 | 1 |
| Mode M9 | |||
|---|---|---|---|
| Quadrant | BADHDUFLAG | Total packets | Discarded packets |
| A | 0 | 23 | 0 |
| B | 0 | 23 | 0 |
| C | 0 | 23 | 0 |
| D | 0 | 23 | 0 |
| Quadrant | Total seconds | Saturated seconds | Saturation percentage |
|---|---|---|---|
| A | 6313 | 127 | 2.011722% |
| B | 6313 | 411 | 6.510375% |
| C | 6313 | 255 | 4.039284% |
| D | 6313 | 343 | 5.433233% |
Noise dominated data is calculated using 1-second bins in cleaned event files. If a bin has >2000 counts, and if more than 50% of those come from <1% of pixels, then it is considered to be noise-dominated and hence unusable.
| Quadrant | # 1 sec bins | Bins with >0 counts | Bins with >2000 counts | High rate bins dominated by noise | Noise dominated (total time) | Noise dominated (detector-on time) | Marked lightcurve |
|---|---|---|---|---|---|---|---|
| A | 8585 | 6314 | 4 | 4 | 0.05% | 0.06% | 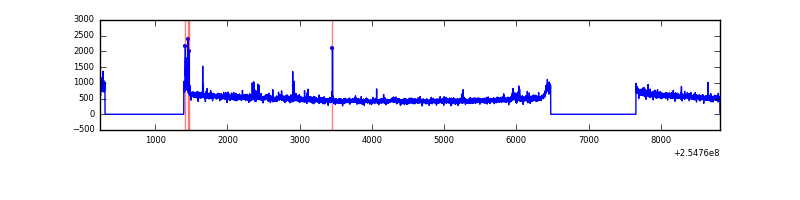 |
| B | 8584 | 6313 | 217 | 217 | 2.53% | 3.44% | 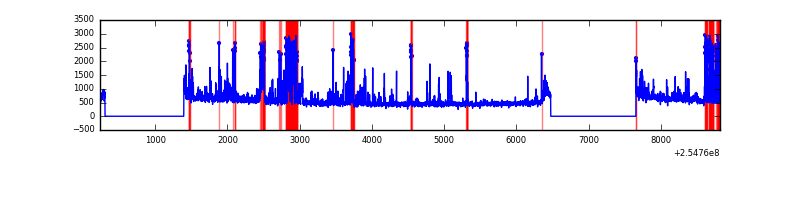 |
| C | 8585 | 6314 | 176 | 176 | 2.05% | 2.79% | 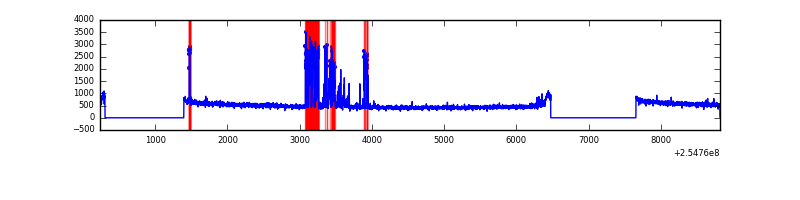 |
| D | 8585 | 6314 | 188 | 188 | 2.19% | 2.98% | 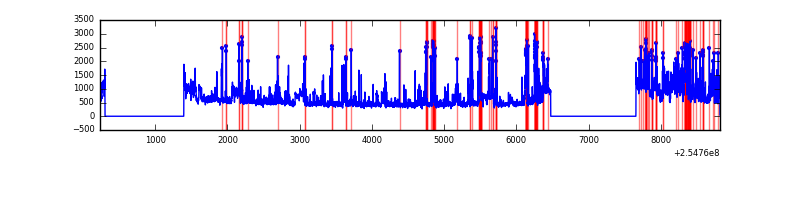 |
Top three noisy pixels from each quadrant. If the there are fewer than three noisy pixels in the level2.evt file, extra rows are filled as -1
| Pixel properties | Quadrant properties | ||||||
|---|---|---|---|---|---|---|---|
| Quadrant | DetID | PixID | Counts | Sigma | Mean | Median | Sigma |
| A | 3 | 1 | 87274 | 527.78 | 809 | 792 | 163.9 |
| A | 12 | 189 | 51603 | 310.09 | 809 | 792 | 163.9 |
| A | 0 | 226 | 7122 | 38.63 | 809 | 792 | 163.9 |
| B | 4 | 239 | 771651 | 5158.97 | 793 | 775 | 149.4 |
| B | 3 | 64 | 114235 | 759.31 | 793 | 775 | 149.4 |
| B | 0 | 230 | 89870 | 596.26 | 793 | 775 | 149.4 |
| C | 15 | 208 | 576195 | 3184.13 | 786 | 790 | 180.7 |
| C | 13 | 61 | 5702 | 27.18 | 786 | 790 | 180.7 |
| C | 14 | 234 | 2394 | 8.88 | 786 | 790 | 180.7 |
| D | 1 | 52 | 831876 | 4452.11 | 780 | 759 | 186.7 |
| D | 10 | 157 | 587428 | 3142.66 | 780 | 759 | 186.7 |
| D | 10 | 199 | 104603 | 556.27 | 780 | 759 | 186.7 |
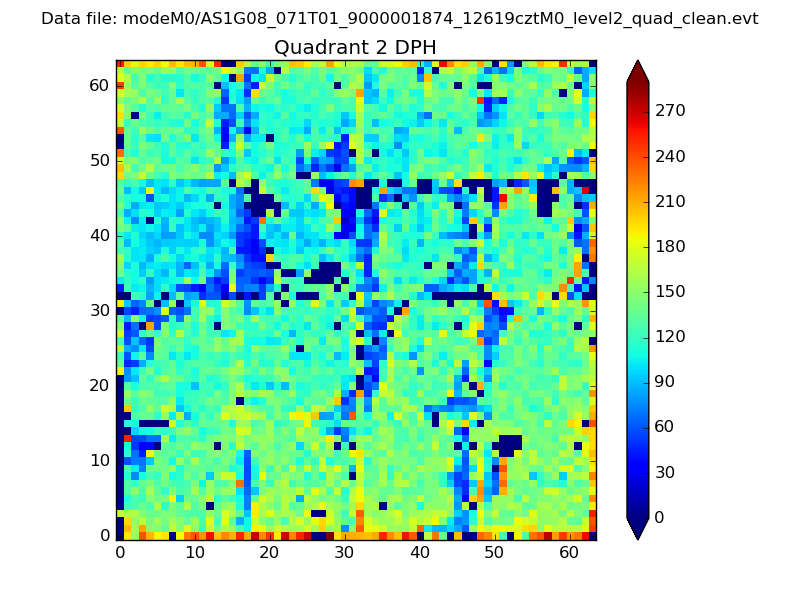
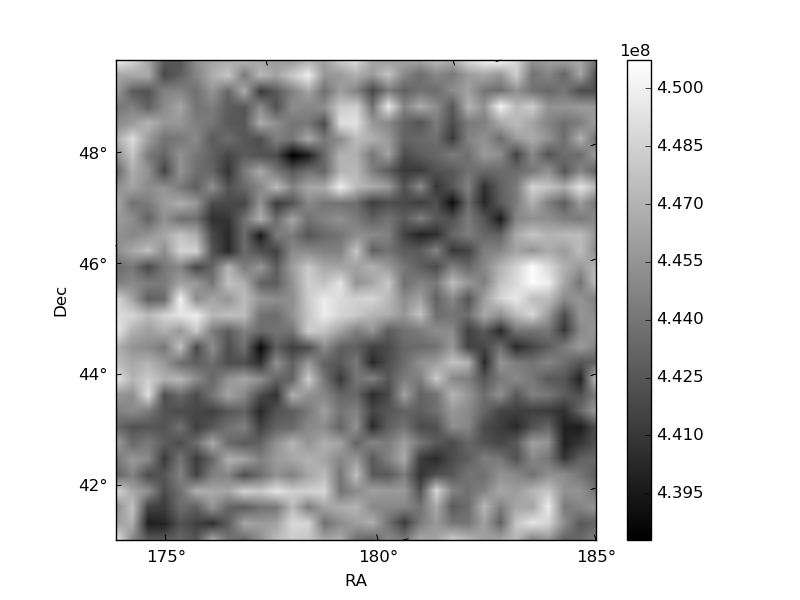
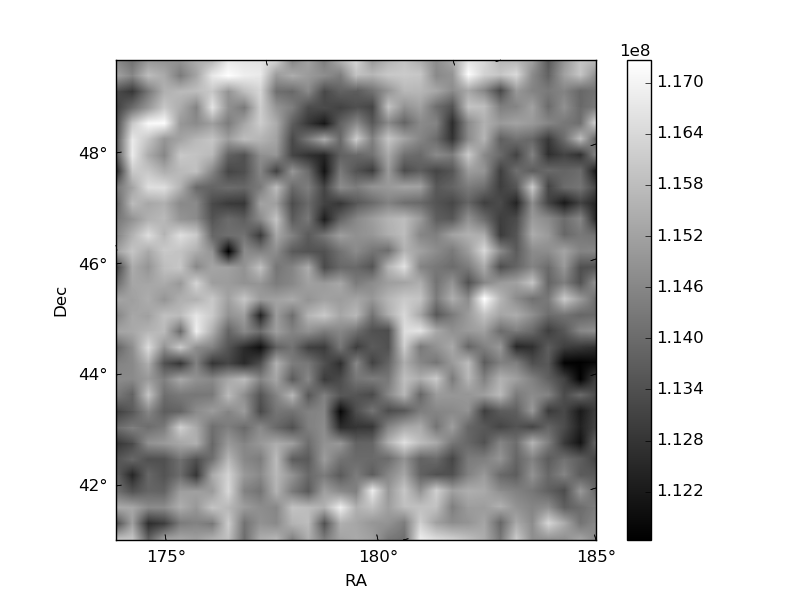
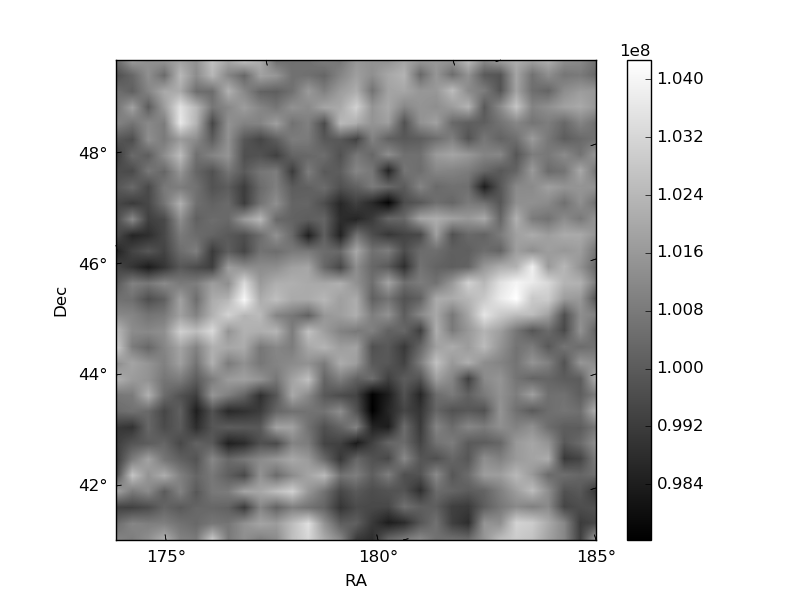
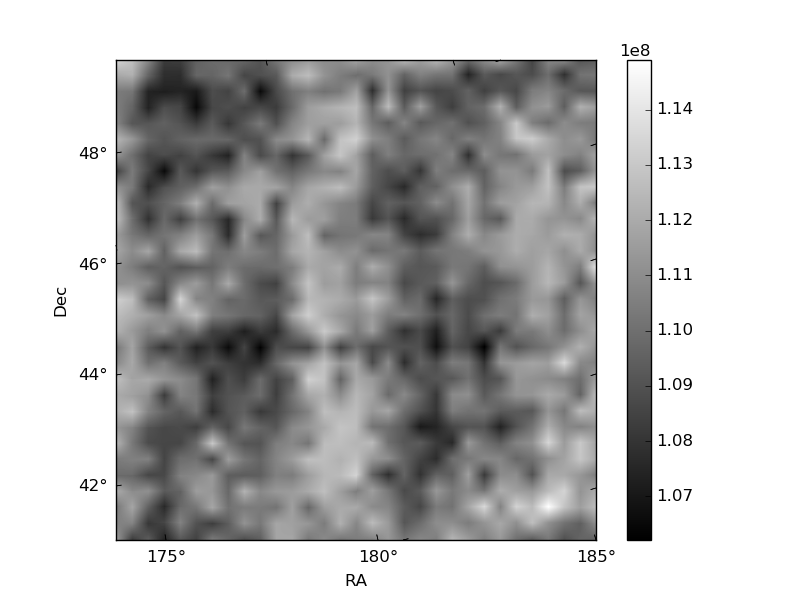
Histogram calculated using DETX and DETY for each event in the final _common_clean file
| Quadrant A | 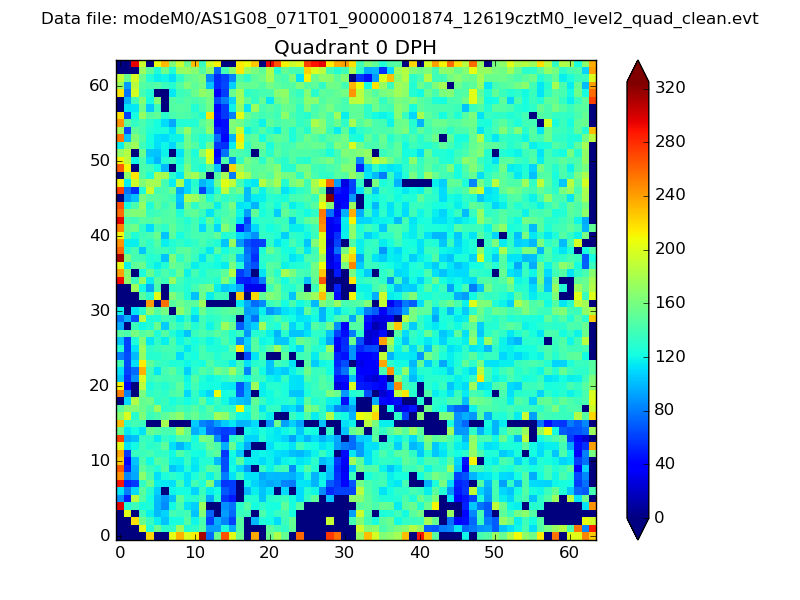 |
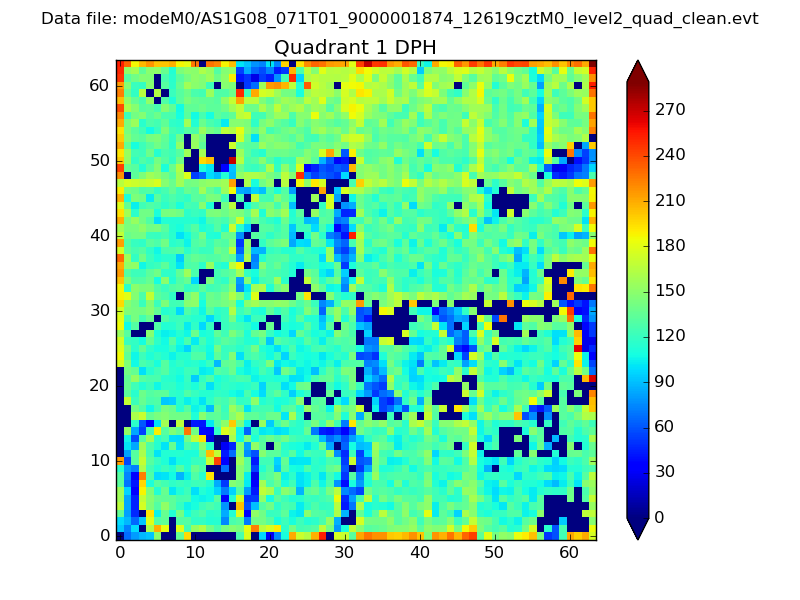 |
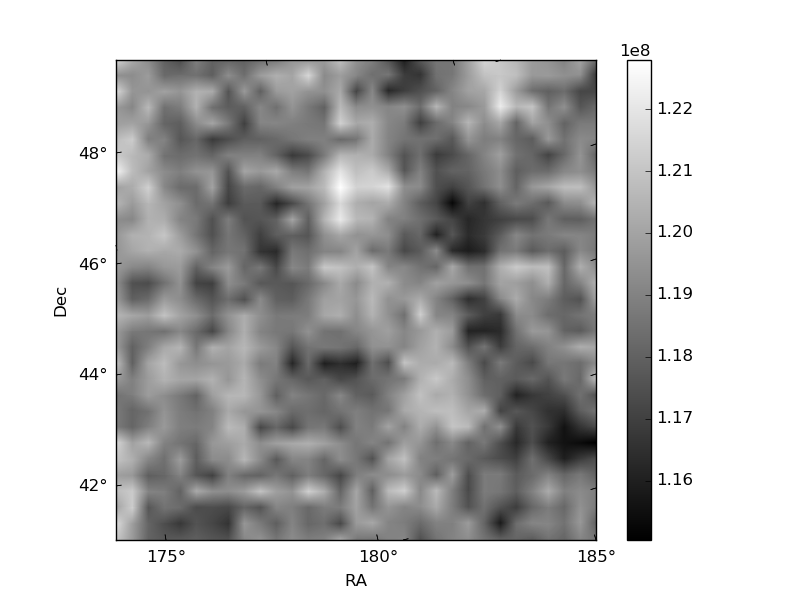
Quadrant B |
|---|---|---|---|
| Quadrant D | 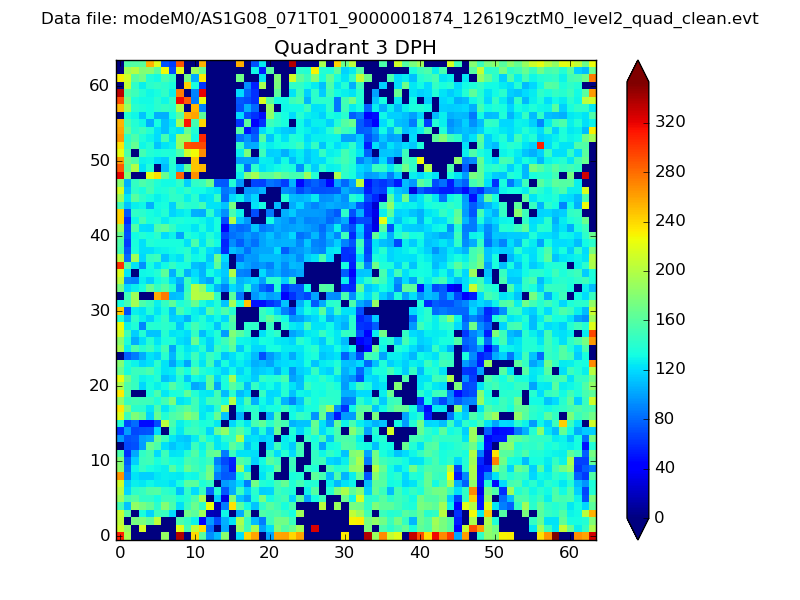 |
 |
Quadrant C |
| Plot type | Count rate plots | Images |
|---|---|---|
| Comparison with Poisson distribution Blue bars denote a histogram of data divided into 1 sec bins. Red curve is a Poisson curve with rate = median count rate of data. |
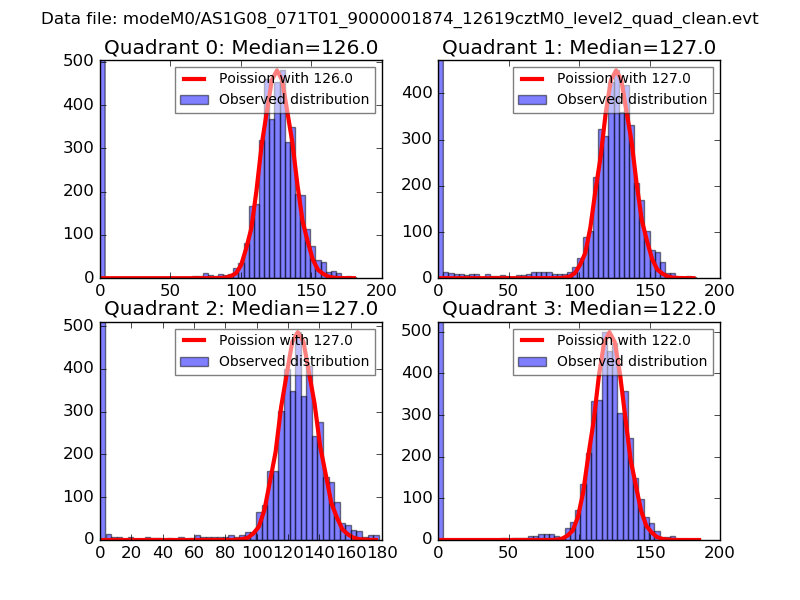 |
 |
| Quadrant-wise count rates Data is divided into 100 sec bins |
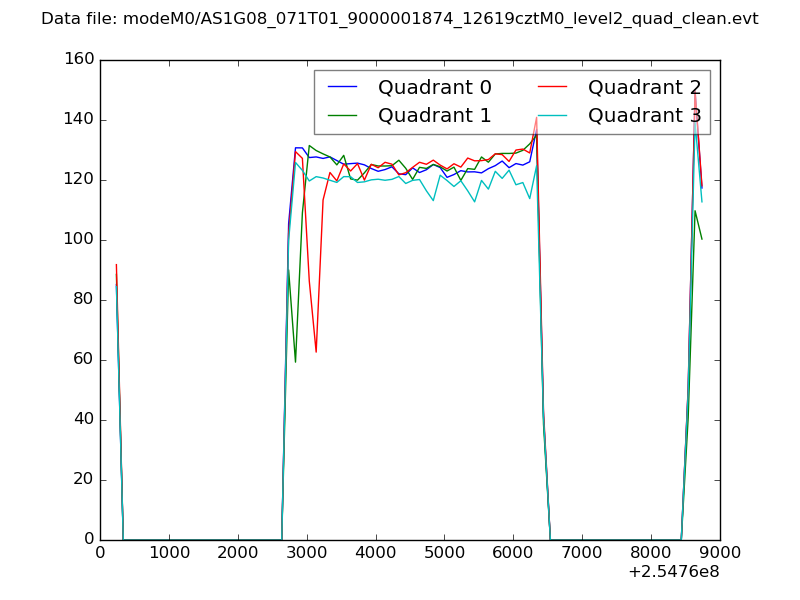 |
|
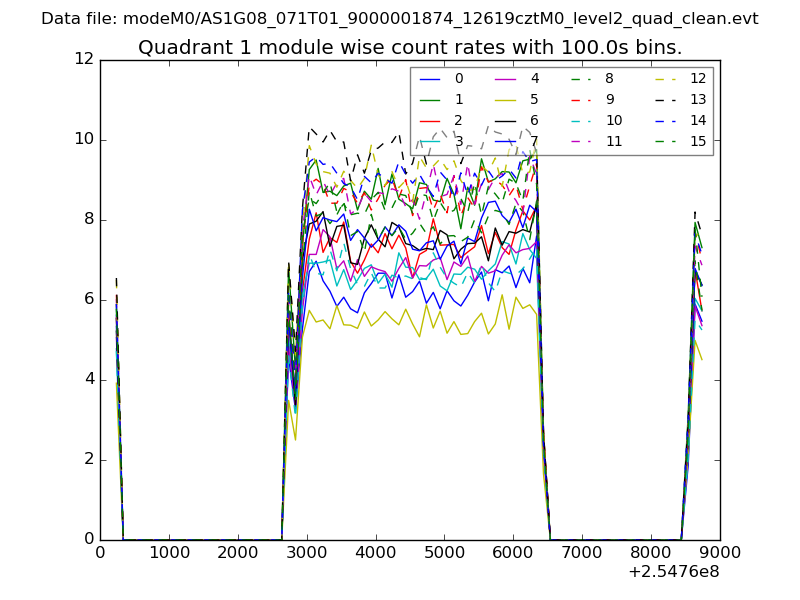
| Module-wise count rates for Quadrant A Data is divided into 100 sec bins |
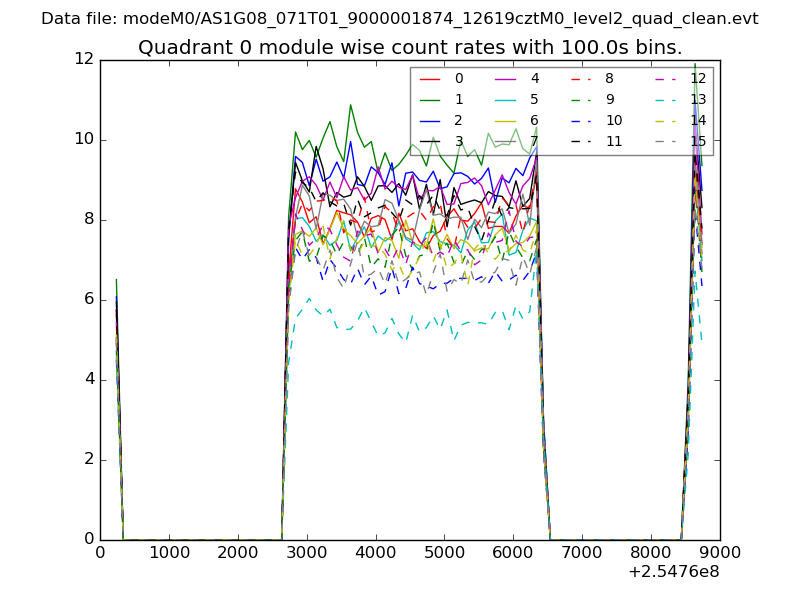 |
 |
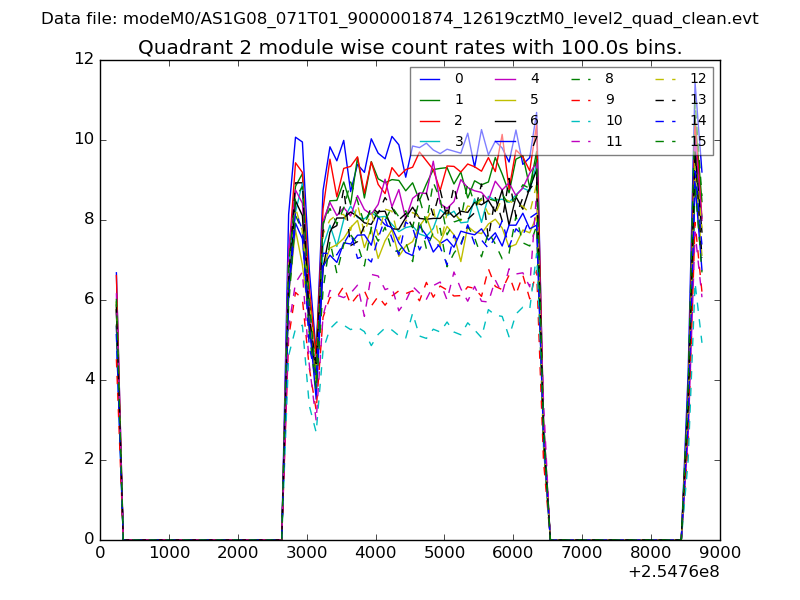
| Module-wise count rates for Quadrant B Data is divided into 100 sec bins |
 |
 |
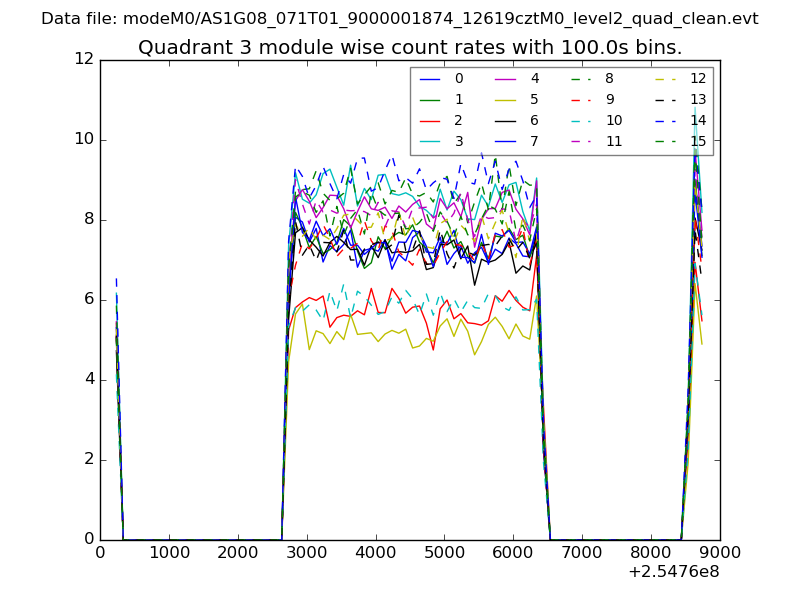
| Module-wise count rates for Quadrant C Data is divided into 100 sec bins |
 |
 |
| Module-wise count rates for Quadrant D Data is divided into 100 sec bins |
 |
 |
| Parameter | Plot |
|---|---|
| CZT HV Monitor | 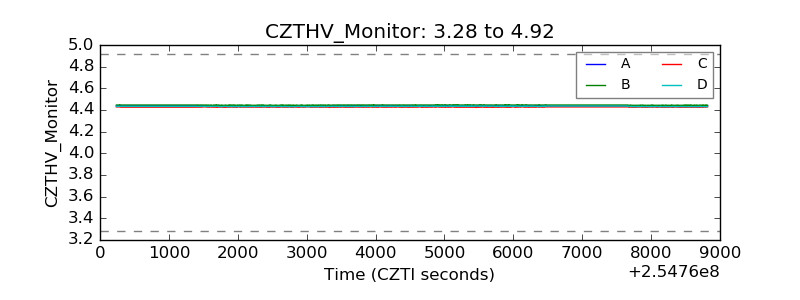 |
| D_VDD |  |
| Temperature 1 | 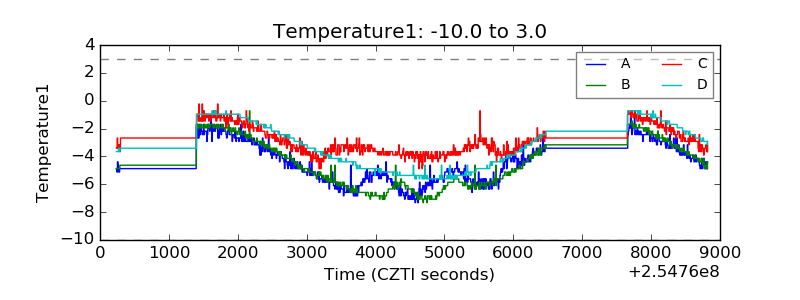 |
| Veto HV Monitor | 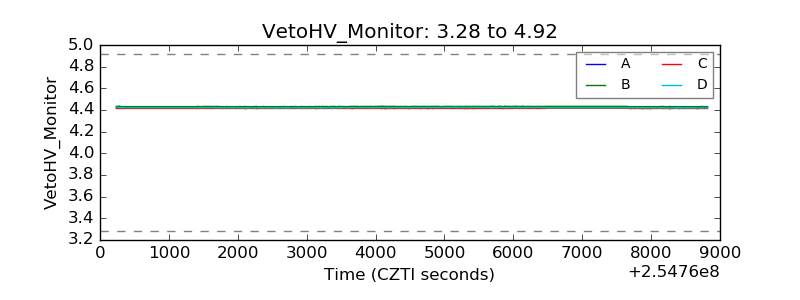 |
| Veto LLD | 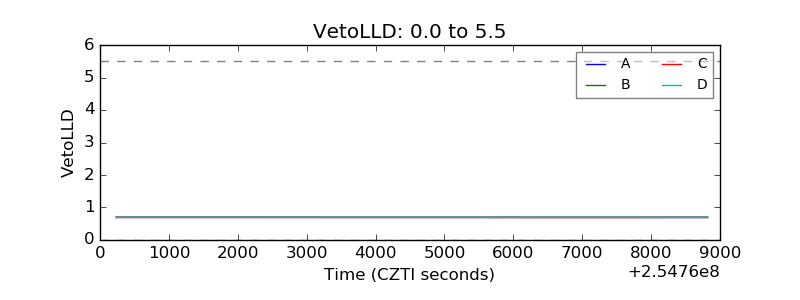 |
| Alpha Counter | 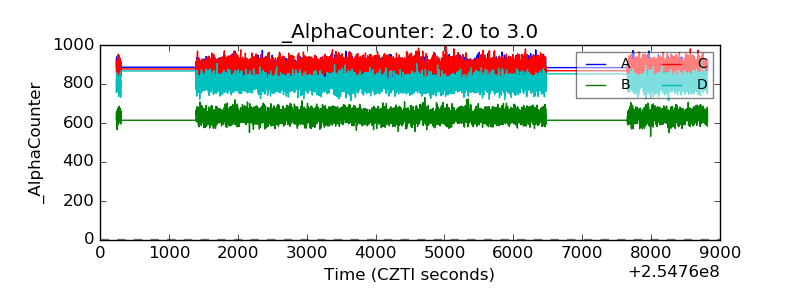 |
| _CPM_Rate | 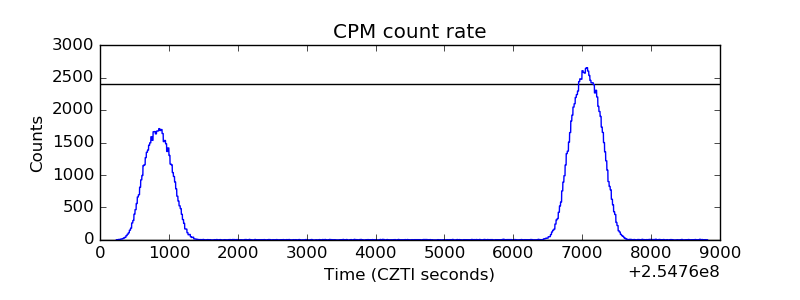 |
| CZT Counter | 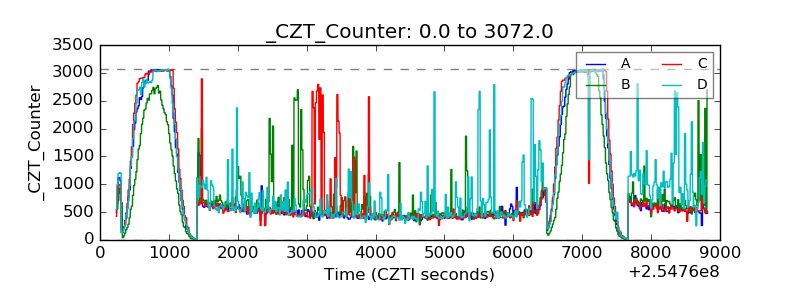 |
| +2.5 Volts monitor |  |
| +5 Volts monitor |  |
| _ROLL_ROT | 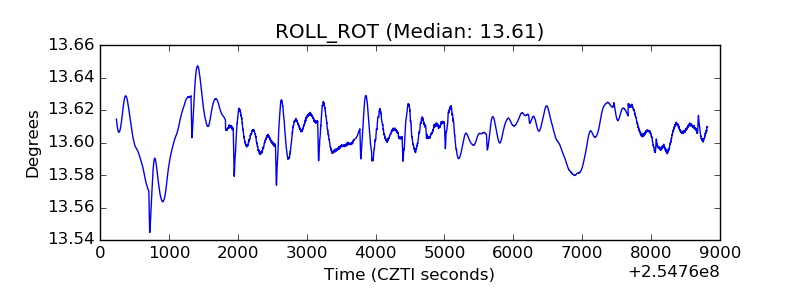 |
| _Roll_DEC | 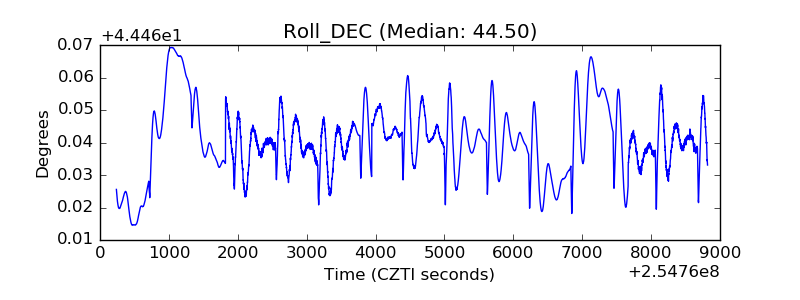 |
| _Roll_RA | 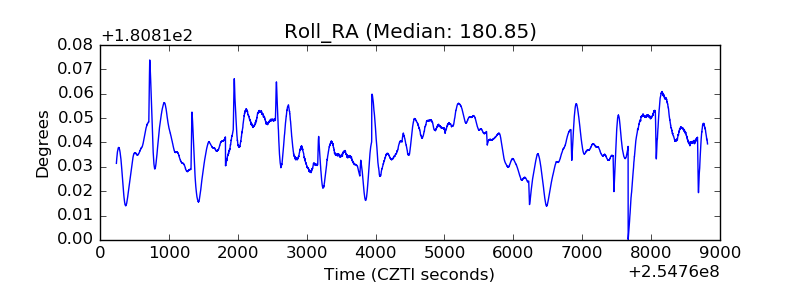 |
| Veto Counter | 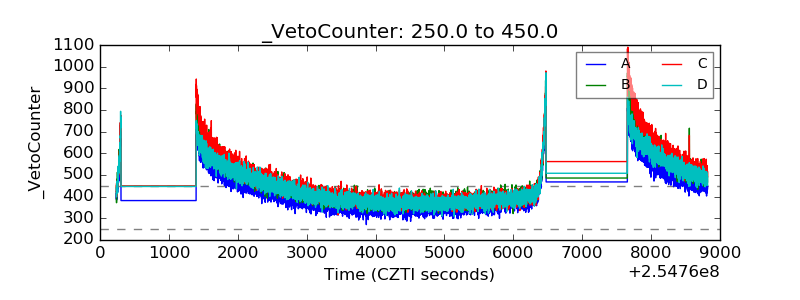 |