| Param | Original file | Final file |
|---|---|---|
| Filename | modeM0/AS1G08_071T01_9000001874_12621cztM0_level2.evt | modeM0/AS1G08_071T01_9000001874_12621cztM0_level2_quad_clean.evt |
| Size (bytes) | 501,840,000 | 102,312,000 |
| Size | 478.6 MB | 97.6 MB |
| Events in quadrant A | 2,972,756 | 675,965 |
| Events in quadrant B | 3,910,943 | 665,931 |
| Events in quadrant C | 3,006,469 | 695,453 |
| Events in quadrant D | 4,900,536 | 641,400 |
| Mode SS | |||
|---|---|---|---|
| Quadrant | BADHDUFLAG | Total packets | Discarded packets |
| A | 0 | 124 | 0 |
| B | 0 | 124 | 0 |
| C | 0 | 124 | 0 |
| D | 0 | 124 | 0 |
| Mode M0 | |||
|---|---|---|---|
| Quadrant | BADHDUFLAG | Total packets | Discarded packets |
| A | 0 | 12773 | 2 |
| B | 0 | 15711 | 1 |
| C | 0 | 12841 | 1 |
| D | 0 | 18742 | 1 |
| Mode M9 | |||
|---|---|---|---|
| Quadrant | BADHDUFLAG | Total packets | Discarded packets |
| A | 0 | 13 | 0 |
| B | 0 | 13 | 0 |
| C | 0 | 13 | 0 |
| D | 0 | 13 | 0 |
| Quadrant | Total seconds | Saturated seconds | Saturation percentage |
|---|---|---|---|
| A | 6004 | 62 | 1.032645% |
| B | 6004 | 381 | 6.345769% |
| C | 6004 | 55 | 0.916056% |
| D | 6004 | 221 | 3.680879% |
Noise dominated data is calculated using 1-second bins in cleaned event files. If a bin has >2000 counts, and if more than 50% of those come from <1% of pixels, then it is considered to be noise-dominated and hence unusable.
| Quadrant | # 1 sec bins | Bins with >0 counts | Bins with >2000 counts | High rate bins dominated by noise | Noise dominated (total time) | Noise dominated (detector-on time) | Marked lightcurve |
|---|---|---|---|---|---|---|---|
| A | 7340 | 6005 | 0 | 0 | 0.00% | 0.00% | 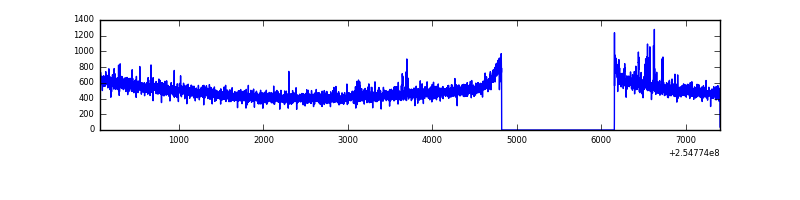 |
| B | 7340 | 6005 | 233 | 233 | 3.17% | 3.88% | 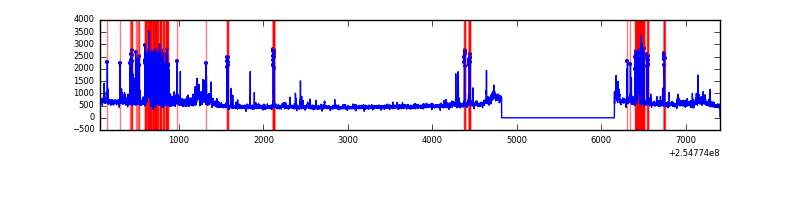 |
| C | 7340 | 6005 | 0 | 0 | 0.00% | 0.00% | 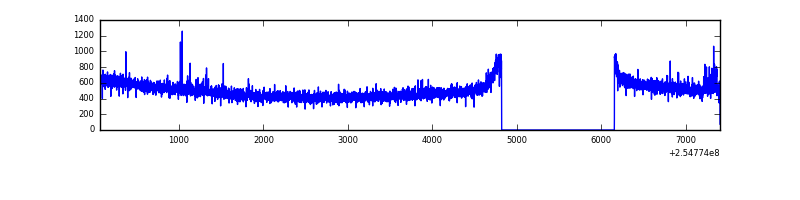 |
| D | 7340 | 6005 | 166 | 166 | 2.26% | 2.76% |  |
Top three noisy pixels from each quadrant. If the there are fewer than three noisy pixels in the level2.evt file, extra rows are filled as -1
| Pixel properties | Quadrant properties | ||||||
|---|---|---|---|---|---|---|---|
| Quadrant | DetID | PixID | Counts | Sigma | Mean | Median | Sigma |
| A | 3 | 1 | 33631 | 213.33 | 763 | 746 | 154.1 |
| A | 12 | 189 | 8320 | 49.13 | 763 | 746 | 154.1 |
| A | 0 | 226 | 6932 | 40.13 | 763 | 746 | 154.1 |
| B | 4 | 239 | 744011 | 5322.0 | 747 | 731 | 139.7 |
| B | 0 | 85 | 99138 | 704.61 | 747 | 731 | 139.7 |
| B | 11 | 51 | 82354 | 584.43 | 747 | 731 | 139.7 |
| C | 15 | 208 | 25437 | 141.53 | 763 | 767 | 174.3 |
| C | 13 | 61 | 5537 | 27.37 | 763 | 767 | 174.3 |
| C | 12 | 4 | 5247 | 25.7 | 763 | 767 | 174.3 |
| D | 10 | 157 | 1138370 | 6446.73 | 741 | 721 | 176.5 |
| D | 1 | 52 | 687575 | 3892.2 | 741 | 721 | 176.5 |
| D | 1 | 255 | 123360 | 694.96 | 741 | 721 | 176.5 |
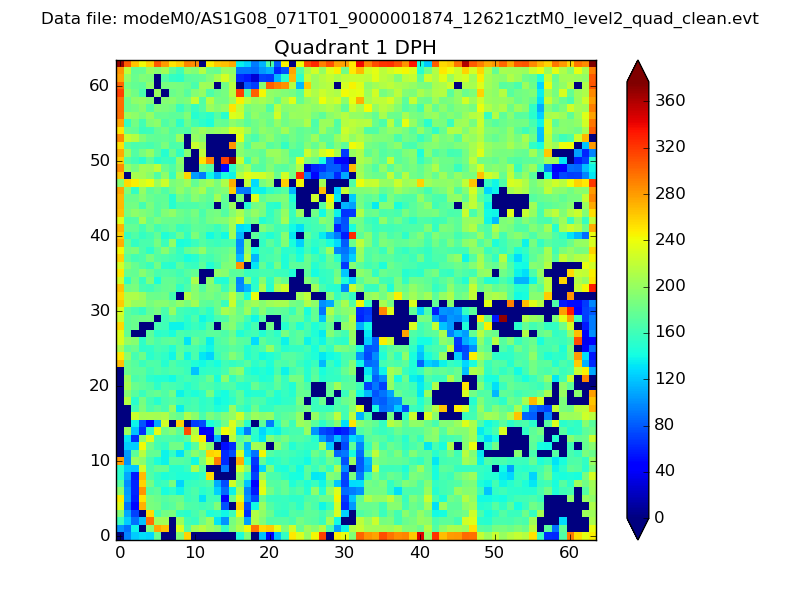
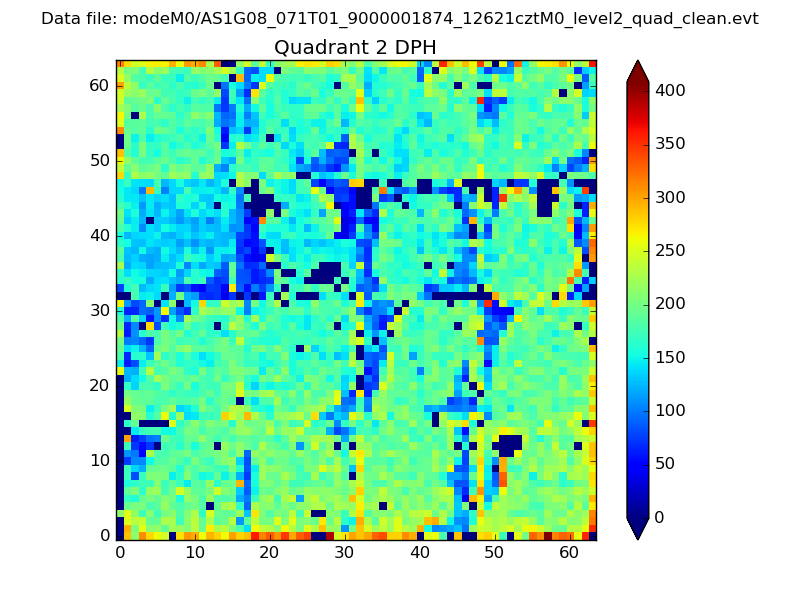
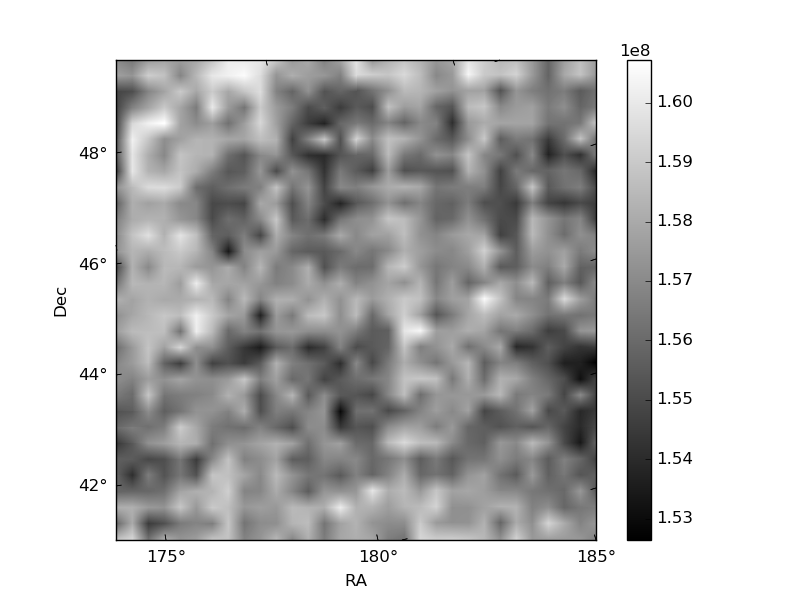
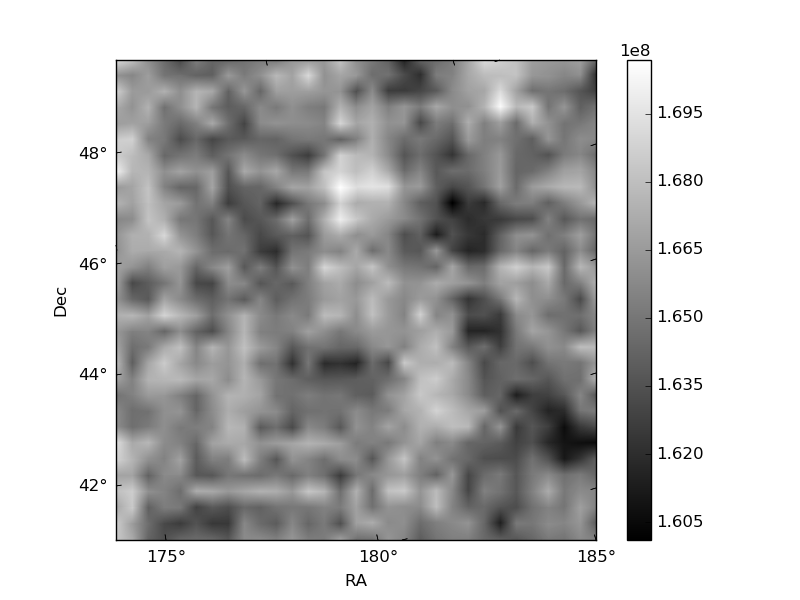
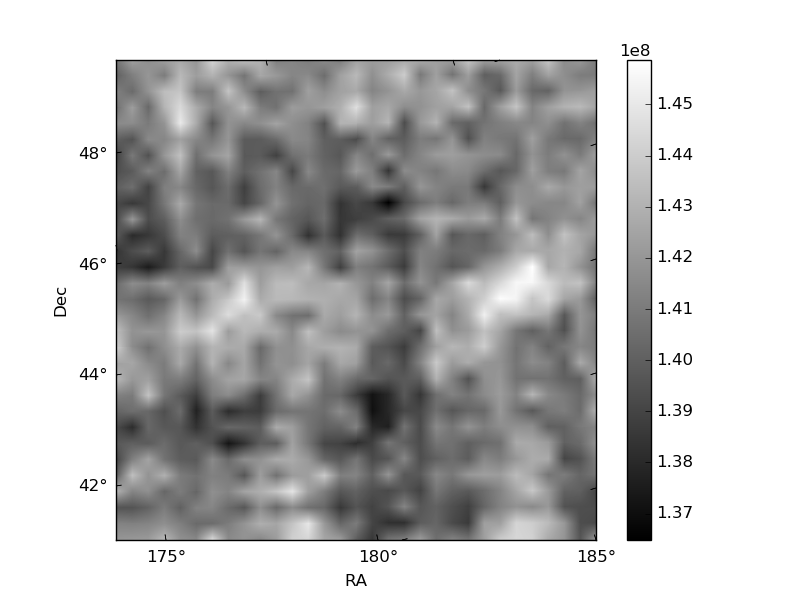
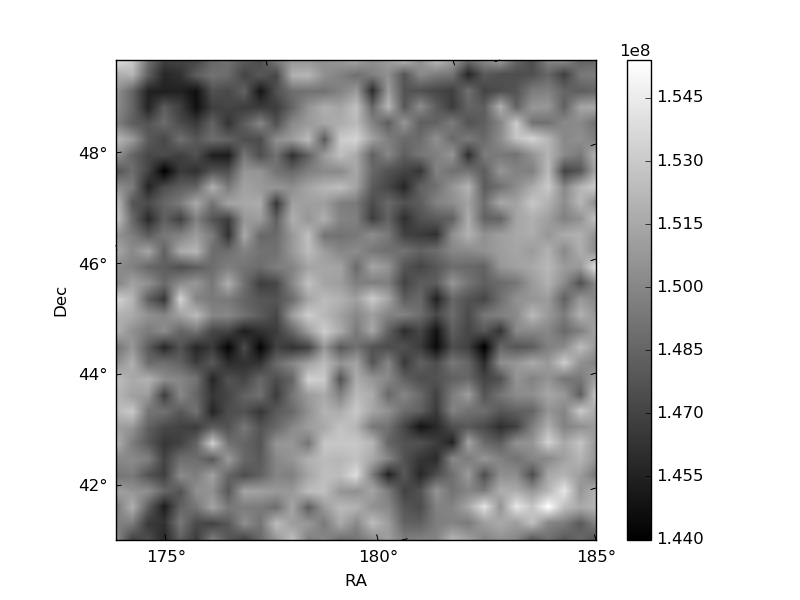
Histogram calculated using DETX and DETY for each event in the final _common_clean file
| Quadrant A | 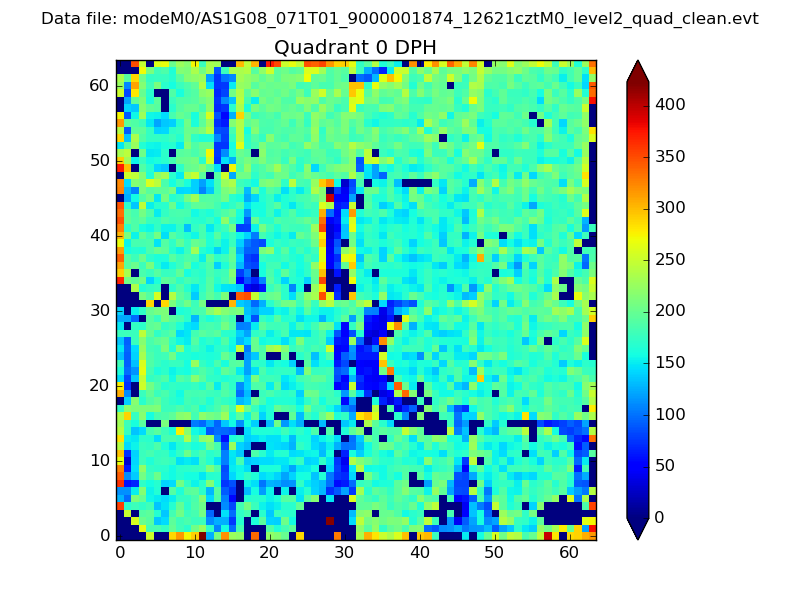 |
 |
Quadrant B |
|---|---|---|---|
| Quadrant D | 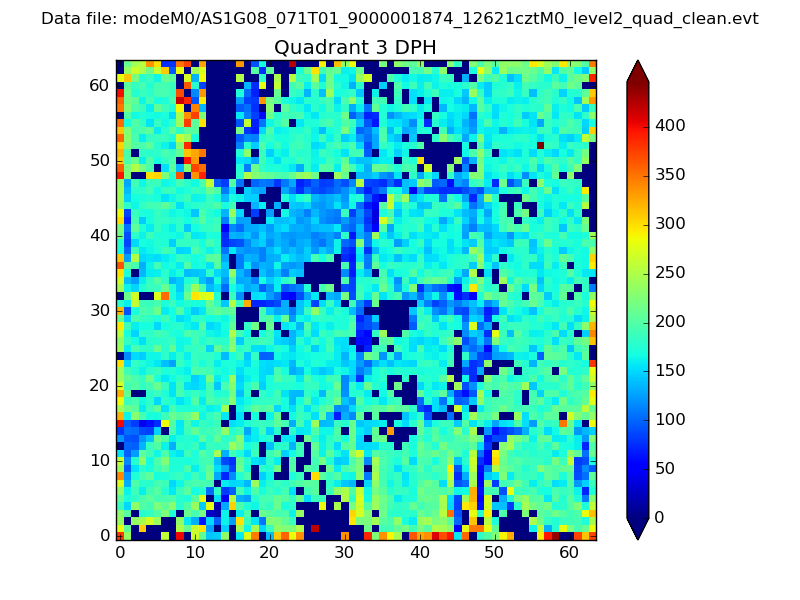 |
 |
Quadrant C |
| Plot type | Count rate plots | Images |
|---|---|---|
| Comparison with Poisson distribution Blue bars denote a histogram of data divided into 1 sec bins. Red curve is a Poisson curve with rate = median count rate of data. |
 |
 |
| Quadrant-wise count rates Data is divided into 100 sec bins |
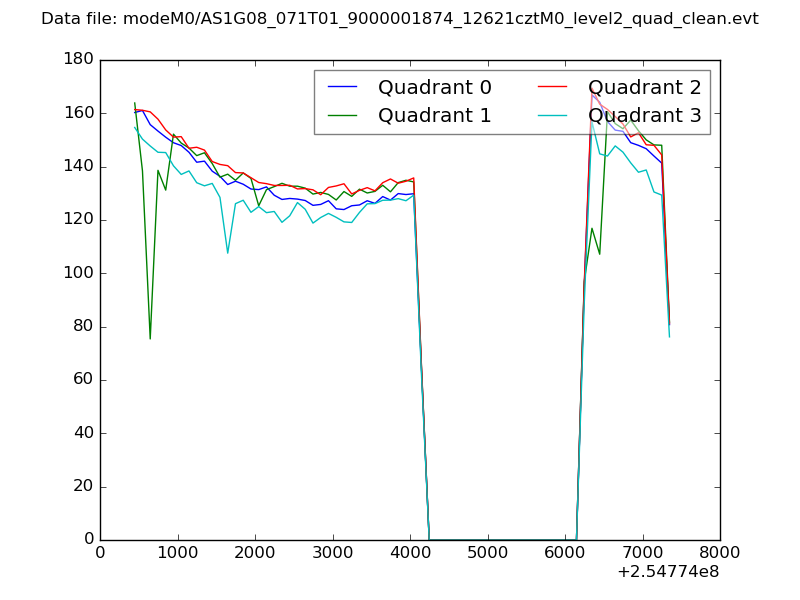 |
|
| Module-wise count rates for Quadrant A Data is divided into 100 sec bins |
 |
 |
| Module-wise count rates for Quadrant B Data is divided into 100 sec bins |
 |
 |
| Module-wise count rates for Quadrant C Data is divided into 100 sec bins |
 |
 |
| Module-wise count rates for Quadrant D Data is divided into 100 sec bins |
 |
 |
| Parameter | Plot |
|---|---|
| CZT HV Monitor |  |
| D_VDD | 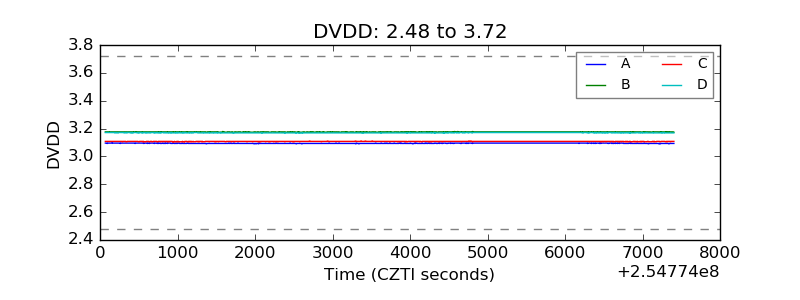 |
| Temperature 1 | 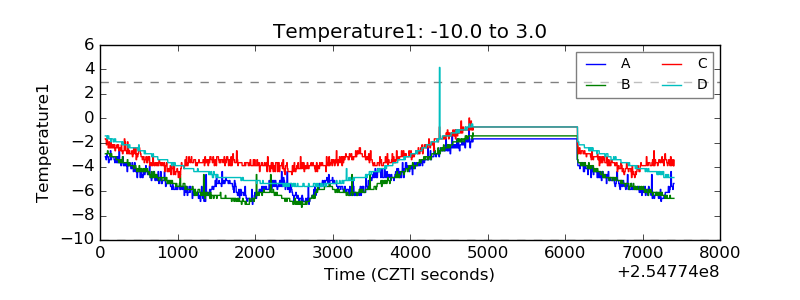 |
| Veto HV Monitor | 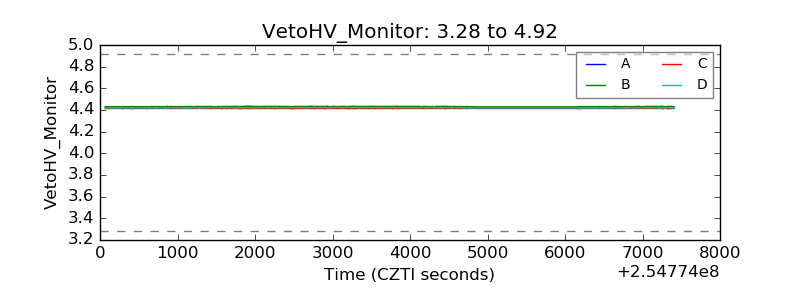 |
| Veto LLD |  |
| Alpha Counter | 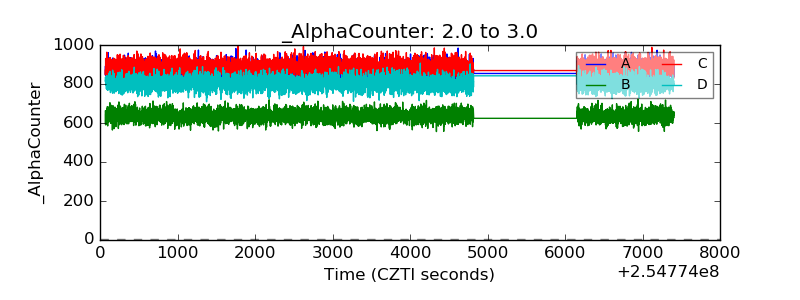 |
| _CPM_Rate | 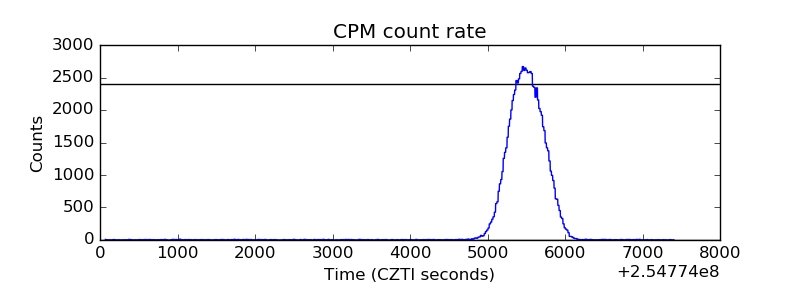 |
| CZT Counter | 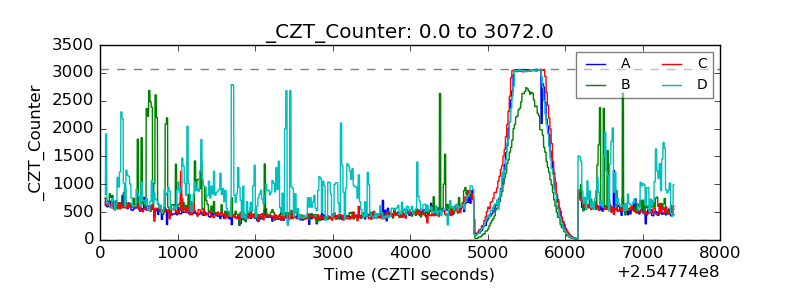 |
| +2.5 Volts monitor |  |
| +5 Volts monitor | 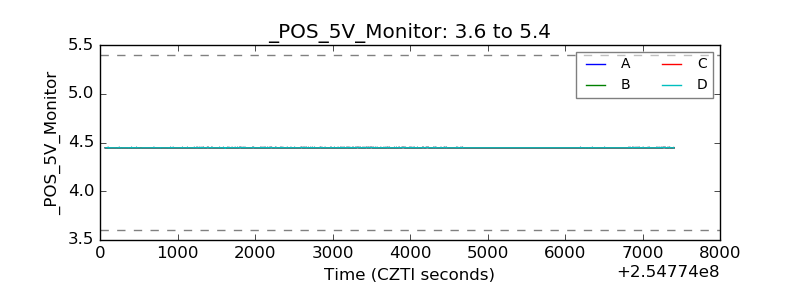 |
| _ROLL_ROT |  |
| _Roll_DEC | 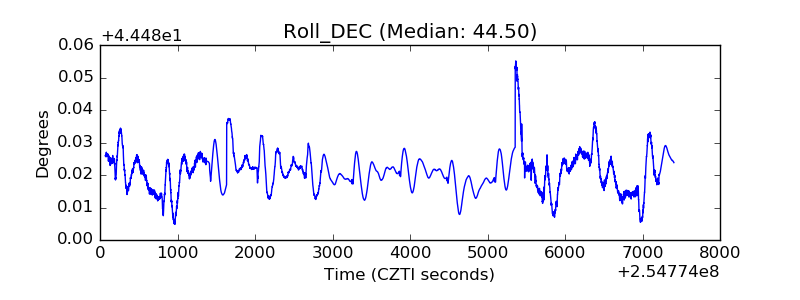 |
| _Roll_RA | 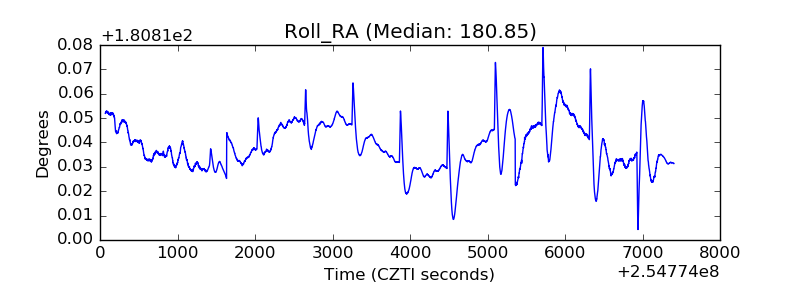 |
| Veto Counter |  |