| Param | Original file | Final file |
|---|---|---|
| Filename | modeM0/AS1G08_071T01_9000001874_12622cztM0_level2.evt | modeM0/AS1G08_071T01_9000001874_12622cztM0_level2_quad_clean.evt |
| Size (bytes) | 506,269,440 | 103,294,080 |
| Size | 482.8 MB | 98.5 MB |
| Events in quadrant A | 3,071,612 | 676,107 |
| Events in quadrant B | 3,636,243 | 685,363 |
| Events in quadrant C | 3,153,045 | 694,857 |
| Events in quadrant D | 5,051,206 | 639,304 |
| Mode SS | |||
|---|---|---|---|
| Quadrant | BADHDUFLAG | Total packets | Discarded packets |
| A | 0 | 128 | 0 |
| B | 0 | 128 | 0 |
| C | 0 | 128 | 0 |
| D | 0 | 128 | 0 |
| Mode M0 | |||
|---|---|---|---|
| Quadrant | BADHDUFLAG | Total packets | Discarded packets |
| A | 0 | 13205 | 3 |
| B | 0 | 14909 | 2 |
| C | 0 | 13474 | 2 |
| D | 0 | 19401 | 2 |
| Mode M9 | |||
|---|---|---|---|
| Quadrant | BADHDUFLAG | Total packets | Discarded packets |
| A | 0 | 27 | 0 |
| B | 0 | 27 | 0 |
| C | 0 | 27 | 0 |
| D | 0 | 27 | 0 |
| Quadrant | Total seconds | Saturated seconds | Saturation percentage |
|---|---|---|---|
| A | 6197 | 89 | 1.436179% |
| B | 6197 | 304 | 4.905599% |
| C | 6197 | 95 | 1.533000% |
| D | 6197 | 180 | 2.904631% |
Noise dominated data is calculated using 1-second bins in cleaned event files. If a bin has >2000 counts, and if more than 50% of those come from <1% of pixels, then it is considered to be noise-dominated and hence unusable.
| Quadrant | # 1 sec bins | Bins with >0 counts | Bins with >2000 counts | High rate bins dominated by noise | Noise dominated (total time) | Noise dominated (detector-on time) | Marked lightcurve |
|---|---|---|---|---|---|---|---|
| A | 8858 | 6198 | 0 | 0 | 0.00% | 0.00% | 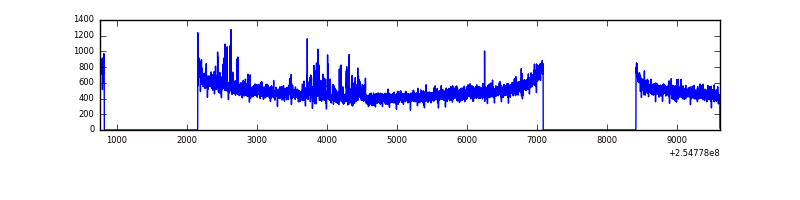 |
| B | 8858 | 6198 | 113 | 113 | 1.28% | 1.82% | 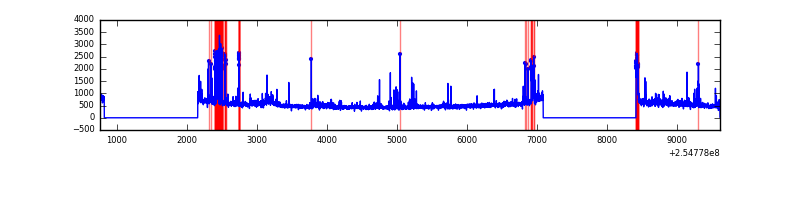 |
| C | 8858 | 6199 | 4 | 4 | 0.05% | 0.06% | 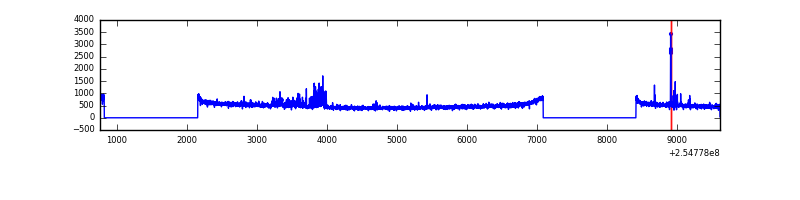 |
| D | 8858 | 6198 | 55 | 55 | 0.62% | 0.89% | 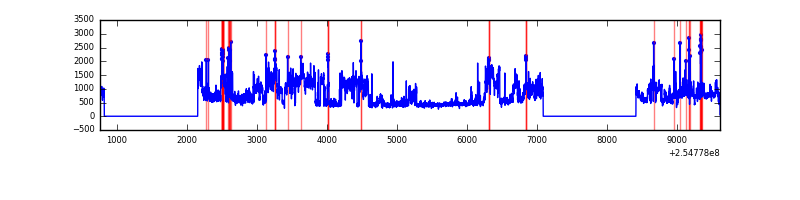 |
Top three noisy pixels from each quadrant. If the there are fewer than three noisy pixels in the level2.evt file, extra rows are filled as -1
| Pixel properties | Quadrant properties | ||||||
|---|---|---|---|---|---|---|---|
| Quadrant | DetID | PixID | Counts | Sigma | Mean | Median | Sigma |
| A | 3 | 1 | 84227 | 531.68 | 775 | 758 | 157.0 |
| A | 12 | 189 | 12058 | 71.98 | 775 | 758 | 157.0 |
| A | 0 | 226 | 7118 | 40.51 | 775 | 758 | 157.0 |
| B | 4 | 239 | 357452 | 2467.98 | 771 | 753 | 144.5 |
| B | 11 | 51 | 97499 | 669.38 | 771 | 753 | 144.5 |
| B | 0 | 85 | 71689 | 490.8 | 771 | 753 | 144.5 |
| C | 15 | 208 | 127782 | 715.85 | 773 | 779 | 177.4 |
| C | 12 | 4 | 9069 | 46.73 | 773 | 779 | 177.4 |
| C | 13 | 61 | 5677 | 27.61 | 773 | 779 | 177.4 |
| D | 10 | 157 | 1563036 | 8593.74 | 753 | 731 | 181.8 |
| D | 1 | 52 | 324147 | 1779.01 | 753 | 731 | 181.8 |
| D | 1 | 255 | 164150 | 898.92 | 753 | 731 | 181.8 |
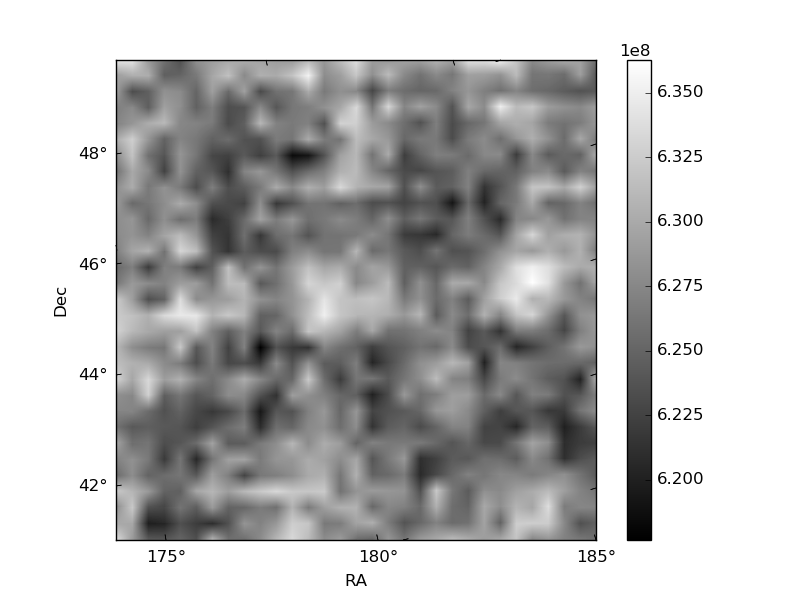
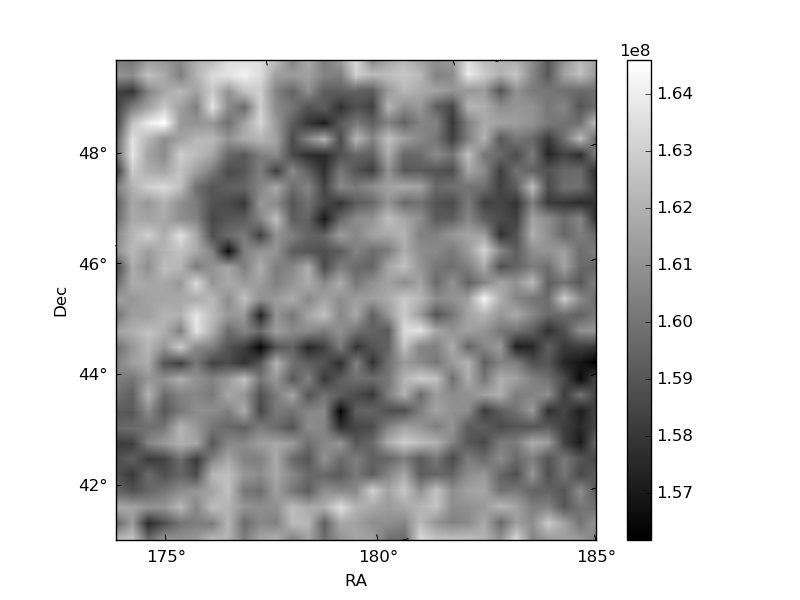
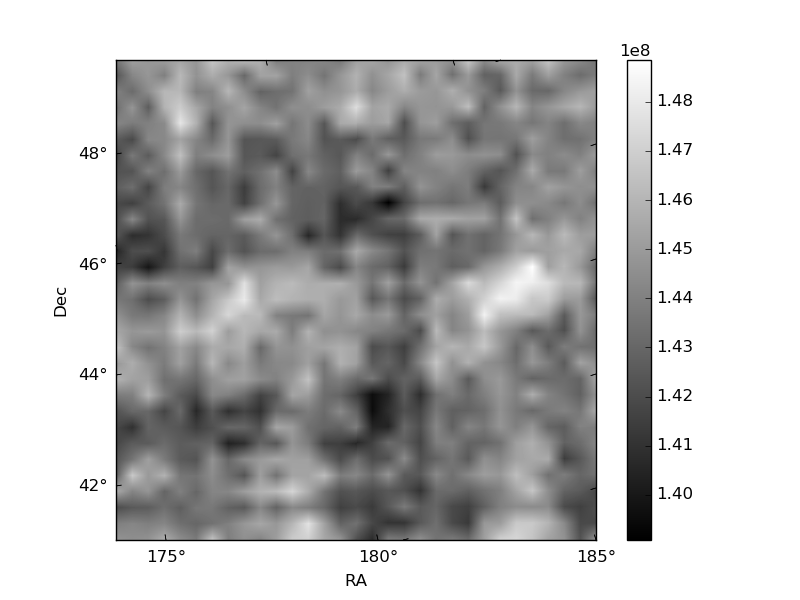
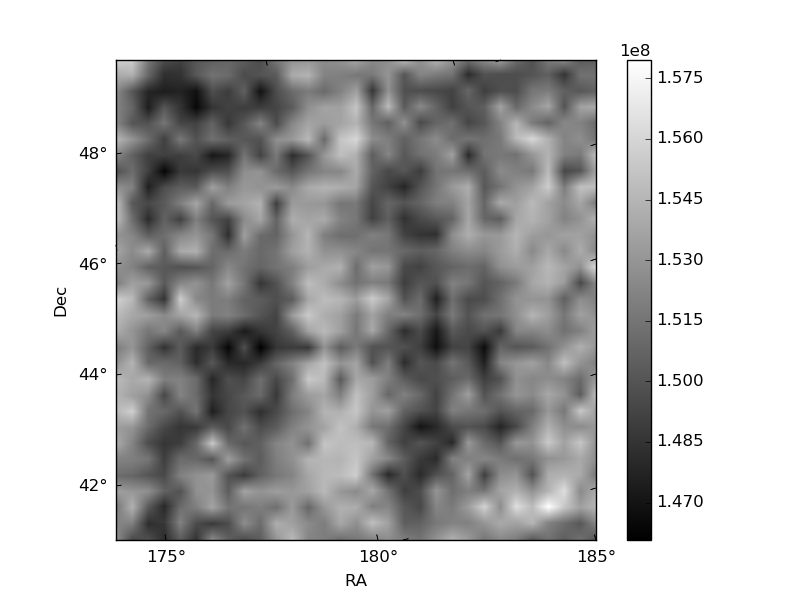
Histogram calculated using DETX and DETY for each event in the final _common_clean file
| Quadrant A | 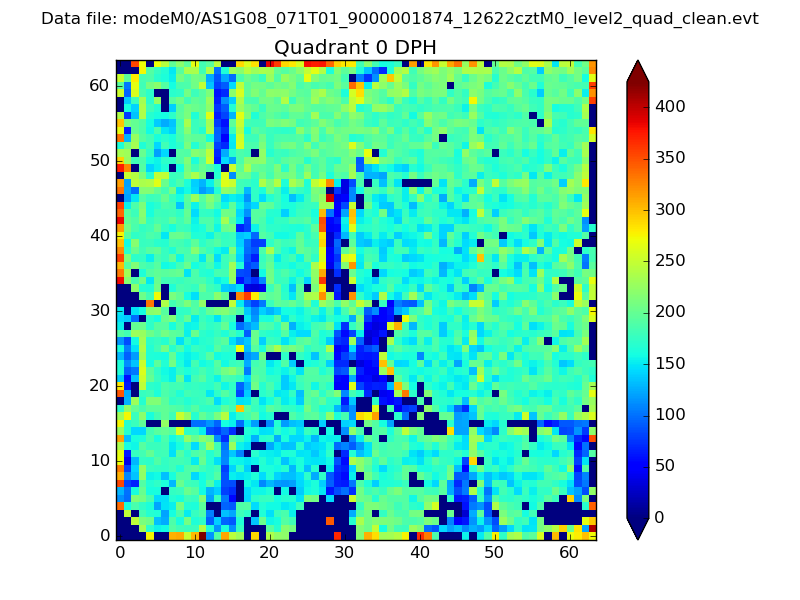 |
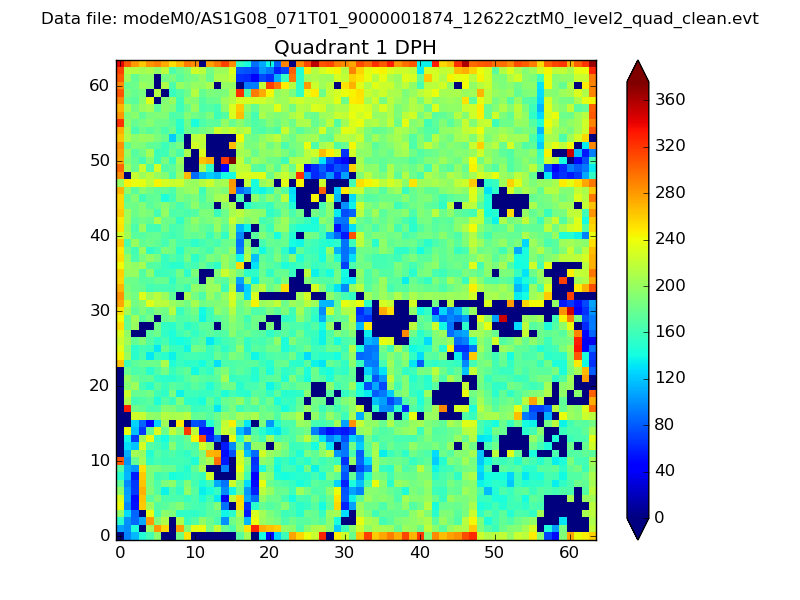 |
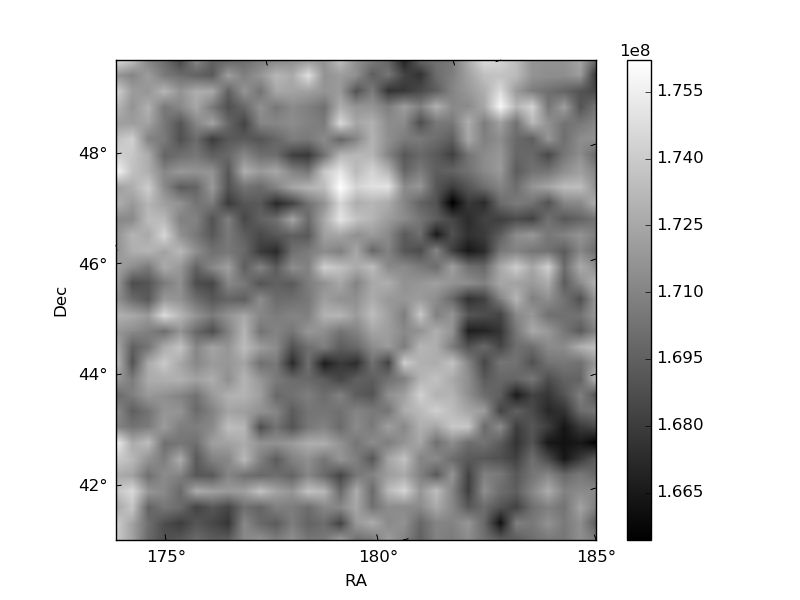
Quadrant B |
|---|---|---|---|
| Quadrant D | 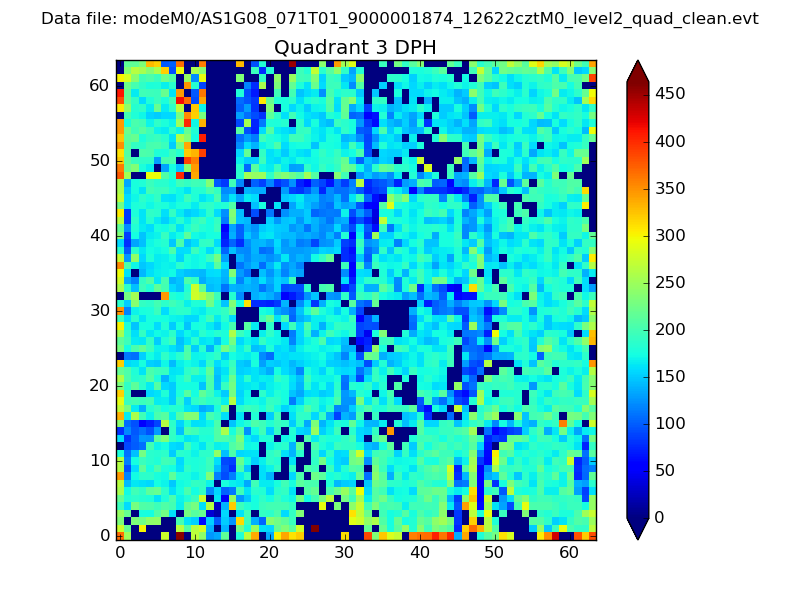 |
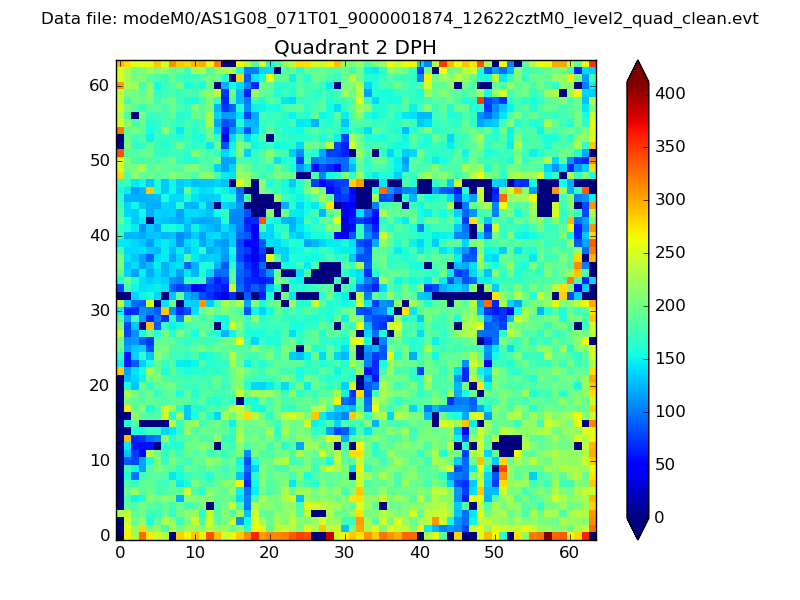 |
Quadrant C |
| Plot type | Count rate plots | Images |
|---|---|---|
| Comparison with Poisson distribution Blue bars denote a histogram of data divided into 1 sec bins. Red curve is a Poisson curve with rate = median count rate of data. |
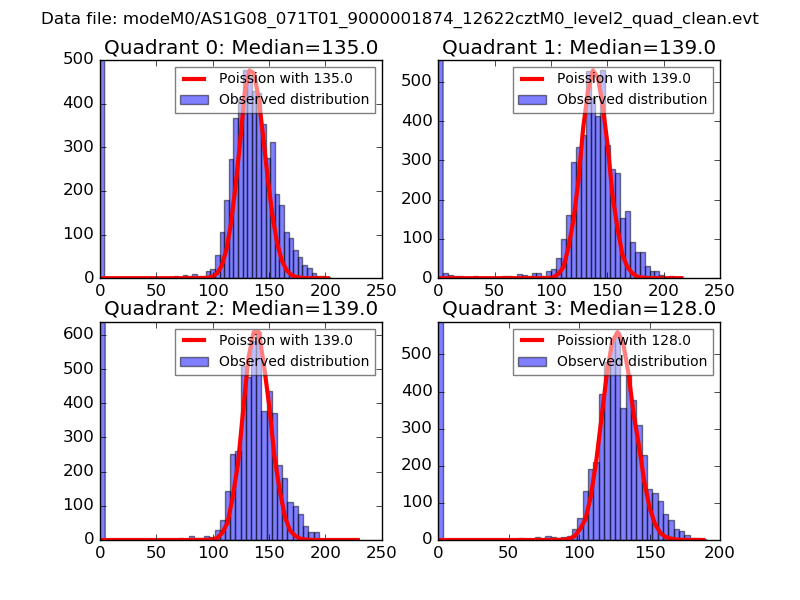 |
 |
| Quadrant-wise count rates Data is divided into 100 sec bins |
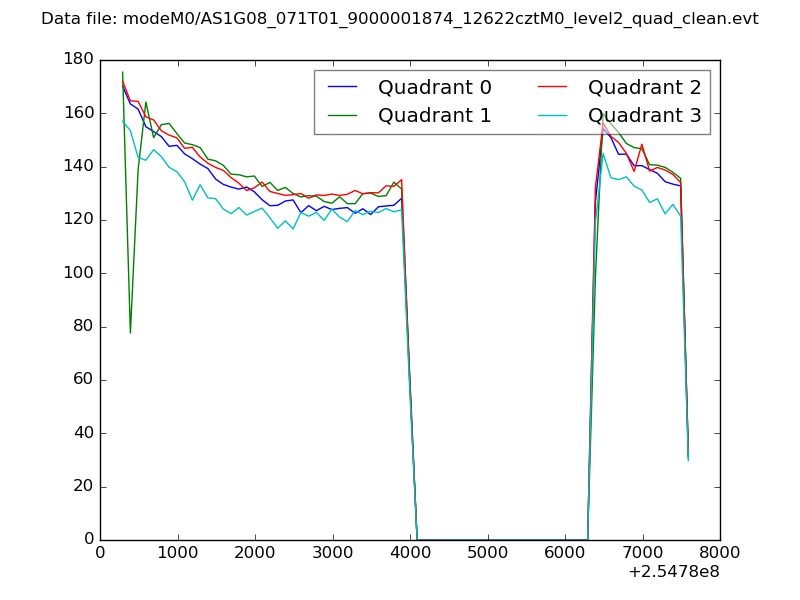 |
|
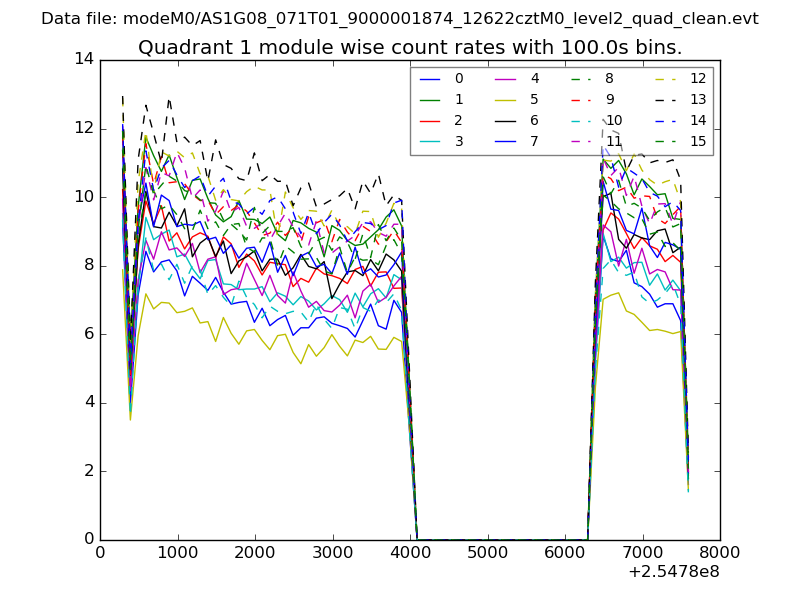
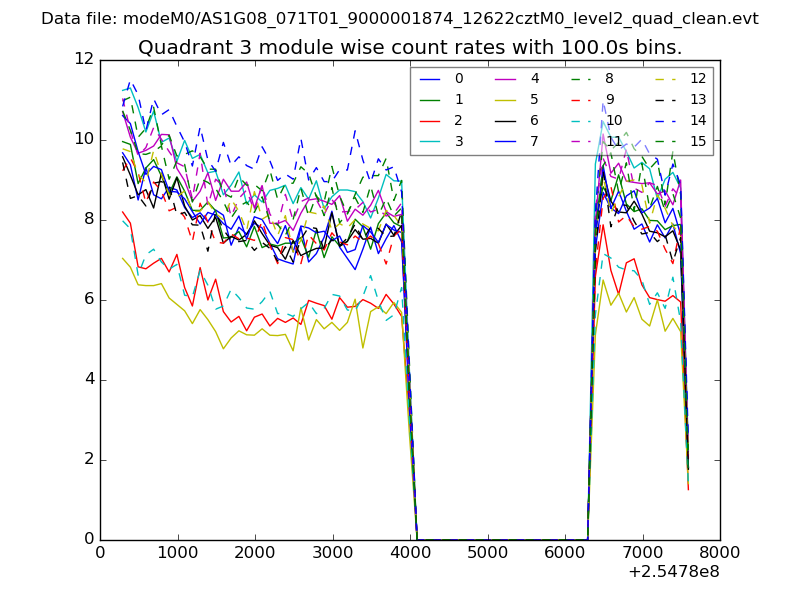
| Module-wise count rates for Quadrant A Data is divided into 100 sec bins |
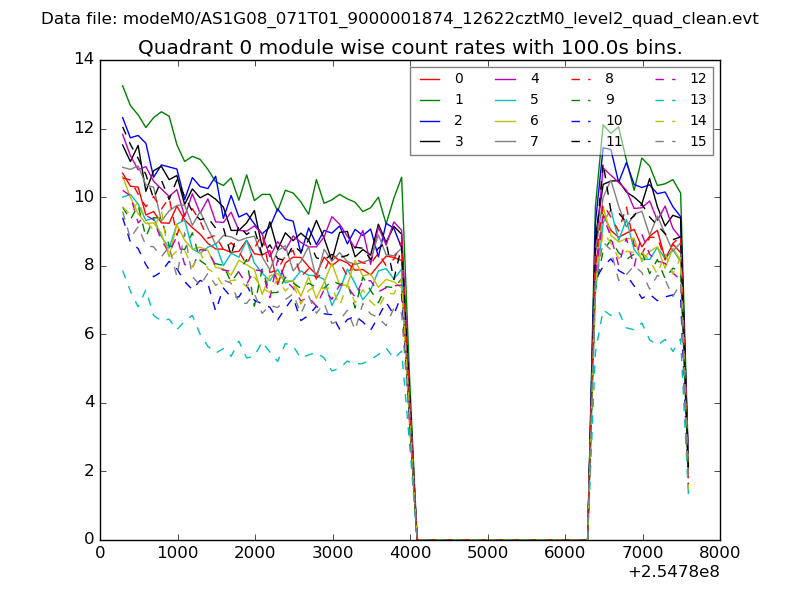 |
 |
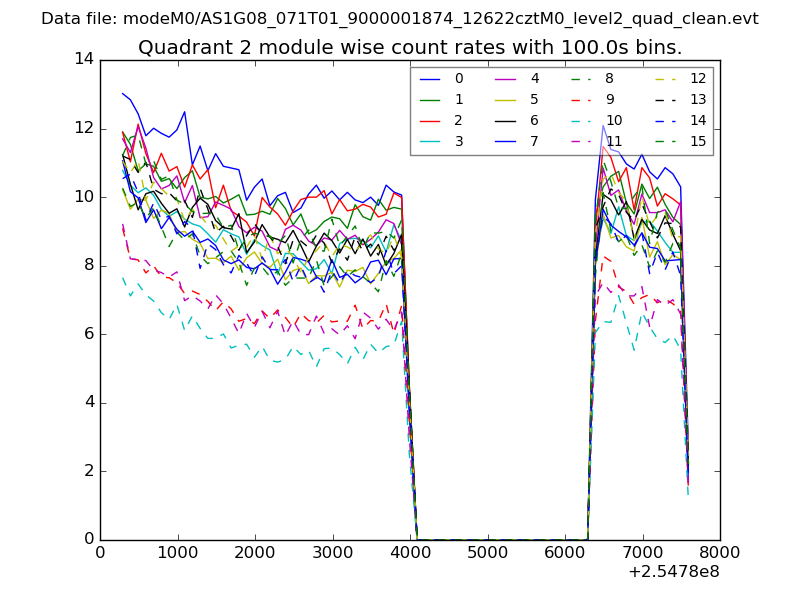
| Module-wise count rates for Quadrant B Data is divided into 100 sec bins |
 |
 |
| Module-wise count rates for Quadrant C Data is divided into 100 sec bins |
 |
 |
| Module-wise count rates for Quadrant D Data is divided into 100 sec bins |
 |
 |
| Parameter | Plot |
|---|---|
| CZT HV Monitor | 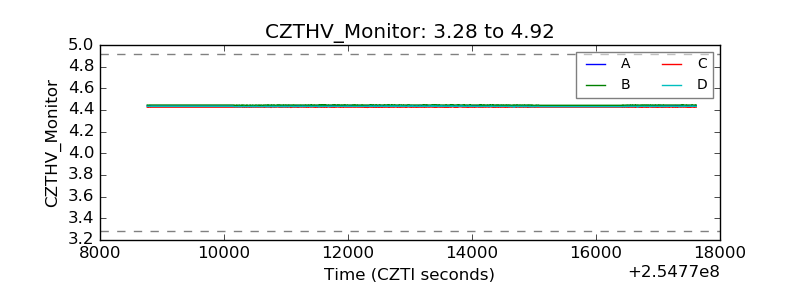 |
| D_VDD |  |
| Temperature 1 | 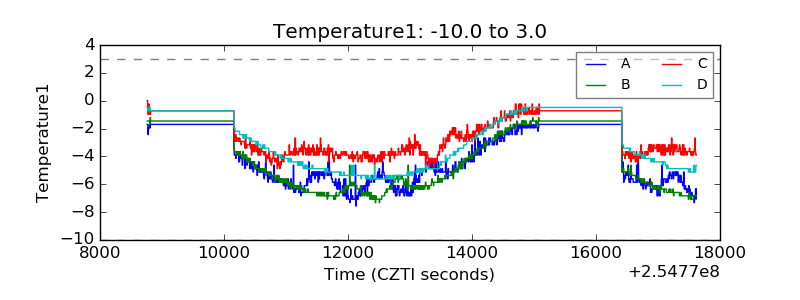 |
| Veto HV Monitor | 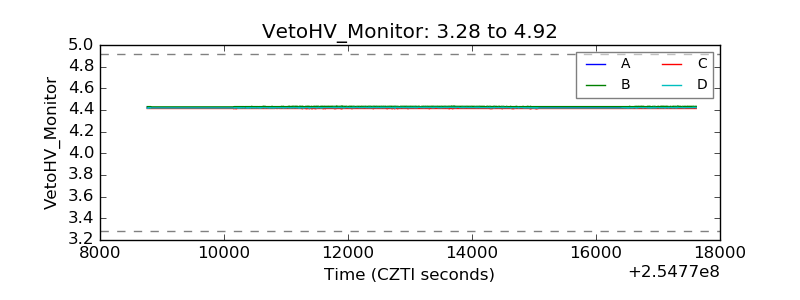 |
| Veto LLD |  |
| Alpha Counter | 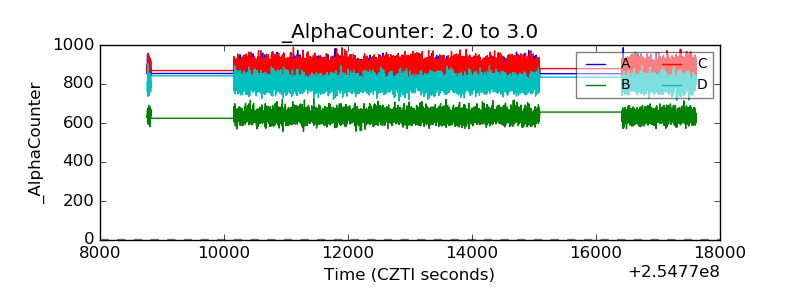 |
| _CPM_Rate | 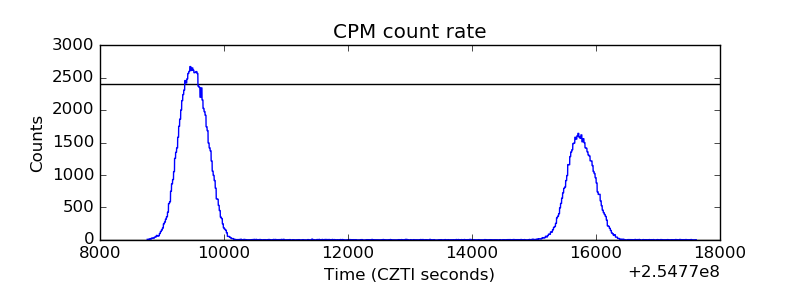 |
| CZT Counter | 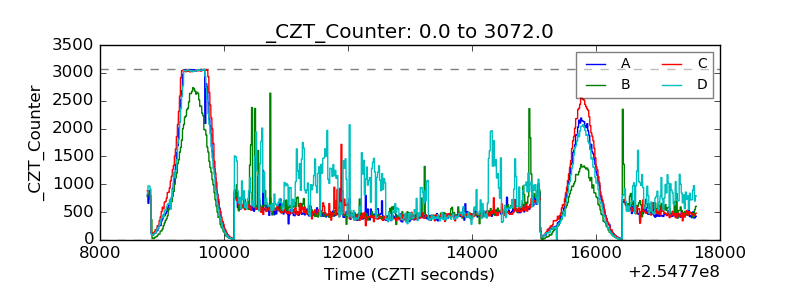 |
| +2.5 Volts monitor | 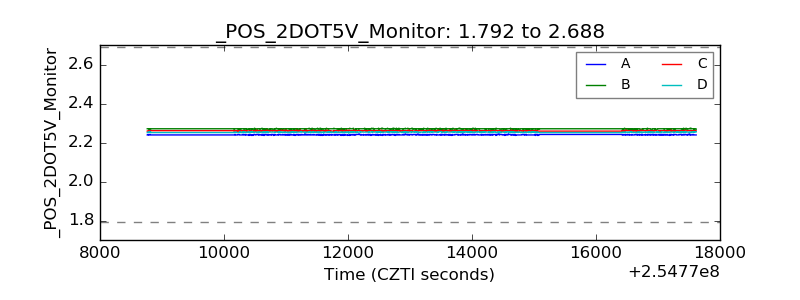 |
| +5 Volts monitor |  |
| _ROLL_ROT | 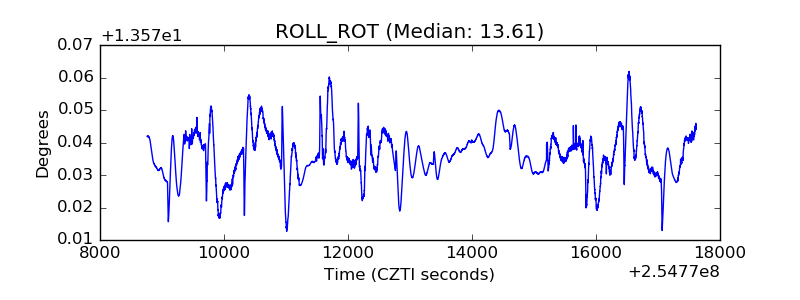 |
| _Roll_DEC | 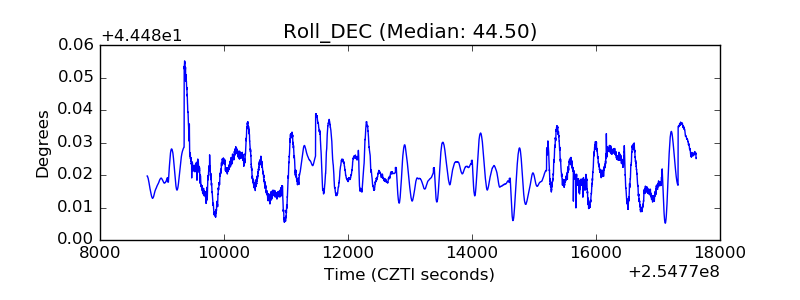 |
| _Roll_RA | 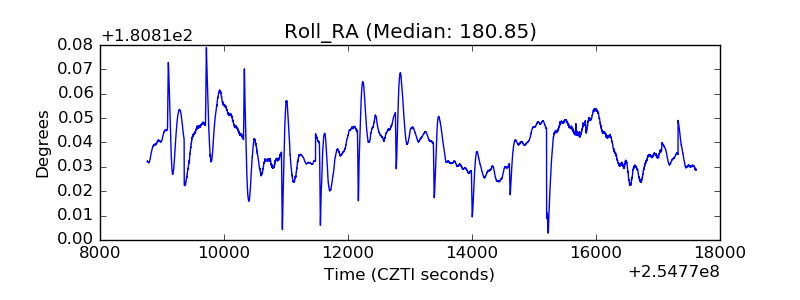 |
| Veto Counter | 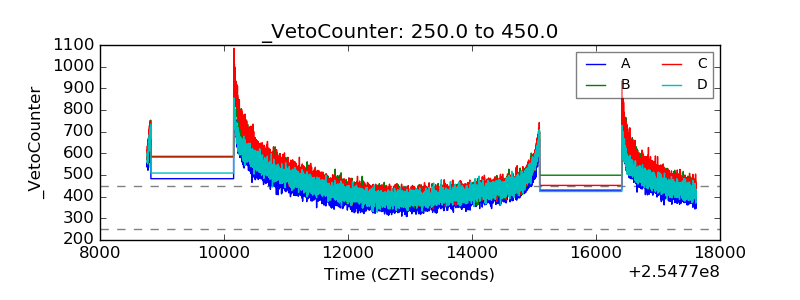 |