| Param | Original file | Final file |
|---|---|---|
| Filename | modeM0/AS1G08_071T01_9000001874_12624cztM0_level2.evt | modeM0/AS1G08_071T01_9000001874_12624cztM0_level2_quad_clean.evt |
| Size (bytes) | 524,612,160 | 90,469,440 |
| Size | 500.3 MB | 86.3 MB |
| Events in quadrant A | 3,230,873 | 566,741 |
| Events in quadrant B | 3,581,768 | 576,667 |
| Events in quadrant C | 3,269,797 | 580,713 |
| Events in quadrant D | 5,333,384 | 530,805 |
| Mode SS | |||
|---|---|---|---|
| Quadrant | BADHDUFLAG | Total packets | Discarded packets |
| A | 0 | 148 | 8 |
| B | 0 | 148 | 6 |
| C | 0 | 148 | 2 |
| D | 0 | 148 | 6 |
| Mode M0 | |||
|---|---|---|---|
| Quadrant | BADHDUFLAG | Total packets | Discarded packets |
| A | 0 | 14967 | 505 |
| B | 0 | 15938 | 577 |
| C | 0 | 15177 | 467 |
| D | 0 | 21764 | 975 |
| Mode M9 | |||
|---|---|---|---|
| Quadrant | BADHDUFLAG | Total packets | Discarded packets |
| A | 0 | 20 | 1 |
| B | 0 | 20 | 0 |
| C | 0 | 20 | 1 |
| D | 0 | 20 | 0 |
| Quadrant | Total seconds | Saturated seconds | Saturation percentage |
|---|---|---|---|
| A | 6967 | 43 | 0.617195% |
| B | 6953 | 134 | 1.927226% |
| C | 6990 | 36 | 0.515021% |
| D | 6908 | 260 | 3.763752% |
Noise dominated data is calculated using 1-second bins in cleaned event files. If a bin has >2000 counts, and if more than 50% of those come from <1% of pixels, then it is considered to be noise-dominated and hence unusable.
| Quadrant | # 1 sec bins | Bins with >0 counts | Bins with >2000 counts | High rate bins dominated by noise | Noise dominated (total time) | Noise dominated (detector-on time) | Marked lightcurve |
|---|---|---|---|---|---|---|---|
| A | 9226 | 7138 | 5 | 5 | 0.05% | 0.07% | 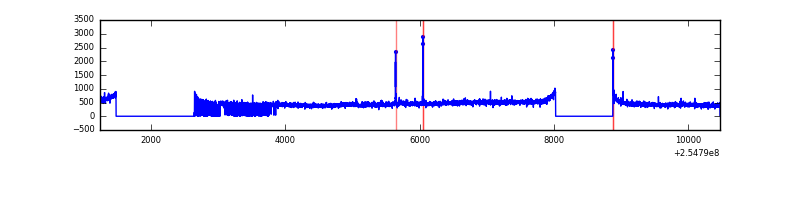 |
| B | 9226 | 7129 | 33 | 33 | 0.36% | 0.46% | 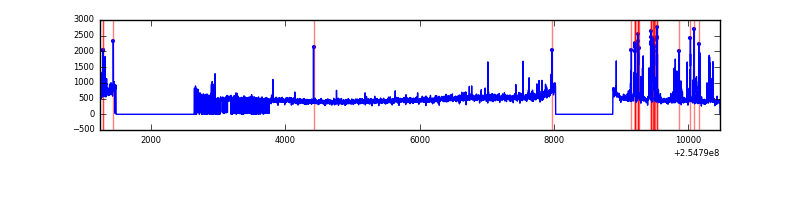 |
| C | 9226 | 7147 | 4 | 4 | 0.04% | 0.06% |  |
| D | 9226 | 7120 | 180 | 180 | 1.95% | 2.53% | 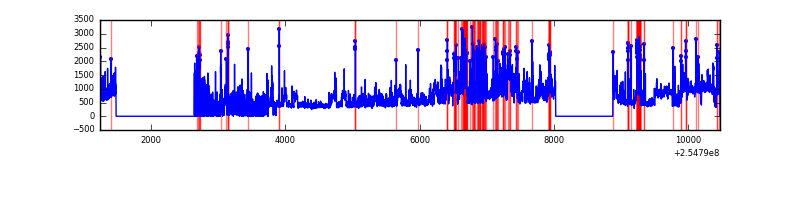 |
Top three noisy pixels from each quadrant. If the there are fewer than three noisy pixels in the level2.evt file, extra rows are filled as -1
| Pixel properties | Quadrant properties | ||||||
|---|---|---|---|---|---|---|---|
| Quadrant | DetID | PixID | Counts | Sigma | Mean | Median | Sigma |
| A | 12 | 189 | 72698 | 431.14 | 816 | 798 | 166.8 |
| A | 13 | 248 | 9488 | 52.11 | 816 | 798 | 166.8 |
| A | 8 | 192 | 9119 | 49.9 | 816 | 798 | 166.8 |
| B | 4 | 239 | 230523 | 1461.46 | 822 | 802 | 157.2 |
| B | 11 | 51 | 52070 | 326.16 | 822 | 802 | 157.2 |
| B | 0 | 214 | 35402 | 220.12 | 822 | 802 | 157.2 |
| C | 15 | 208 | 111110 | 590.85 | 807 | 811 | 186.7 |
| C | 14 | 234 | 10133 | 49.94 | 807 | 811 | 186.7 |
| C | 13 | 61 | 5888 | 27.2 | 807 | 811 | 186.7 |
| D | 10 | 157 | 1236359 | 6659.4 | 773 | 751 | 185.5 |
| D | 1 | 52 | 973990 | 5245.34 | 773 | 751 | 185.5 |
| D | 13 | 104 | 97964 | 523.94 | 773 | 751 | 185.5 |
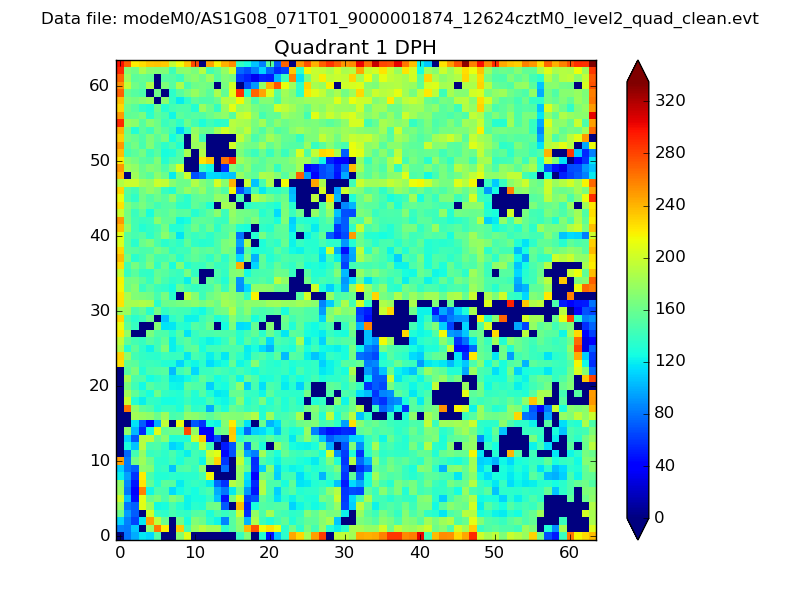
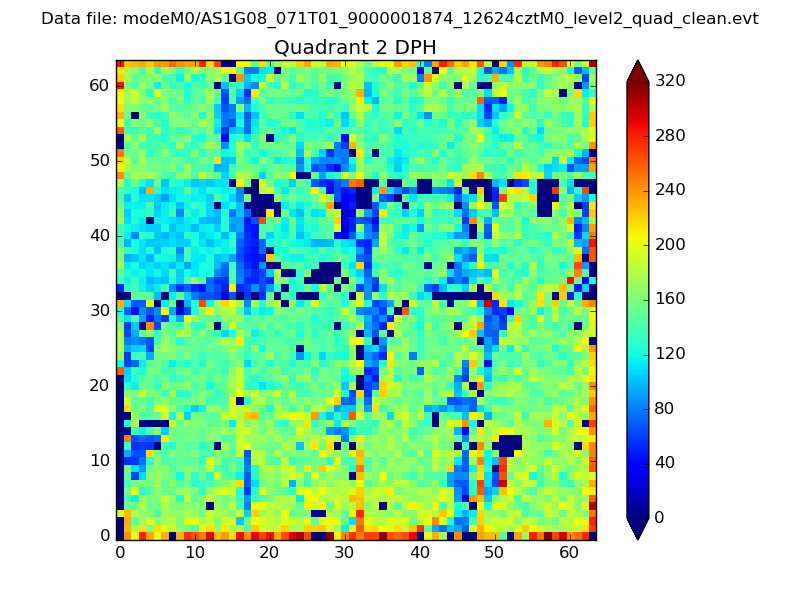
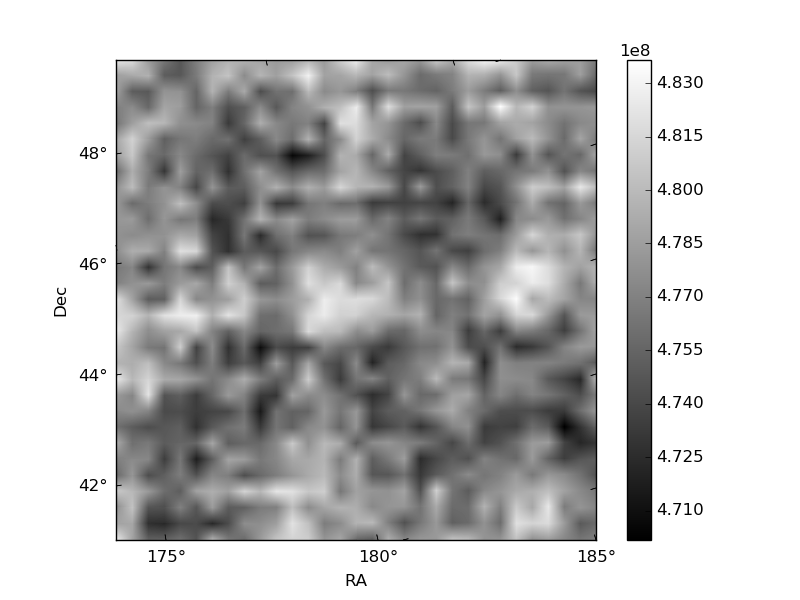
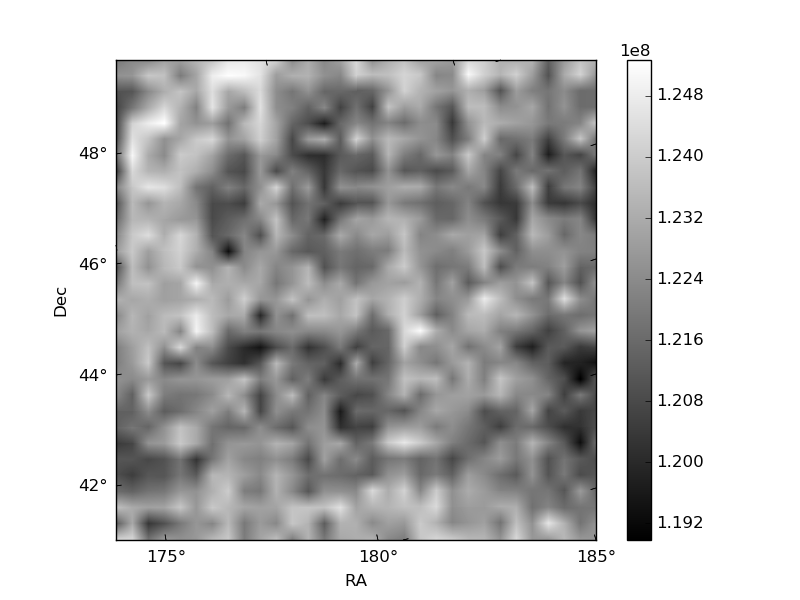
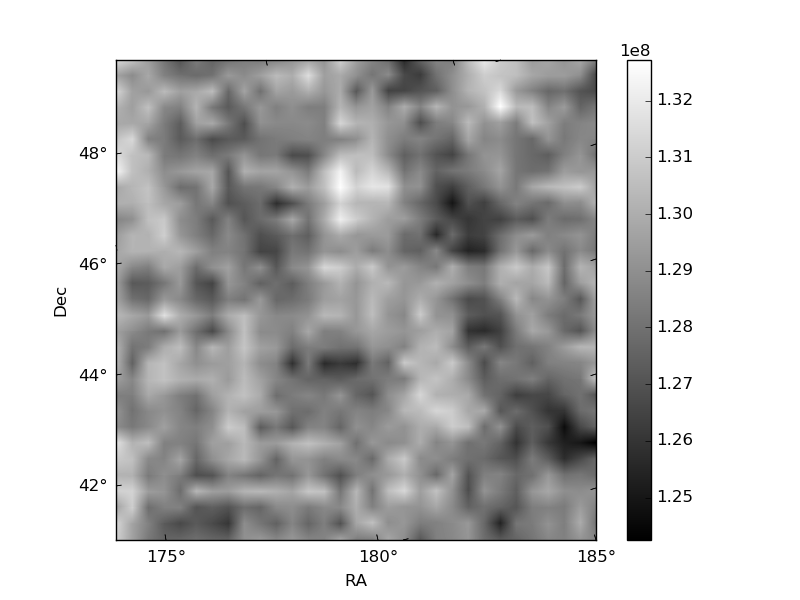
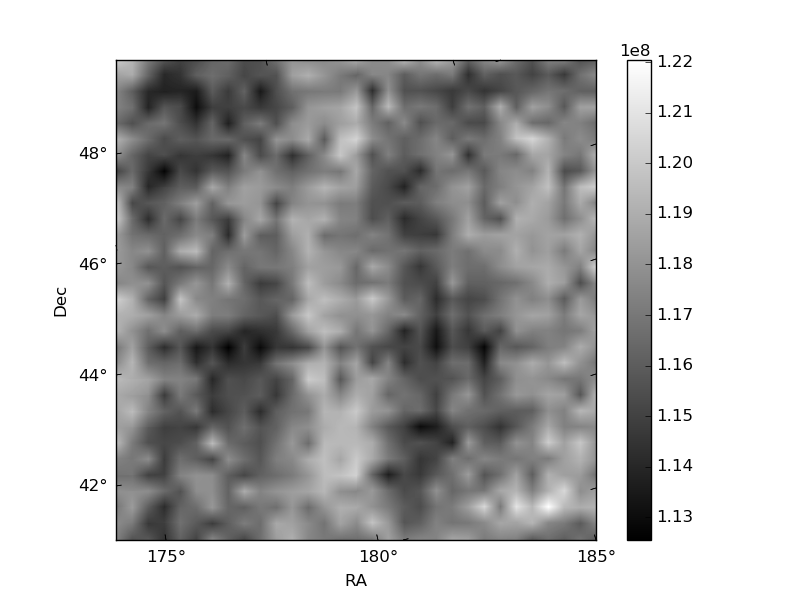
Histogram calculated using DETX and DETY for each event in the final _common_clean file
| Quadrant A | 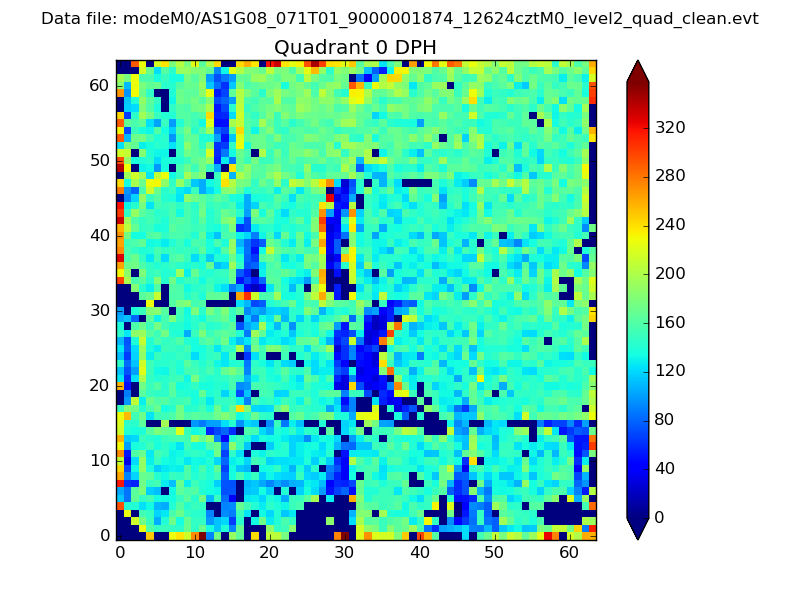 |
 |
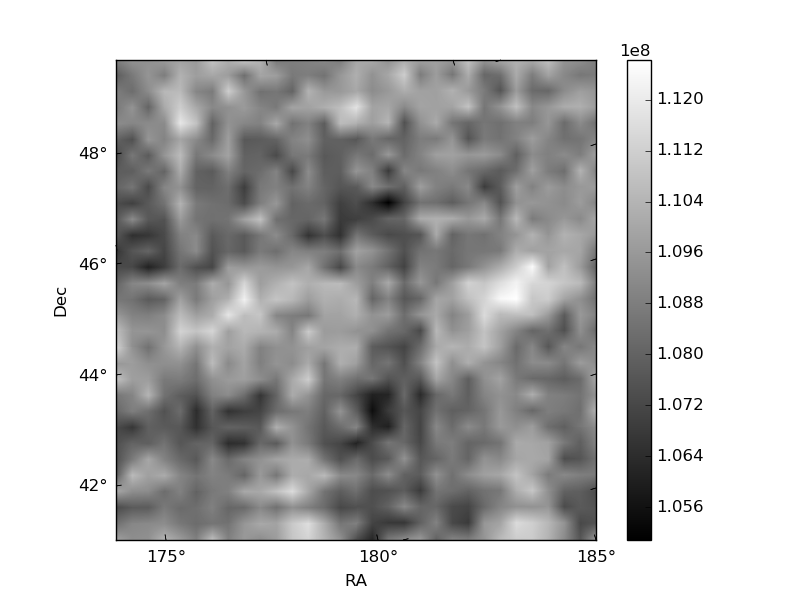
Quadrant B |
|---|---|---|---|
| Quadrant D | 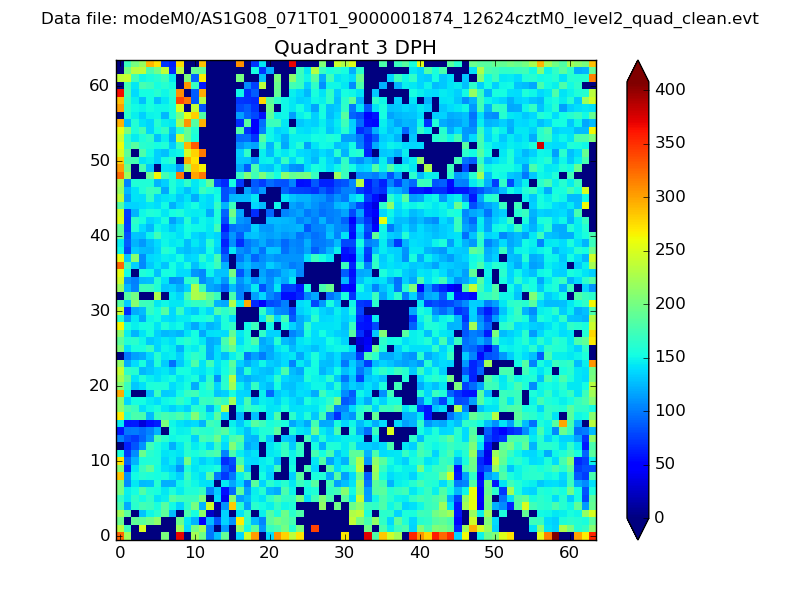 |
 |
Quadrant C |
| Plot type | Count rate plots | Images |
|---|---|---|
| Comparison with Poisson distribution Blue bars denote a histogram of data divided into 1 sec bins. Red curve is a Poisson curve with rate = median count rate of data. |
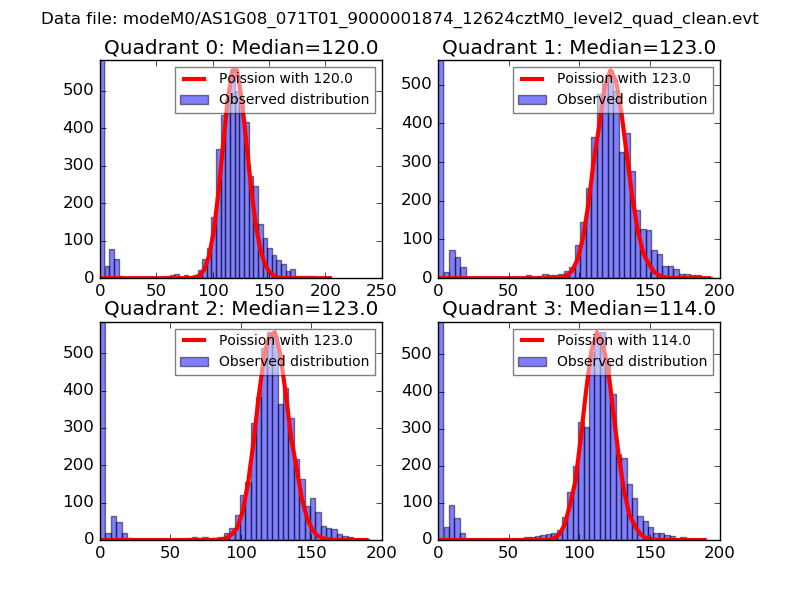 |
 |
| Quadrant-wise count rates Data is divided into 100 sec bins |
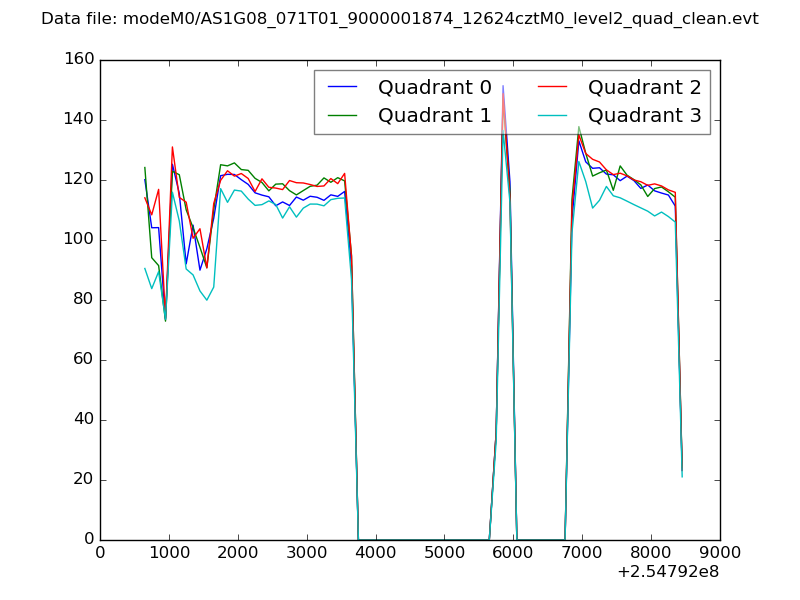 |
|
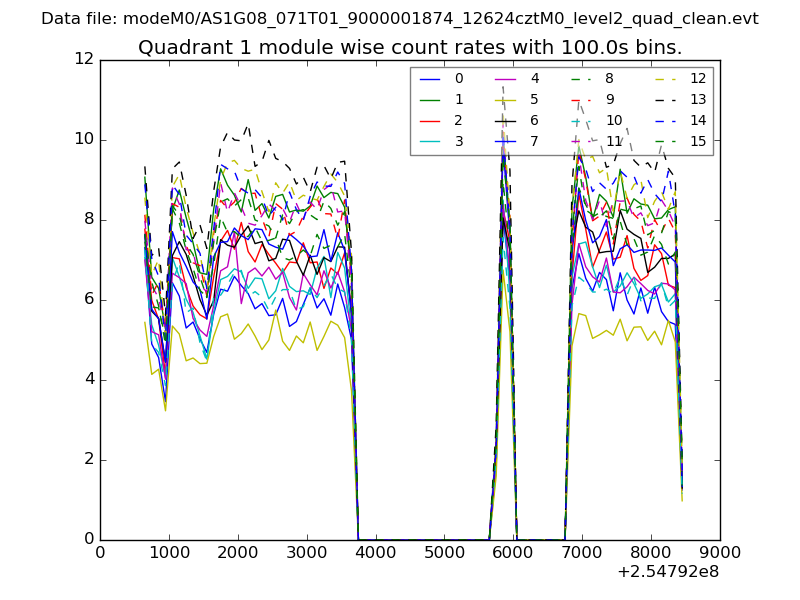
| Module-wise count rates for Quadrant A Data is divided into 100 sec bins |
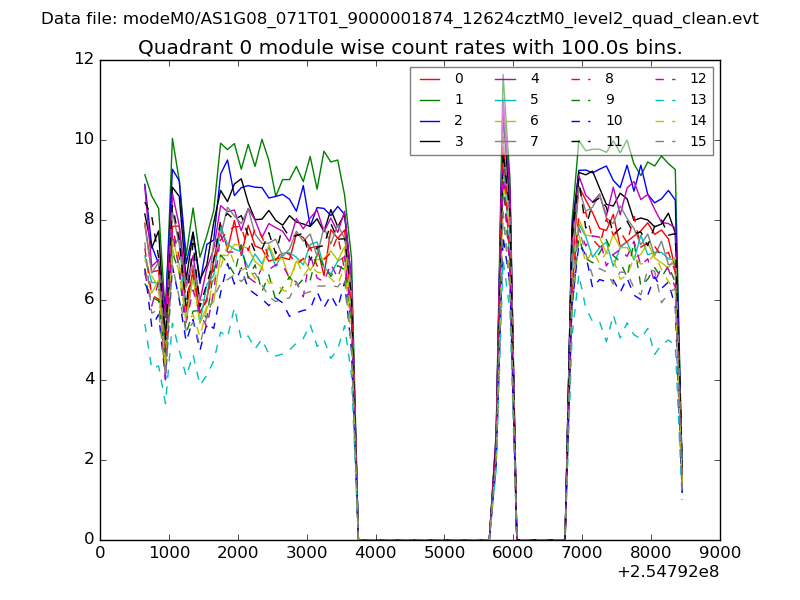 |
 |
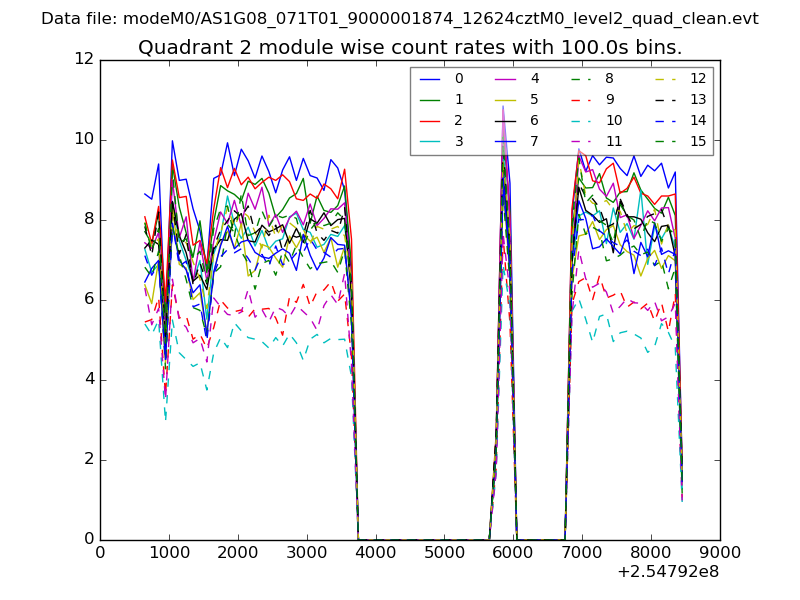
| Module-wise count rates for Quadrant B Data is divided into 100 sec bins |
 |
 |
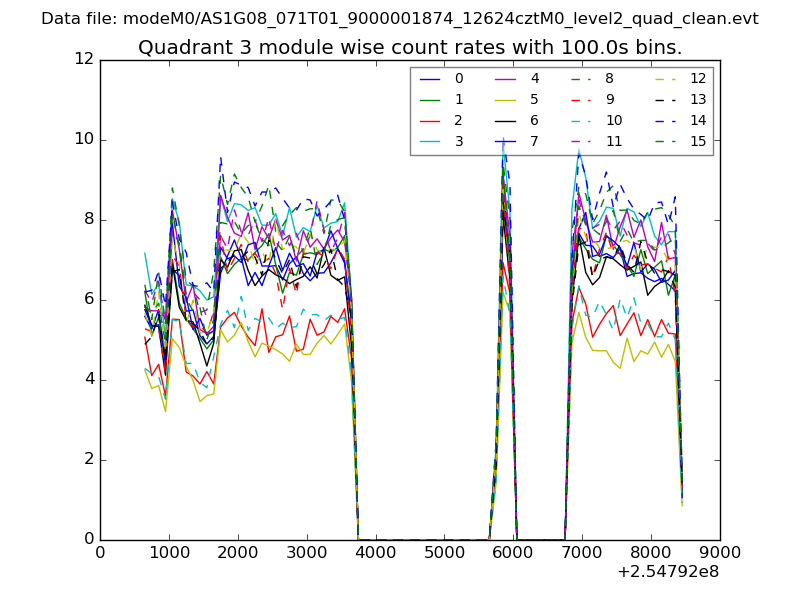
| Module-wise count rates for Quadrant C Data is divided into 100 sec bins |
 |
 |
| Module-wise count rates for Quadrant D Data is divided into 100 sec bins |
 |
 |
| Parameter | Plot |
|---|---|
| CZT HV Monitor | 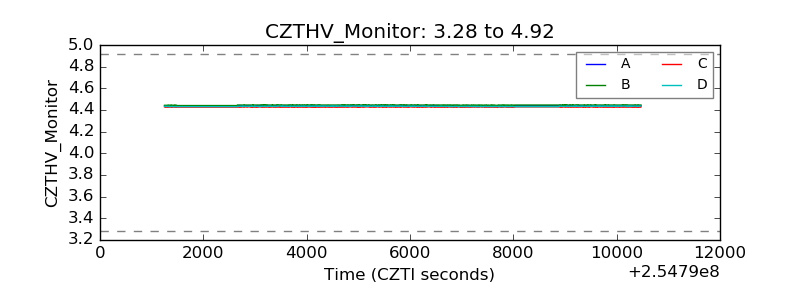 |
| D_VDD | 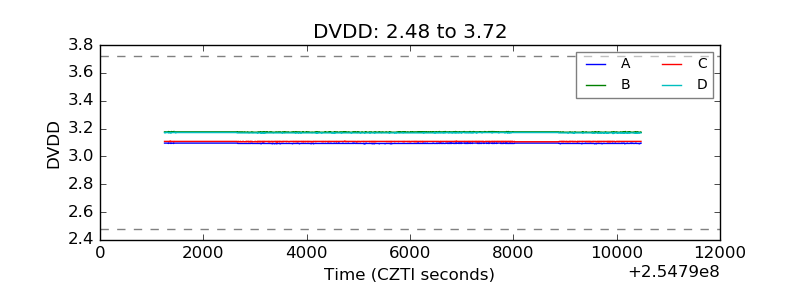 |
| Temperature 1 | 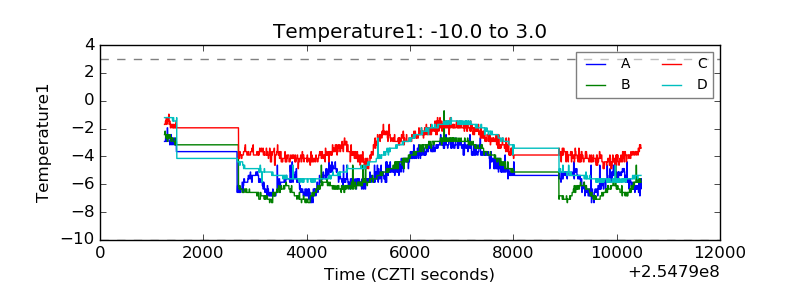 |
| Veto HV Monitor | 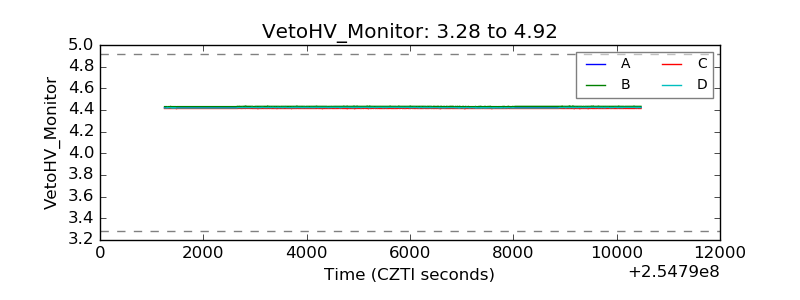 |
| Veto LLD | 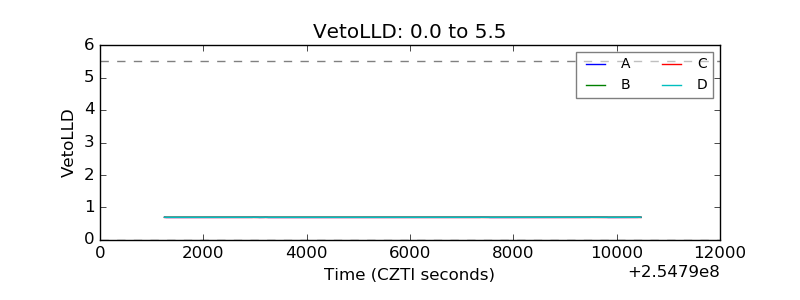 |
| Alpha Counter | 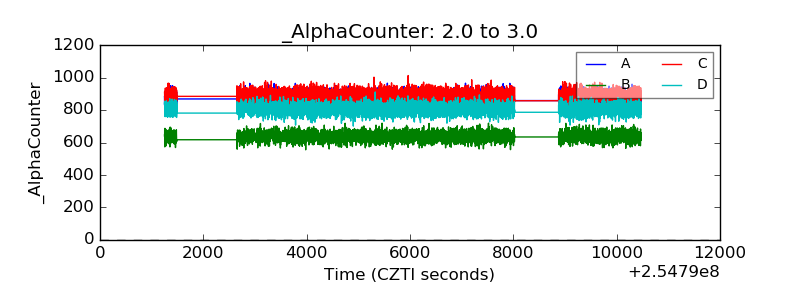 |
| _CPM_Rate | 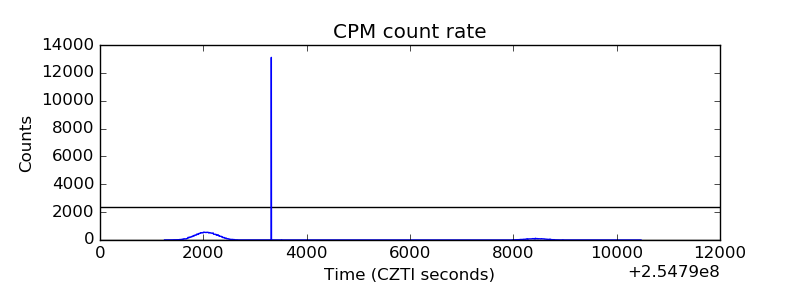 |
| CZT Counter | 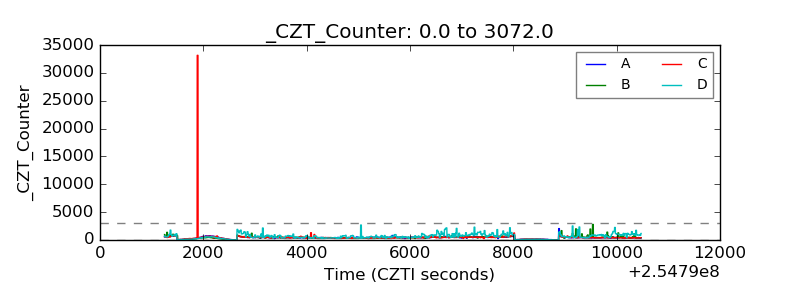 |
| +2.5 Volts monitor |  |
| +5 Volts monitor |  |
| _ROLL_ROT | 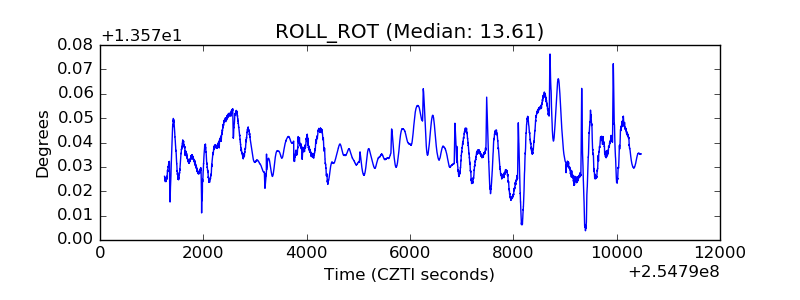 |
| _Roll_DEC | 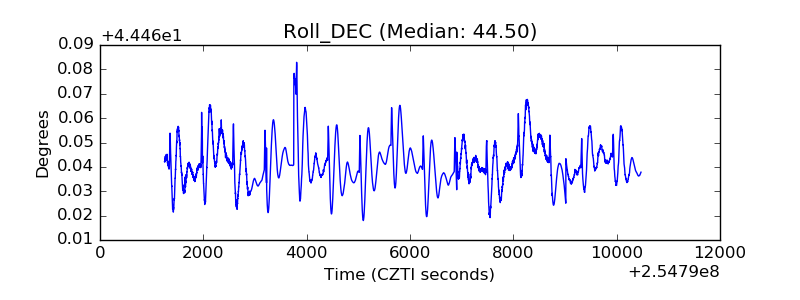 |
| _Roll_RA | 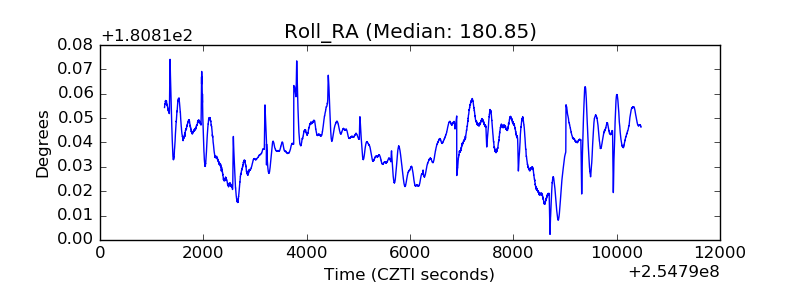 |
| Veto Counter | 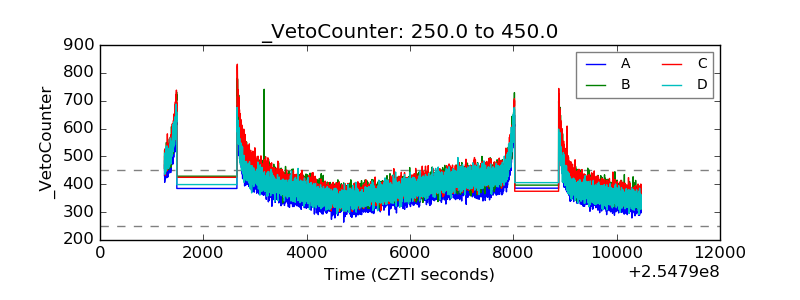 |