| Param | Original file | Final file |
|---|---|---|
| Filename | modeM0/AS1G08_071T01_9000001874_12625cztM0_level2.evt | modeM0/AS1G08_071T01_9000001874_12625cztM0_level2_quad_clean.evt |
| Size (bytes) | 185,892,480 | 43,398,720 |
| Size | 177.3 MB | 41.4 MB |
| Events in quadrant A | 1,136,087 | 283,865 |
| Events in quadrant B | 1,315,946 | 282,662 |
| Events in quadrant C | 1,131,701 | 289,383 |
| Events in quadrant D | 1,857,462 | 262,204 |
| Mode SS | |||
|---|---|---|---|
| Quadrant | BADHDUFLAG | Total packets | Discarded packets |
| A | 0 | 86 | 28 |
| B | 0 | 86 | 34 |
| C | 0 | 86 | 28 |
| D | 0 | 86 | 26 |
| Mode M0 | |||
|---|---|---|---|
| Quadrant | BADHDUFLAG | Total packets | Discarded packets |
| A | 0 | 8483 | 2925 |
| B | 0 | 9406 | 3523 |
| C | 0 | 8599 | 3008 |
| D | 0 | 12183 | 4696 |
| Mode M9 | |||
|---|---|---|---|
| Quadrant | BADHDUFLAG | Total packets | Discarded packets |
| A | 0 | 8 | 4 |
| B | 0 | 8 | 5 |
| C | 0 | 8 | 4 |
| D | 0 | 8 | 6 |
| Quadrant | Total seconds | Saturated seconds | Saturation percentage |
|---|---|---|---|
| A | 2771 | 2 | 0.072176% |
| B | 2706 | 28 | 1.034738% |
| C | 2770 | 1 | 0.036101% |
| D | 2656 | 16 | 0.602410% |
Noise dominated data is calculated using 1-second bins in cleaned event files. If a bin has >2000 counts, and if more than 50% of those come from <1% of pixels, then it is considered to be noise-dominated and hence unusable.
| Quadrant | # 1 sec bins | Bins with >0 counts | Bins with >2000 counts | High rate bins dominated by noise | Noise dominated (total time) | Noise dominated (detector-on time) | Marked lightcurve |
|---|---|---|---|---|---|---|---|
| A | 4578 | 3080 | 0 | 0 | 0.00% | 0.00% | 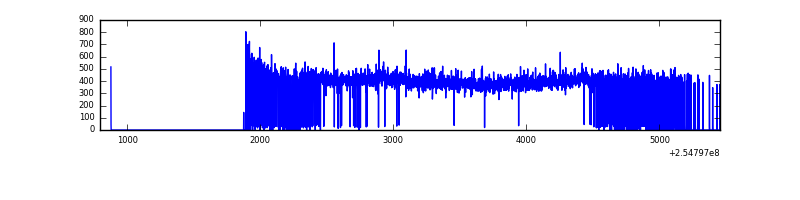 |
| B | 4592 | 3011 | 13 | 13 | 0.28% | 0.43% | 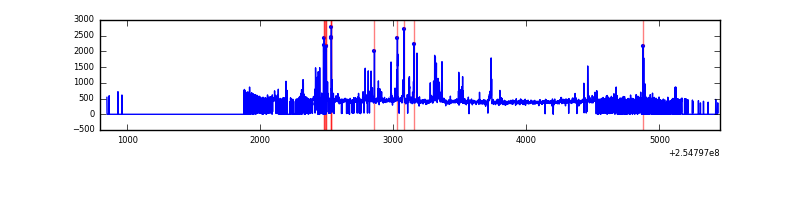 |
| C | 4605 | 3097 | 0 | 0 | 0.00% | 0.00% | 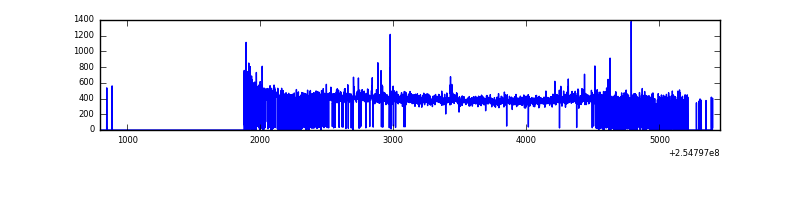 |
| D | 4493 | 2986 | 17 | 17 | 0.38% | 0.57% | 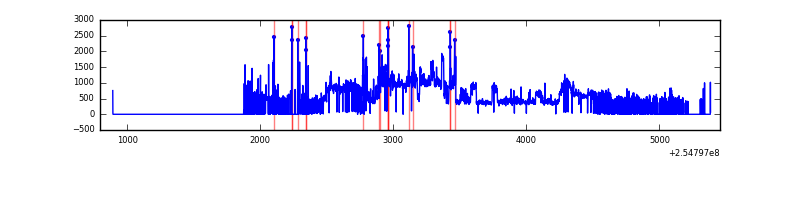 |
Top three noisy pixels from each quadrant. If the there are fewer than three noisy pixels in the level2.evt file, extra rows are filled as -1
| Pixel properties | Quadrant properties | ||||||
|---|---|---|---|---|---|---|---|
| Quadrant | DetID | PixID | Counts | Sigma | Mean | Median | Sigma |
| A | 12 | 189 | 15211 | 245.23 | 291 | 286 | 60.9 |
| A | 0 | 226 | 2612 | 38.22 | 291 | 286 | 60.9 |
| A | 12 | 194 | 2065 | 29.23 | 291 | 286 | 60.9 |
| B | 4 | 239 | 151234 | 2696.75 | 287 | 280 | 56.0 |
| B | 11 | 51 | 16055 | 281.82 | 287 | 280 | 56.0 |
| B | 3 | 64 | 15261 | 267.63 | 287 | 280 | 56.0 |
| C | 15 | 208 | 15623 | 227.01 | 286 | 287 | 67.6 |
| C | 13 | 61 | 2004 | 25.42 | 286 | 287 | 67.6 |
| C | 8 | 222 | 1282 | 14.73 | 286 | 287 | 67.6 |
| D | 10 | 157 | 663949 | 10059.09 | 267 | 260 | 66.0 |
| D | 1 | 52 | 159837 | 2418.6 | 267 | 260 | 66.0 |
| D | 13 | 104 | 14767 | 219.87 | 267 | 260 | 66.0 |
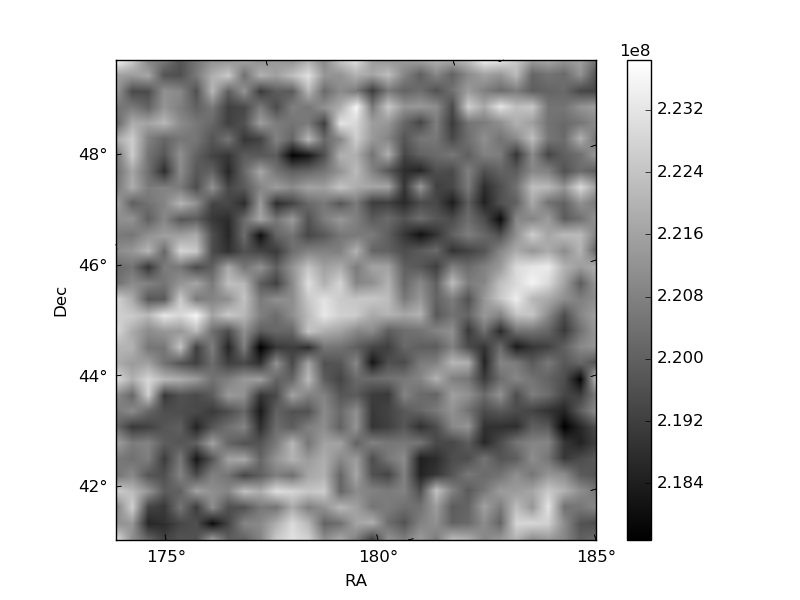
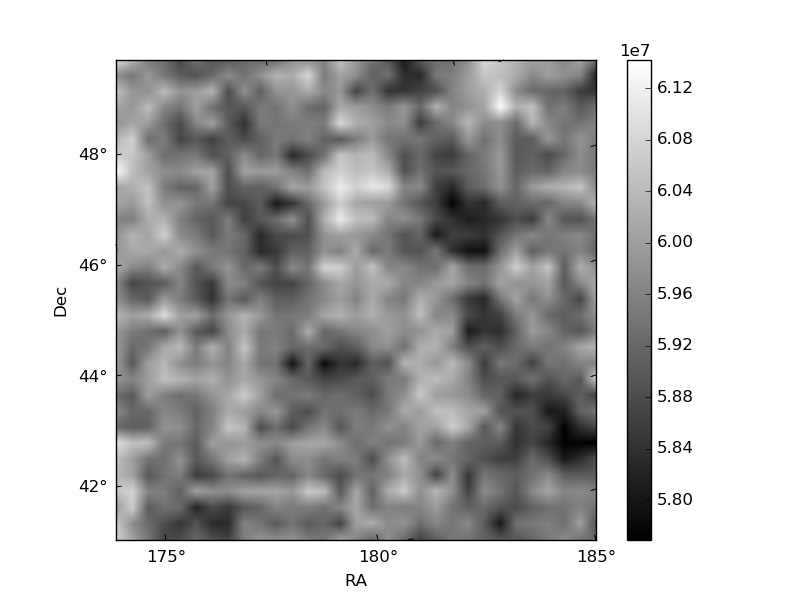
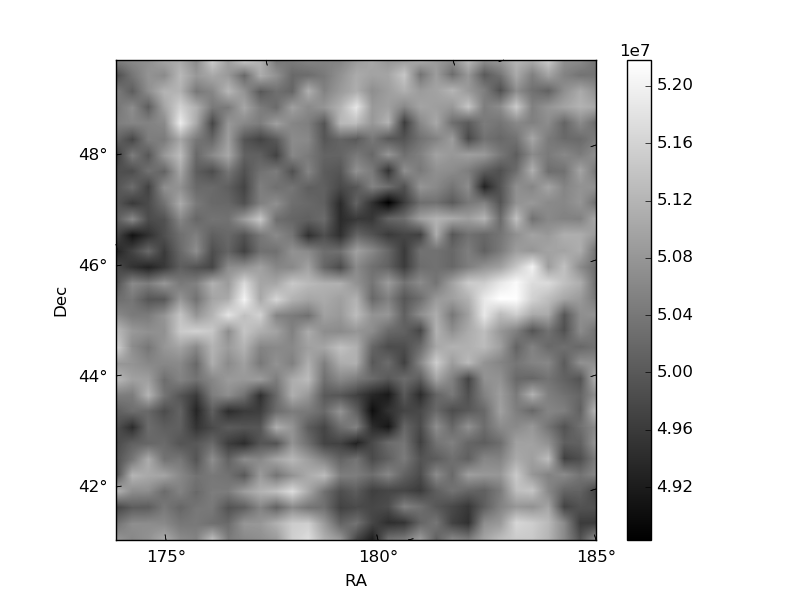
Histogram calculated using DETX and DETY for each event in the final _common_clean file
| Quadrant A | 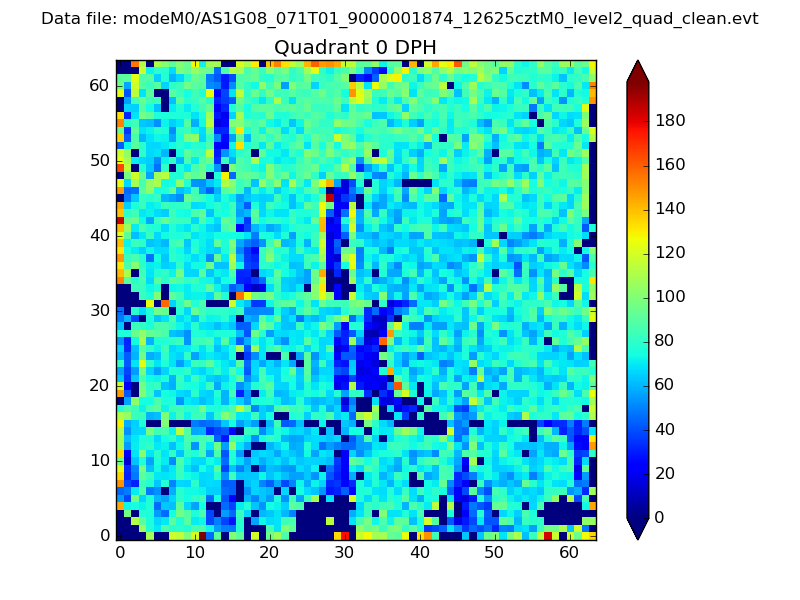 |
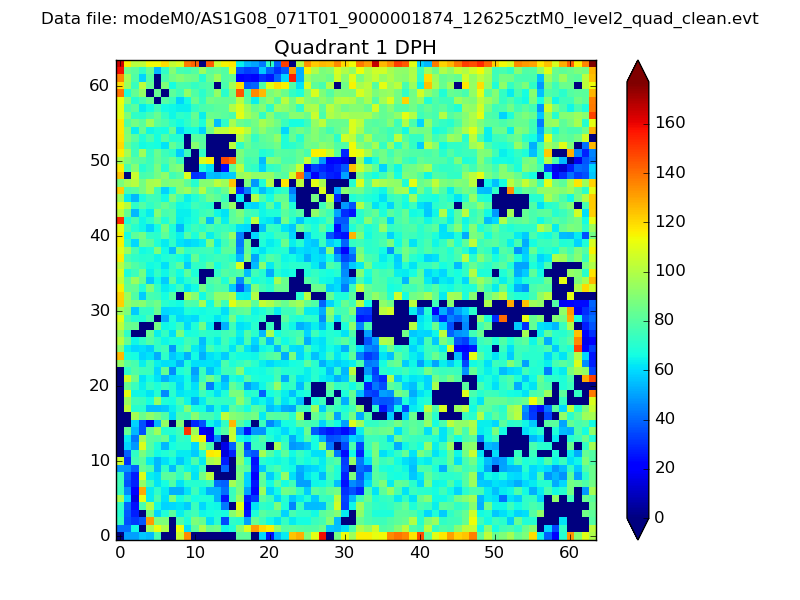 |
Quadrant B |
|---|---|---|---|
| Quadrant D | 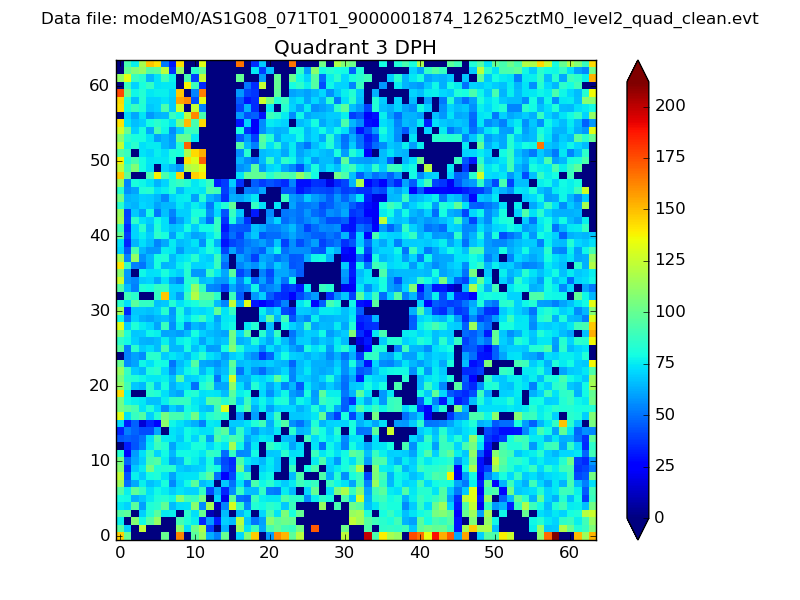 |
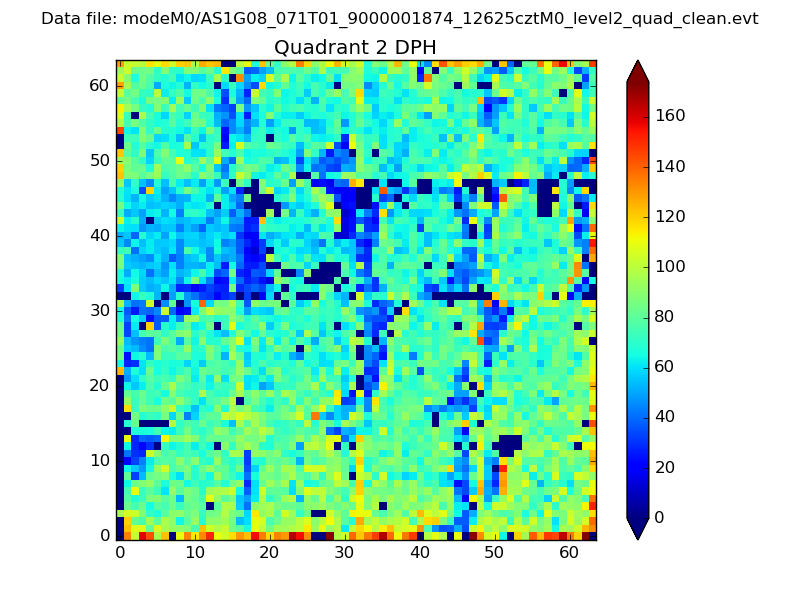 |
Quadrant C |
| Plot type | Count rate plots | Images |
|---|---|---|
| Comparison with Poisson distribution Blue bars denote a histogram of data divided into 1 sec bins. Red curve is a Poisson curve with rate = median count rate of data. |
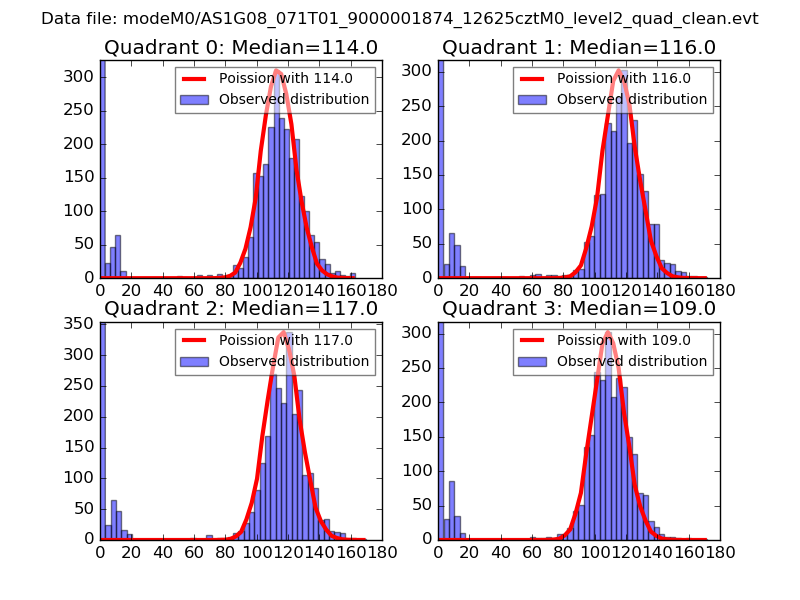 |
 |
| Quadrant-wise count rates Data is divided into 100 sec bins |
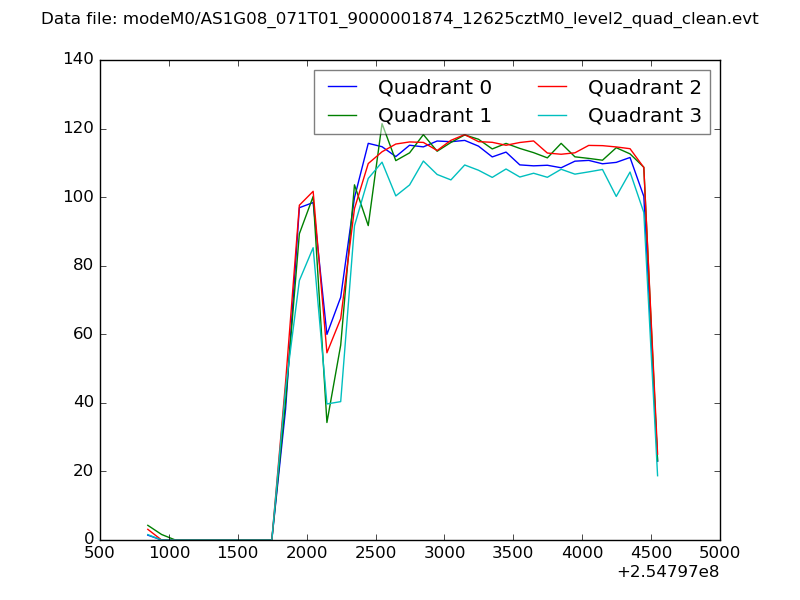 |
|
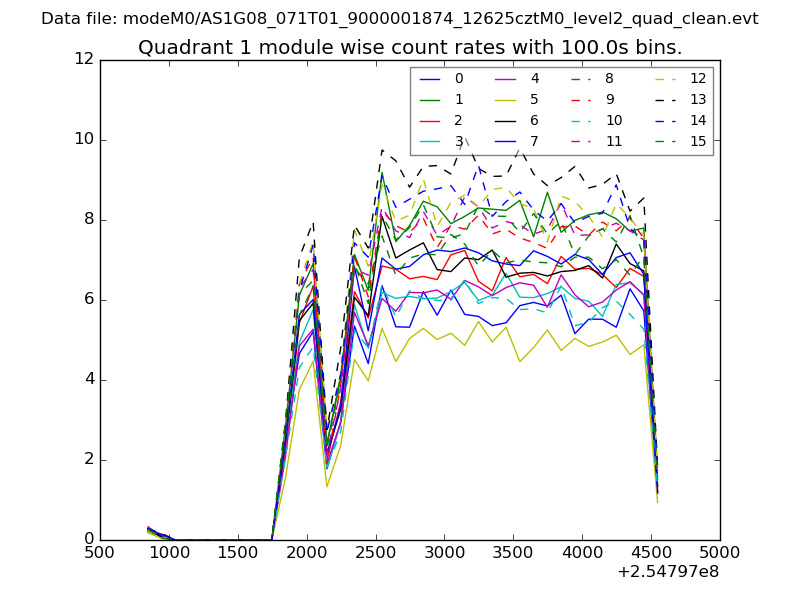
| Module-wise count rates for Quadrant A Data is divided into 100 sec bins |
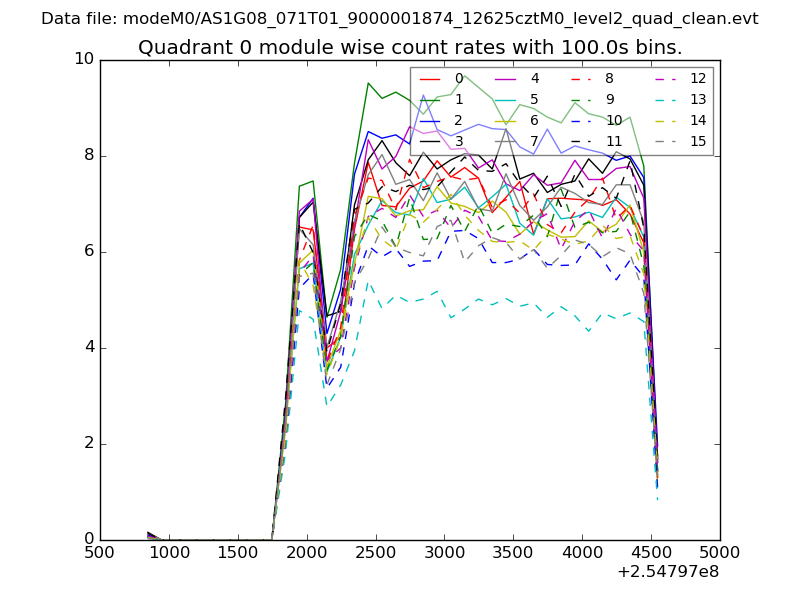 |
 |
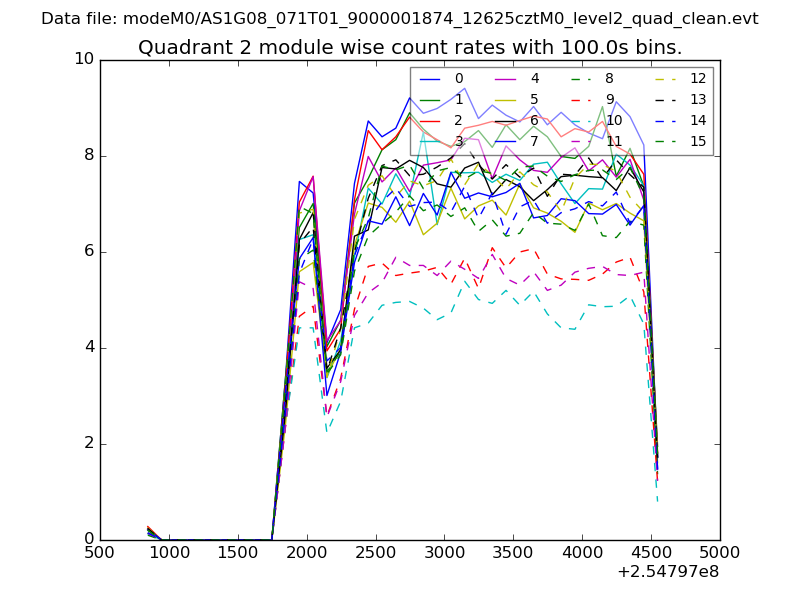
| Module-wise count rates for Quadrant B Data is divided into 100 sec bins |
 |
 |
| Module-wise count rates for Quadrant C Data is divided into 100 sec bins |
 |
 |
| Module-wise count rates for Quadrant D Data is divided into 100 sec bins |
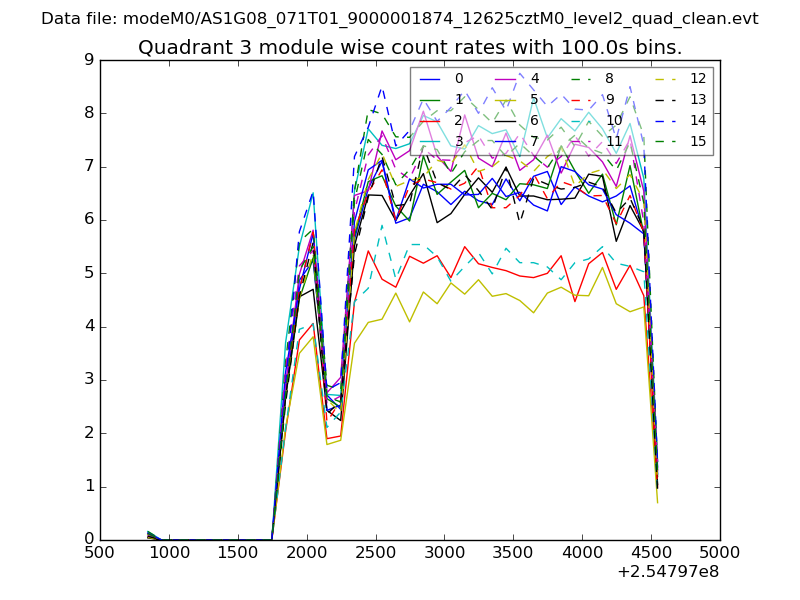 |
 |
| Parameter | Plot |
|---|---|
| CZT HV Monitor | 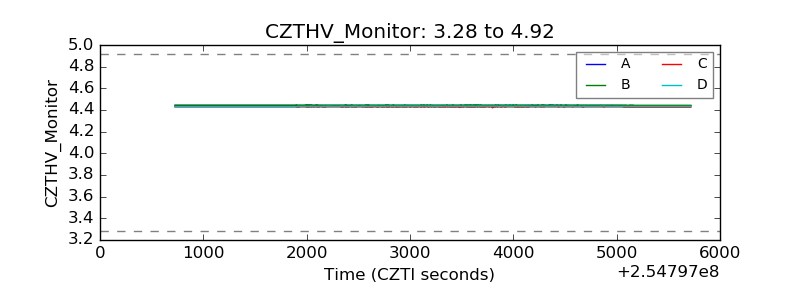 |
| D_VDD | 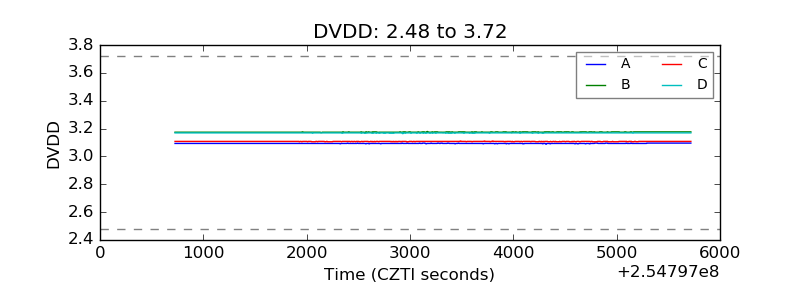 |
| Temperature 1 | 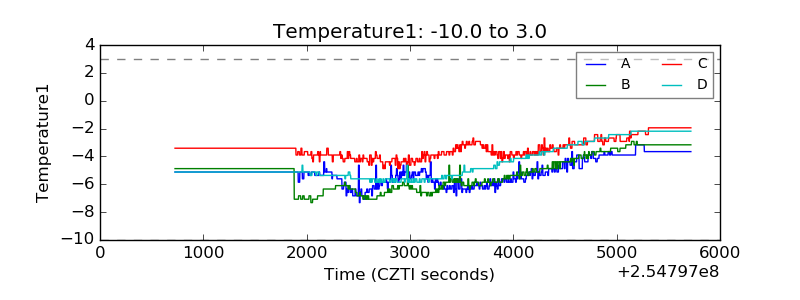 |
| Veto HV Monitor | 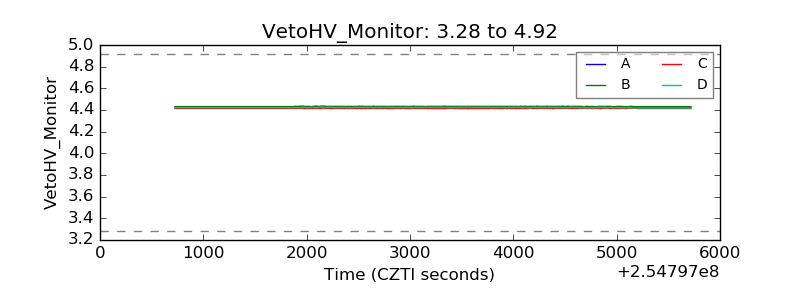 |
| Veto LLD | 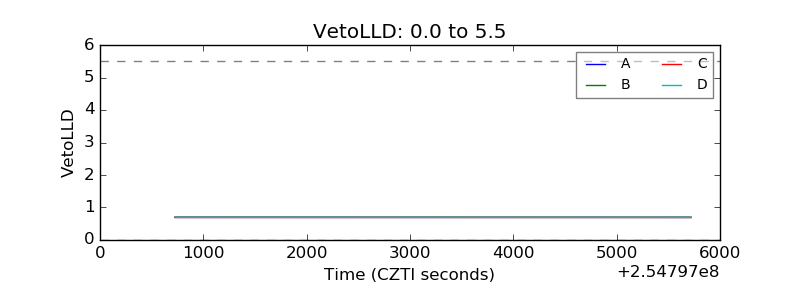 |
| Alpha Counter | 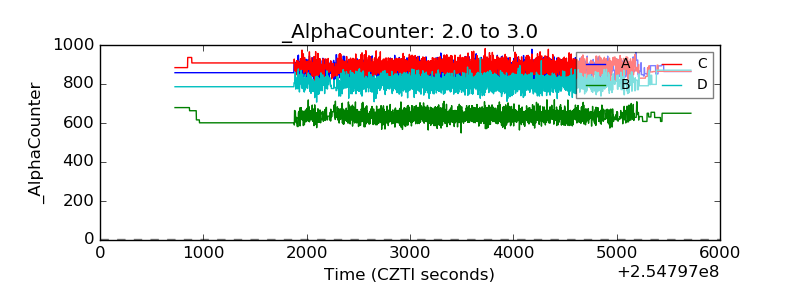 |
| _CPM_Rate | 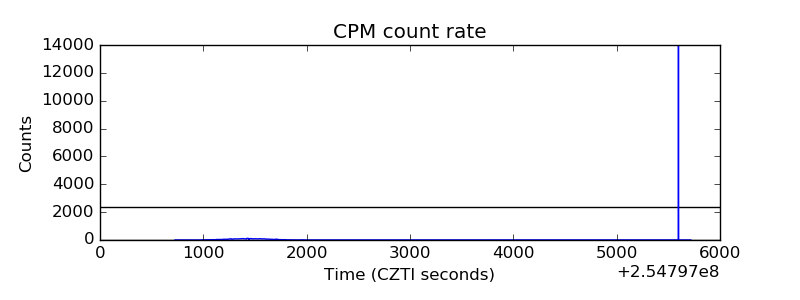 |
| CZT Counter | 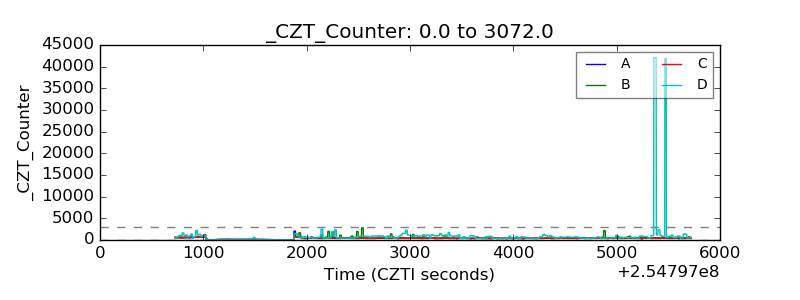 |
| +2.5 Volts monitor |  |
| +5 Volts monitor |  |
| _ROLL_ROT | 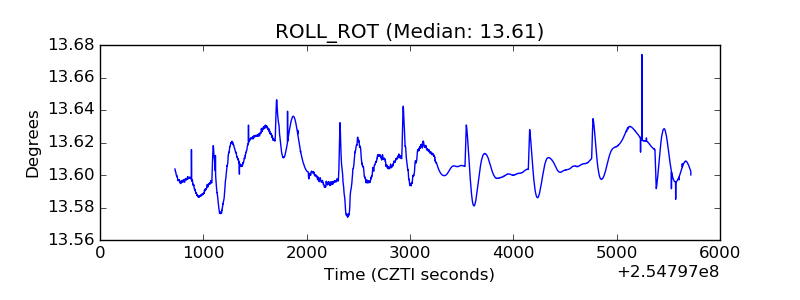 |
| _Roll_DEC | 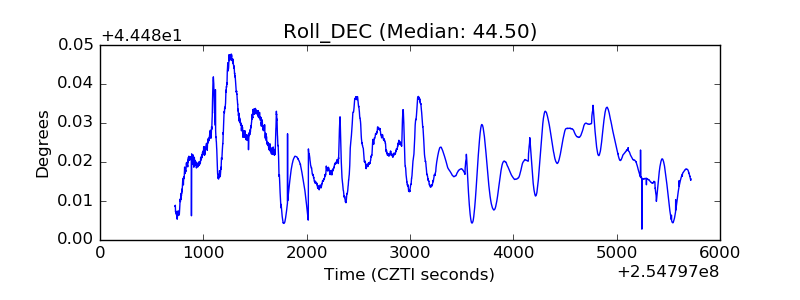 |
| _Roll_RA | 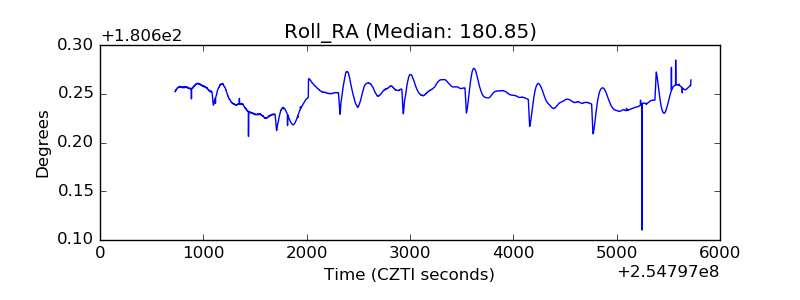 |
| Veto Counter | 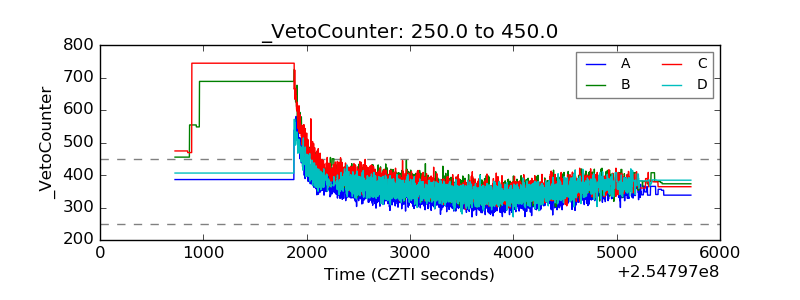 |