| Param | Original file | Final file |
|---|---|---|
| Filename | modeM0/AS1G08_071T01_9000001874_12626cztM0_level2.evt | modeM0/AS1G08_071T01_9000001874_12626cztM0_level2_quad_clean.evt |
| Size (bytes) | 118,480,320 | 28,765,440 |
| Size | 113.0 MB | 27.4 MB |
| Events in quadrant A | 753,204 | 193,205 |
| Events in quadrant B | 815,316 | 197,151 |
| Events in quadrant C | 745,326 | 195,831 |
| Events in quadrant D | 1,162,437 | 166,185 |
| Mode SS | |||
|---|---|---|---|
| Quadrant | BADHDUFLAG | Total packets | Discarded packets |
| A | 0 | 52 | 18 |
| B | 0 | 52 | 12 |
| C | 0 | 52 | 24 |
| D | 0 | 52 | 18 |
| Mode M0 | |||
|---|---|---|---|
| Quadrant | BADHDUFLAG | Total packets | Discarded packets |
| A | 0 | 5485 | 1990 |
| B | 0 | 5774 | 2206 |
| C | 0 | 5712 | 2265 |
| D | 0 | 8356 | 3824 |
| Quadrant | Total seconds | Saturated seconds | Saturation percentage |
|---|---|---|---|
| A | 1639 | 132 | 8.053691% |
| B | 1621 | 131 | 8.081431% |
| C | 1613 | 71 | 4.401736% |
| D | 1495 | 164 | 10.969900% |
Noise dominated data is calculated using 1-second bins in cleaned event files. If a bin has >2000 counts, and if more than 50% of those come from <1% of pixels, then it is considered to be noise-dominated and hence unusable.
| Quadrant | # 1 sec bins | Bins with >0 counts | Bins with >2000 counts | High rate bins dominated by noise | Noise dominated (total time) | Noise dominated (detector-on time) | Marked lightcurve |
|---|---|---|---|---|---|---|---|
| A | 2338 | 1817 | 0 | 0 | 0.00% | 0.00% | 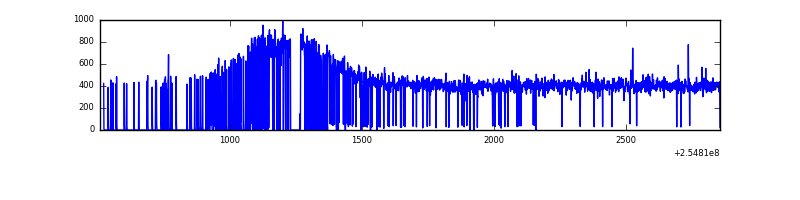 |
| B | 2291 | 1795 | 5 | 5 | 0.22% | 0.28% | 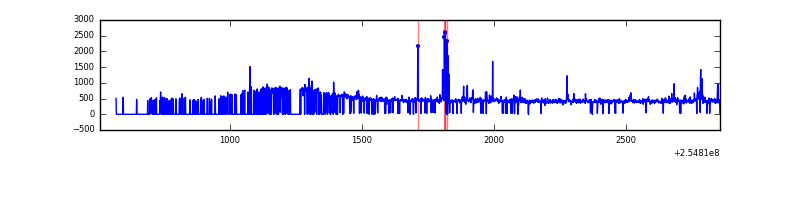 |
| C | 2352 | 1792 | 0 | 0 | 0.00% | 0.00% | 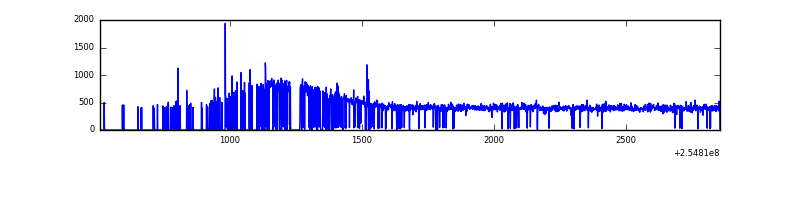 |
| D | 2319 | 1667 | 75 | 75 | 3.23% | 4.50% | 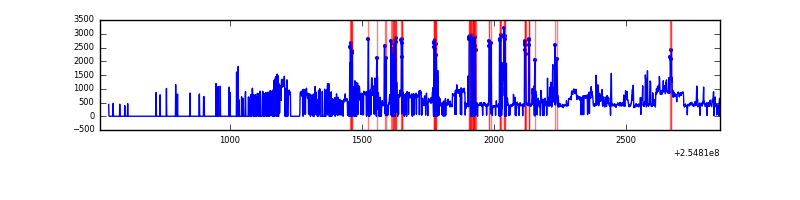 |
Top three noisy pixels from each quadrant. If the there are fewer than three noisy pixels in the level2.evt file, extra rows are filled as -1
| Pixel properties | Quadrant properties | ||||||
|---|---|---|---|---|---|---|---|
| Quadrant | DetID | PixID | Counts | Sigma | Mean | Median | Sigma |
| A | 12 | 189 | 2043 | 43.61 | 195 | 190 | 42.5 |
| A | 0 | 226 | 1761 | 36.97 | 195 | 190 | 42.5 |
| A | 12 | 194 | 1507 | 30.99 | 195 | 190 | 42.5 |
| B | 4 | 239 | 53578 | 1338.42 | 192 | 187 | 39.9 |
| B | 12 | 111 | 4516 | 108.52 | 192 | 187 | 39.9 |
| B | 0 | 182 | 4415 | 105.99 | 192 | 187 | 39.9 |
| C | 15 | 208 | 14887 | 328.76 | 185 | 185 | 44.7 |
| C | 8 | 128 | 3083 | 64.8 | 185 | 185 | 44.7 |
| C | 4 | 175 | 2199 | 45.04 | 185 | 185 | 44.7 |
| D | 1 | 52 | 321983 | 7803.9 | 165 | 160 | 41.2 |
| D | 10 | 157 | 196436 | 4759.51 | 165 | 160 | 41.2 |
| D | 13 | 249 | 11488 | 274.69 | 165 | 160 | 41.2 |
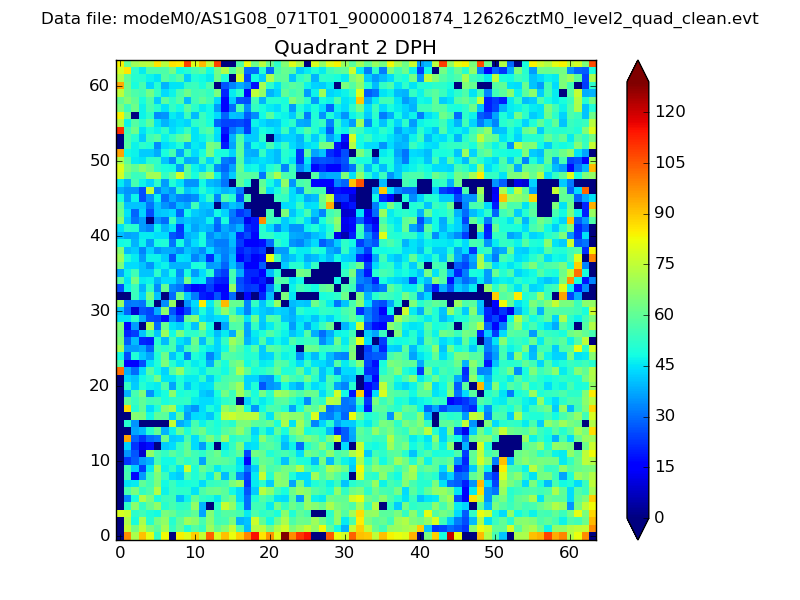
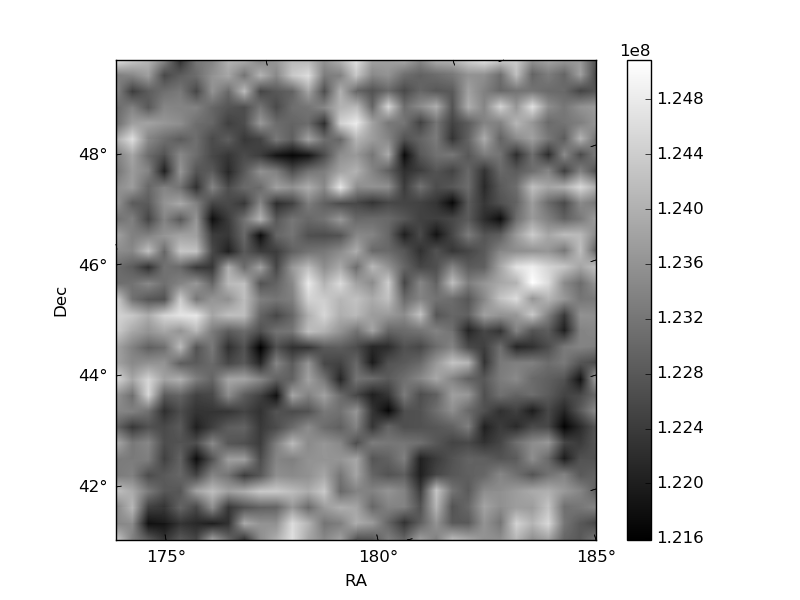
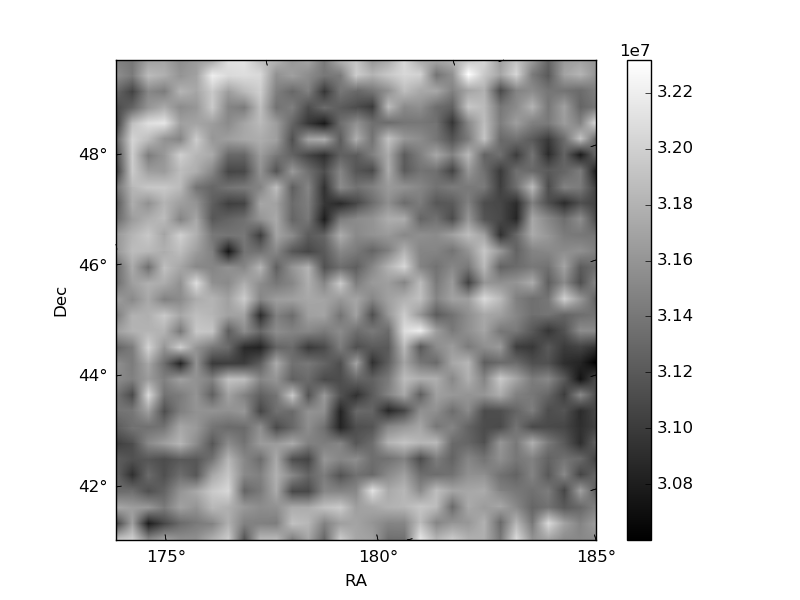
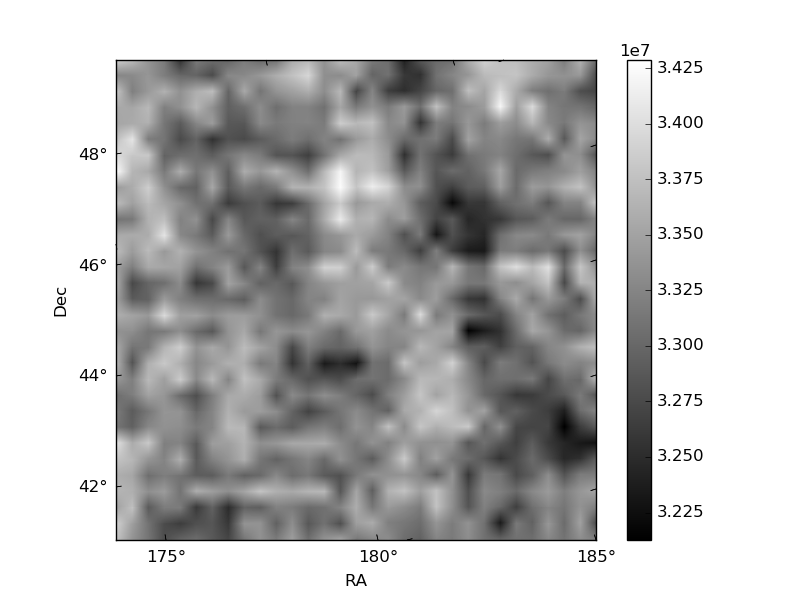
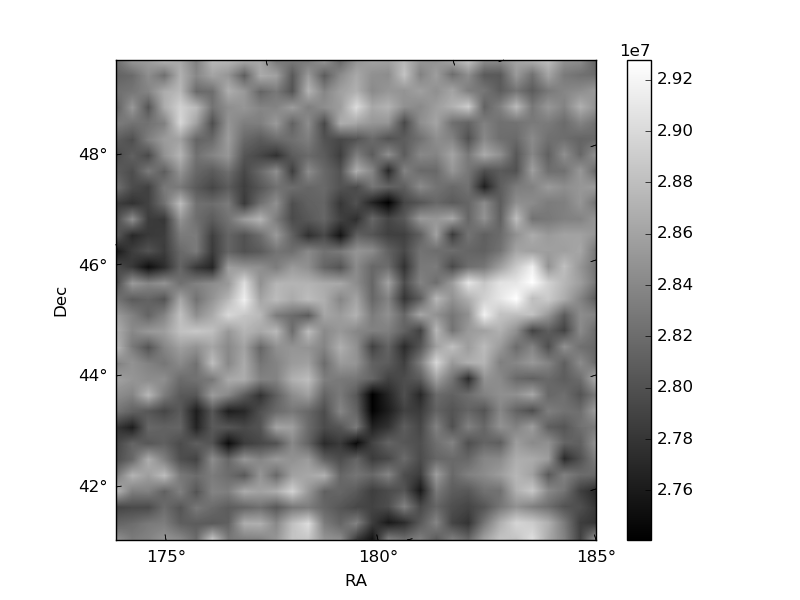
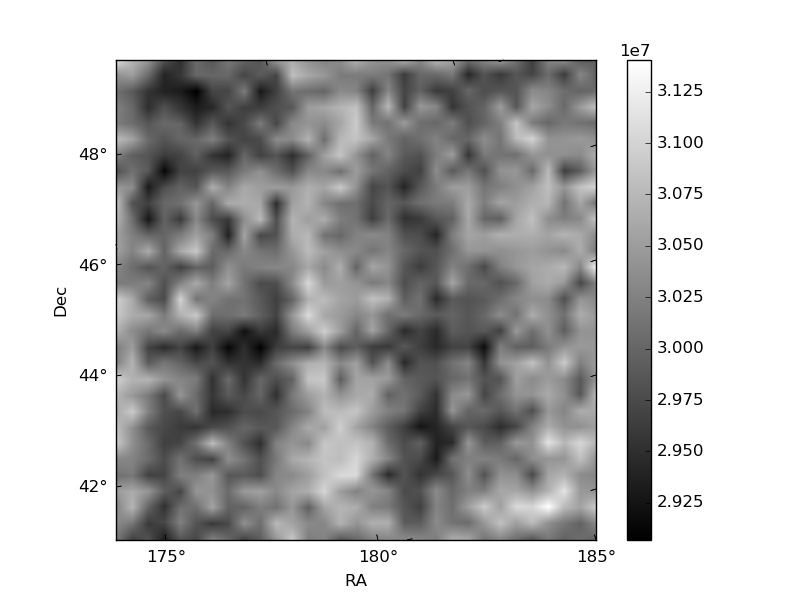
Histogram calculated using DETX and DETY for each event in the final _common_clean file
| Quadrant A | 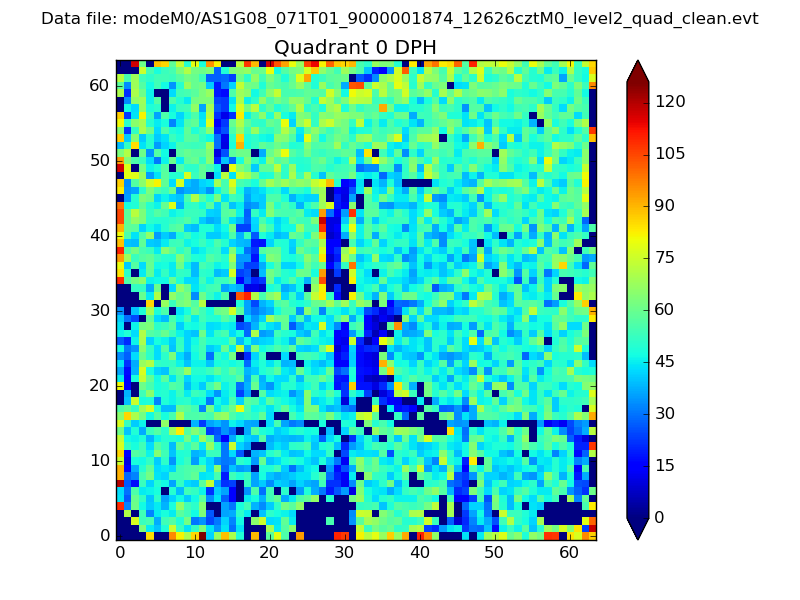 |
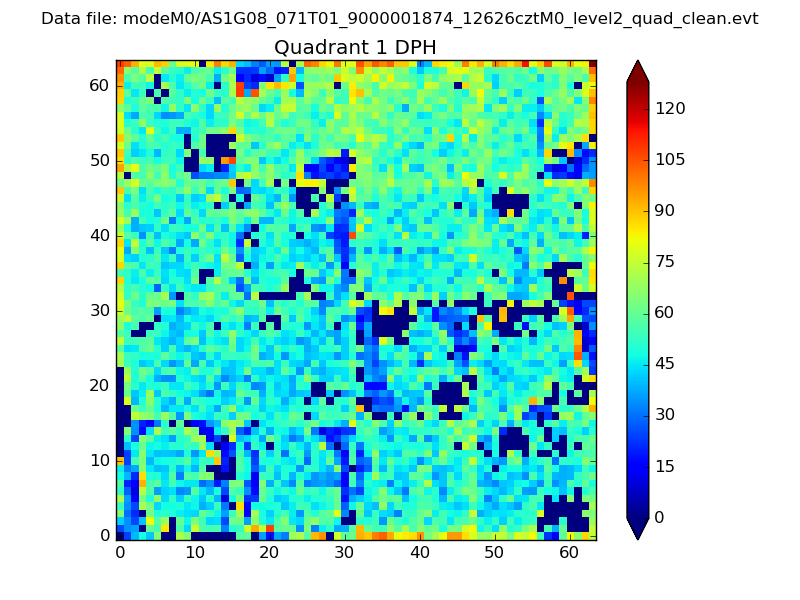 |
Quadrant B |
|---|---|---|---|
| Quadrant D | 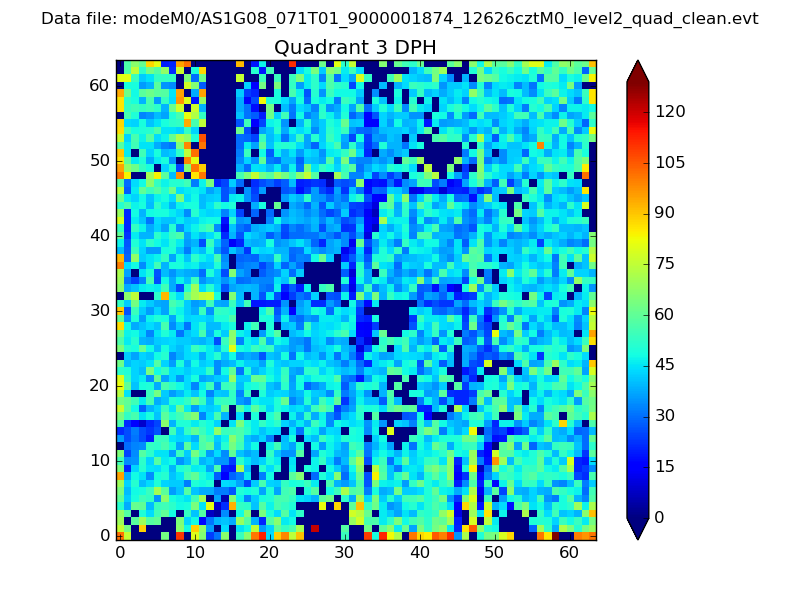 |
 |
Quadrant C |
| Plot type | Count rate plots | Images |
|---|---|---|
| Comparison with Poisson distribution Blue bars denote a histogram of data divided into 1 sec bins. Red curve is a Poisson curve with rate = median count rate of data. |
 |
 |
| Quadrant-wise count rates Data is divided into 100 sec bins |
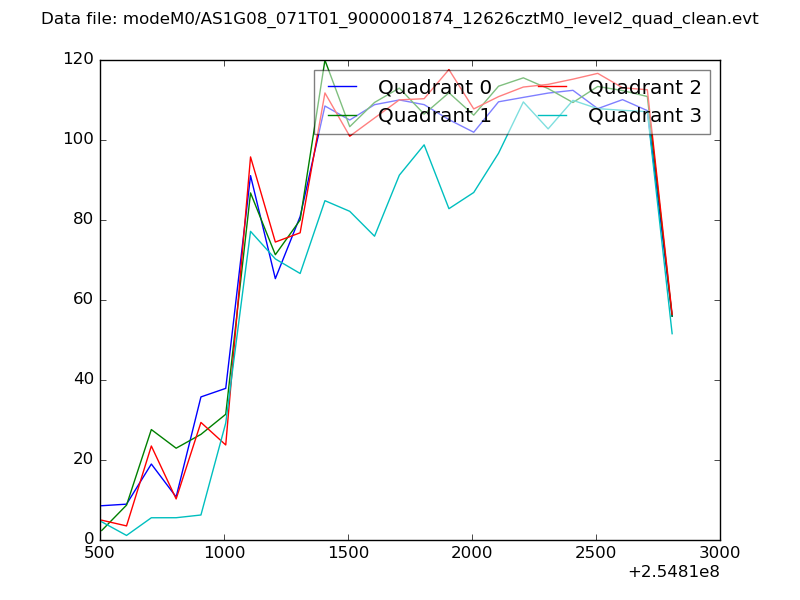 |
|
| Module-wise count rates for Quadrant A Data is divided into 100 sec bins |
 |
 |
| Module-wise count rates for Quadrant B Data is divided into 100 sec bins |
 |
 |
| Module-wise count rates for Quadrant C Data is divided into 100 sec bins |
 |
 |
| Module-wise count rates for Quadrant D Data is divided into 100 sec bins |
 |
 |
| Parameter | Plot |
|---|---|
| CZT HV Monitor |  |
| D_VDD | 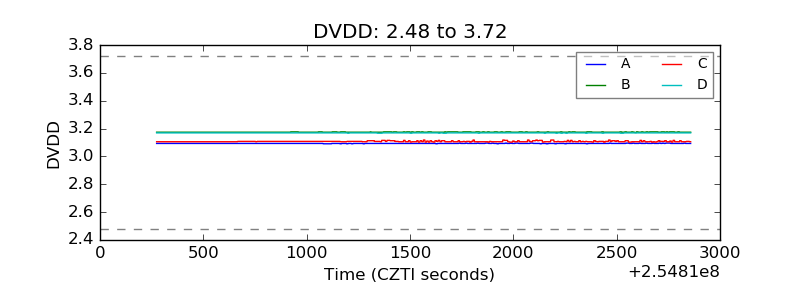 |
| Temperature 1 | 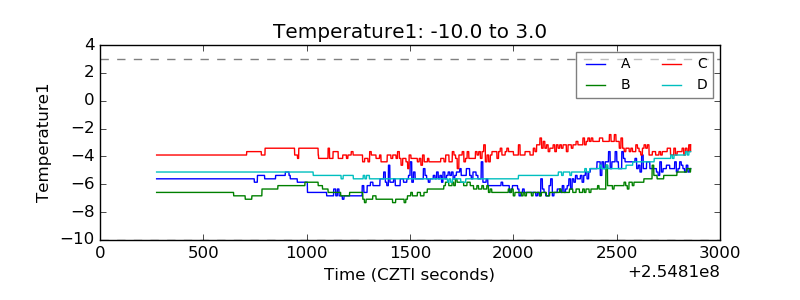 |
| Veto HV Monitor | 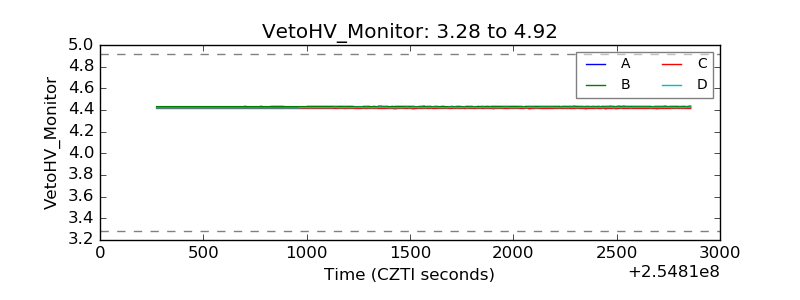 |
| Veto LLD |  |
| Alpha Counter | 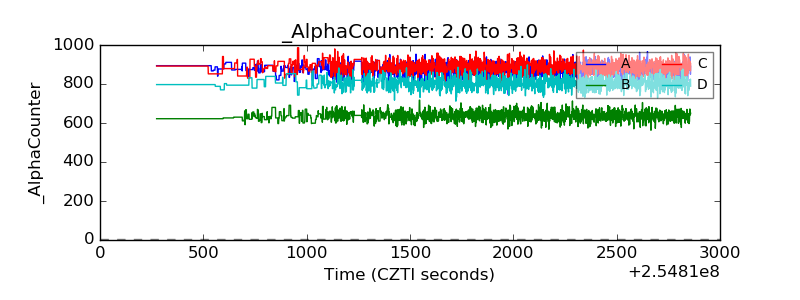 |
| _CPM_Rate | 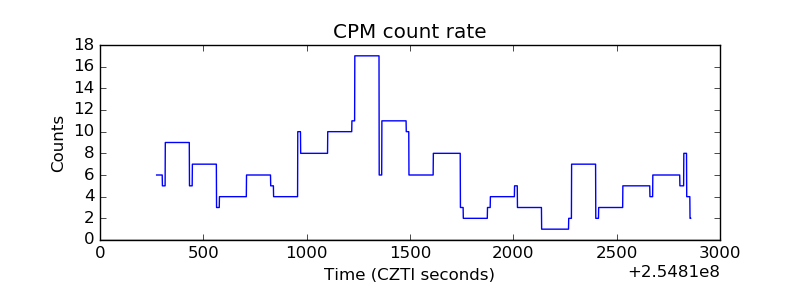 |
| CZT Counter | 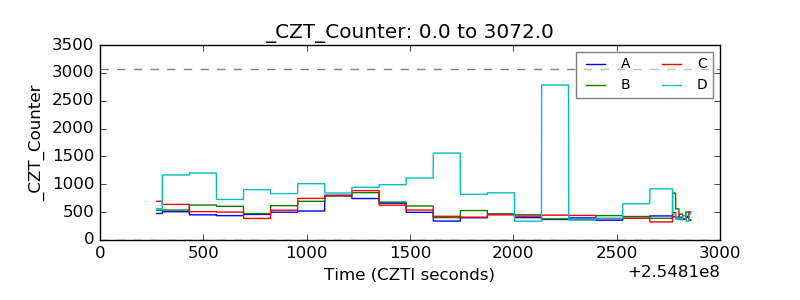 |
| +2.5 Volts monitor |  |
| +5 Volts monitor | 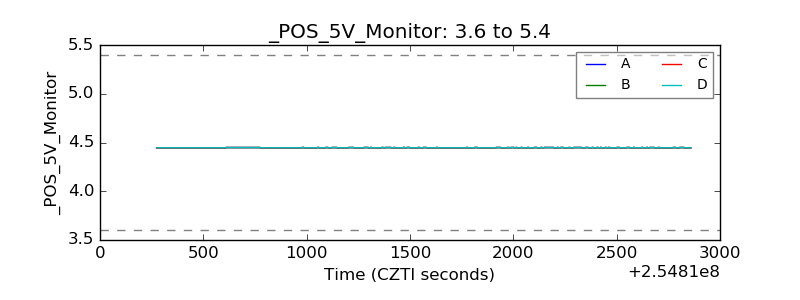 |
| _ROLL_ROT |  |
| _Roll_DEC | 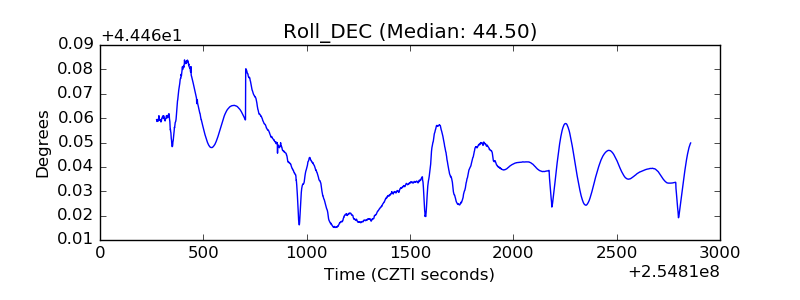 |
| _Roll_RA | 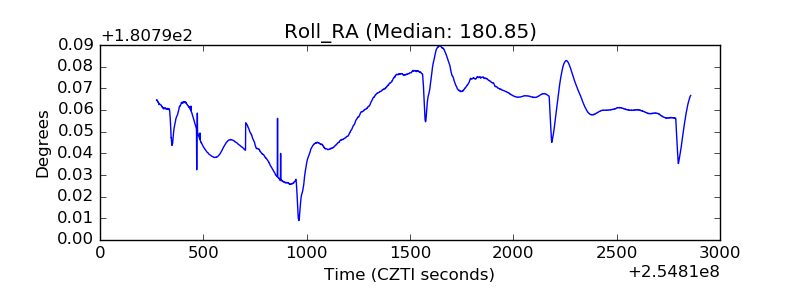 |
| Veto Counter |  |