| Param | Original file | Final file |
|---|---|---|
| Filename | modeM0/AS1G08_071T01_9000001874_12629cztM0_level2.evt | modeM0/AS1G08_071T01_9000001874_12629cztM0_level2_quad_clean.evt |
| Size (bytes) | 1,020,188,160 | 153,947,520 |
| Size | 972.9 MB | 146.8 MB |
| Events in quadrant A | 6,030,264 | 948,475 |
| Events in quadrant B | 7,388,635 | 957,988 |
| Events in quadrant C | 6,092,686 | 961,876 |
| Events in quadrant D | 10,495,498 | 884,404 |
| Mode SS | |||
|---|---|---|---|
| Quadrant | BADHDUFLAG | Total packets | Discarded packets |
| A | 0 | 272 | 0 |
| B | 0 | 272 | 0 |
| C | 0 | 272 | 0 |
| D | 0 | 272 | 0 |
| Mode M0 | |||
|---|---|---|---|
| Quadrant | BADHDUFLAG | Total packets | Discarded packets |
| A | 0 | 26951 | 4 |
| B | 0 | 30323 | 3 |
| C | 0 | 27390 | 3 |
| D | 0 | 40178 | 3 |
| Mode M9 | |||
|---|---|---|---|
| Quadrant | BADHDUFLAG | Total packets | Discarded packets |
| A | 0 | 13 | 0 |
| B | 0 | 13 | 0 |
| C | 0 | 13 | 0 |
| D | 0 | 13 | 0 |
| Quadrant | Total seconds | Saturated seconds | Saturation percentage |
|---|---|---|---|
| A | 13150 | 226 | 1.718631% |
| B | 13150 | 477 | 3.627376% |
| C | 13150 | 153 | 1.163498% |
| D | 13150 | 672 | 5.110266% |
Noise dominated data is calculated using 1-second bins in cleaned event files. If a bin has >2000 counts, and if more than 50% of those come from <1% of pixels, then it is considered to be noise-dominated and hence unusable.
| Quadrant | # 1 sec bins | Bins with >0 counts | Bins with >2000 counts | High rate bins dominated by noise | Noise dominated (total time) | Noise dominated (detector-on time) | Marked lightcurve |
|---|---|---|---|---|---|---|---|
| A | 14586 | 13151 | 5 | 5 | 0.03% | 0.04% | 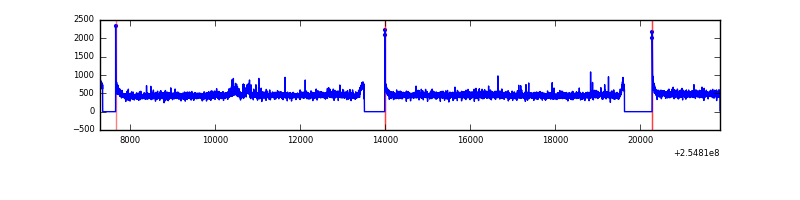 |
| B | 14586 | 13151 | 161 | 161 | 1.10% | 1.22% | 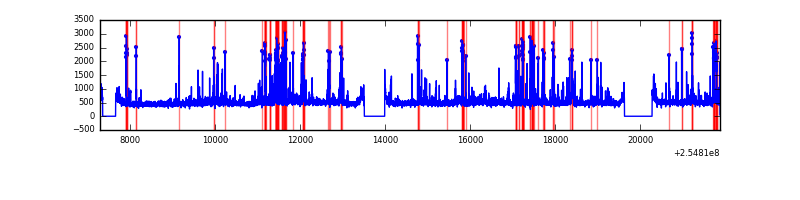 |
| C | 14586 | 13151 | 11 | 11 | 0.08% | 0.08% | 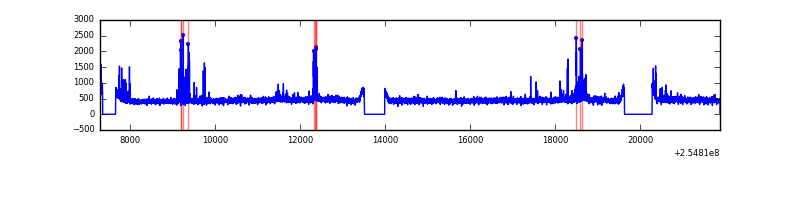 |
| D | 14586 | 13151 | 413 | 413 | 2.83% | 3.14% | 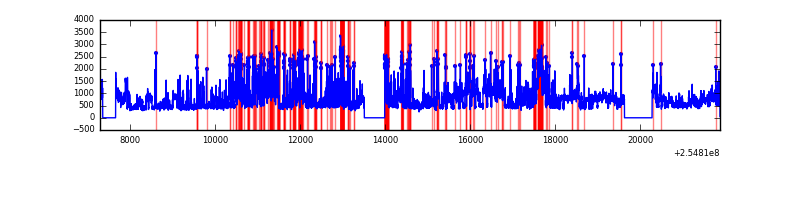 |
Top three noisy pixels from each quadrant. If the there are fewer than three noisy pixels in the level2.evt file, extra rows are filled as -1
| Pixel properties | Quadrant properties | ||||||
|---|---|---|---|---|---|---|---|
| Quadrant | DetID | PixID | Counts | Sigma | Mean | Median | Sigma |
| A | 12 | 189 | 83613 | 262.14 | 1538 | 1501 | 313.2 |
| A | 8 | 192 | 32172 | 97.92 | 1538 | 1501 | 313.2 |
| A | 0 | 226 | 13804 | 39.28 | 1538 | 1501 | 313.2 |
| B | 4 | 239 | 842142 | 2871.4 | 1527 | 1484 | 292.8 |
| B | 11 | 51 | 217259 | 737.01 | 1527 | 1484 | 292.8 |
| B | 3 | 64 | 155424 | 525.8 | 1527 | 1484 | 292.8 |
| C | 15 | 208 | 264142 | 758.46 | 1492 | 1496 | 346.3 |
| C | 13 | 61 | 11007 | 27.47 | 1492 | 1496 | 346.3 |
| C | 8 | 222 | 8901 | 21.38 | 1492 | 1496 | 346.3 |
| D | 10 | 157 | 2274855 | 6472.53 | 1460 | 1417 | 351.2 |
| D | 1 | 52 | 1746124 | 4967.22 | 1460 | 1417 | 351.2 |
| D | 13 | 104 | 413500 | 1173.21 | 1460 | 1417 | 351.2 |
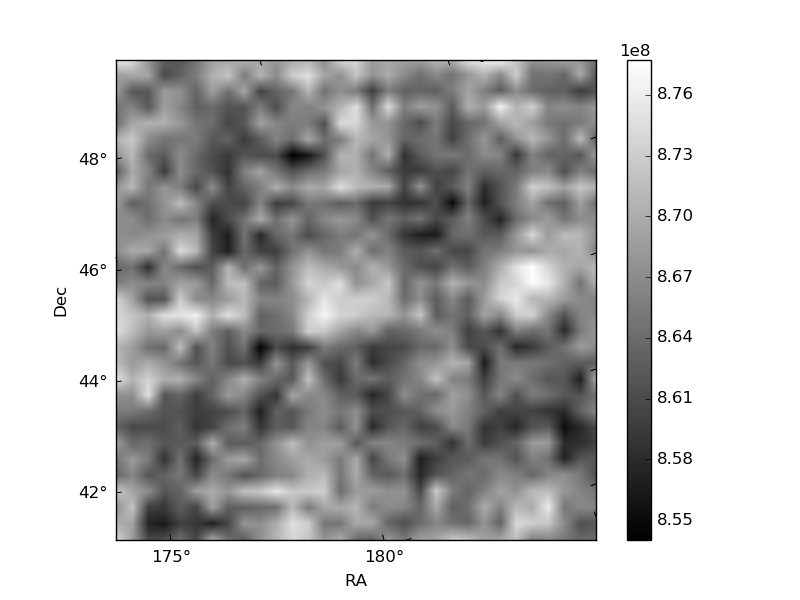
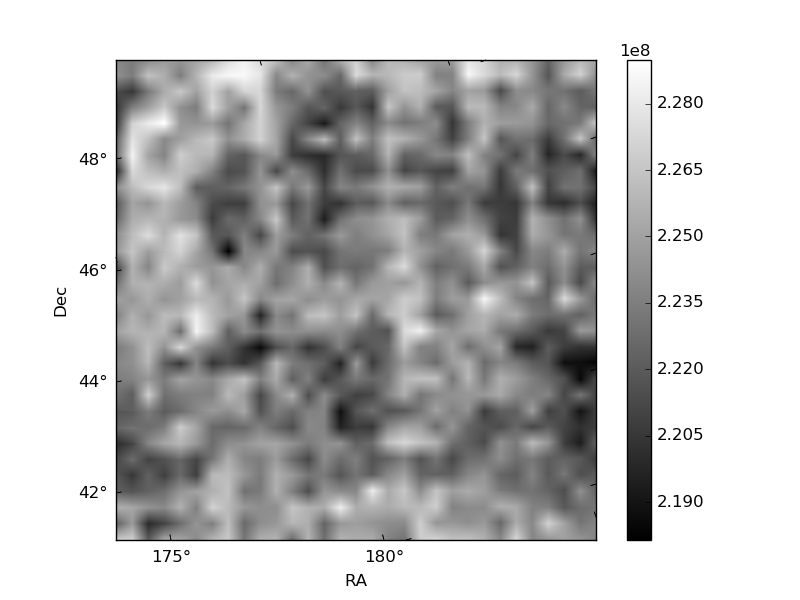
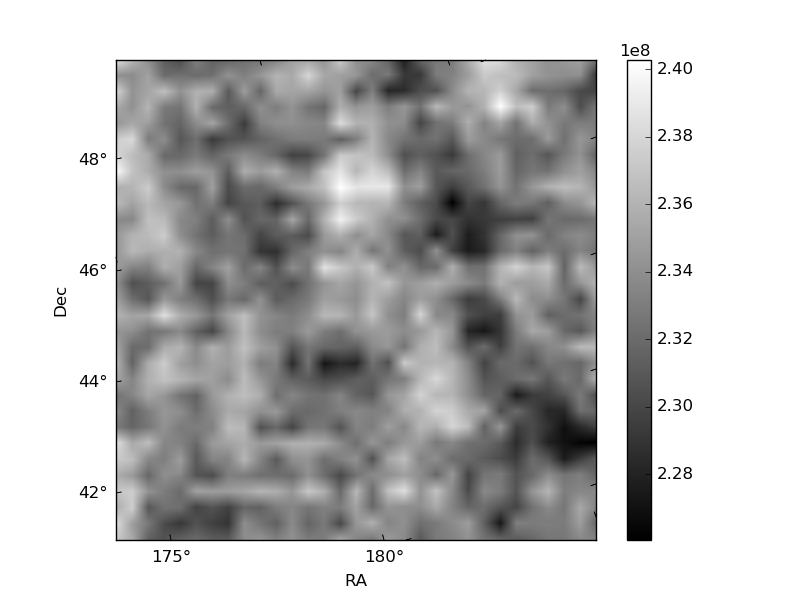
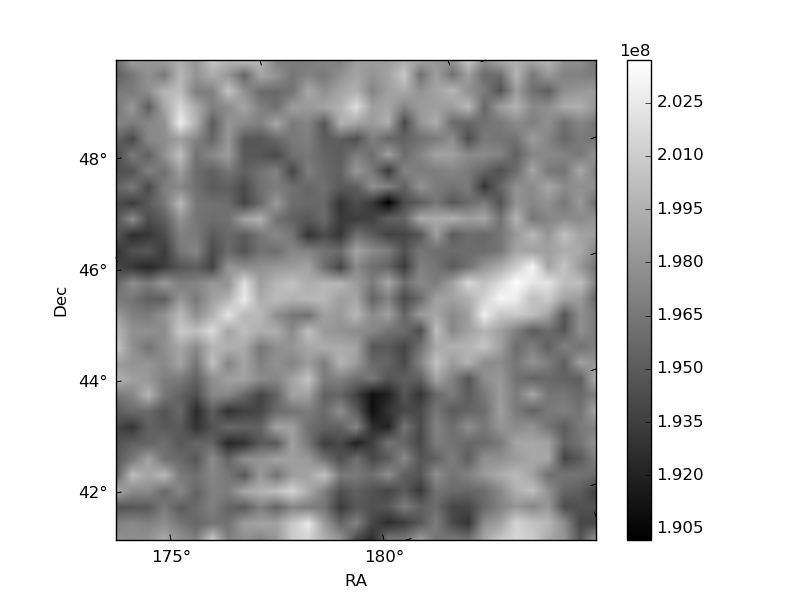
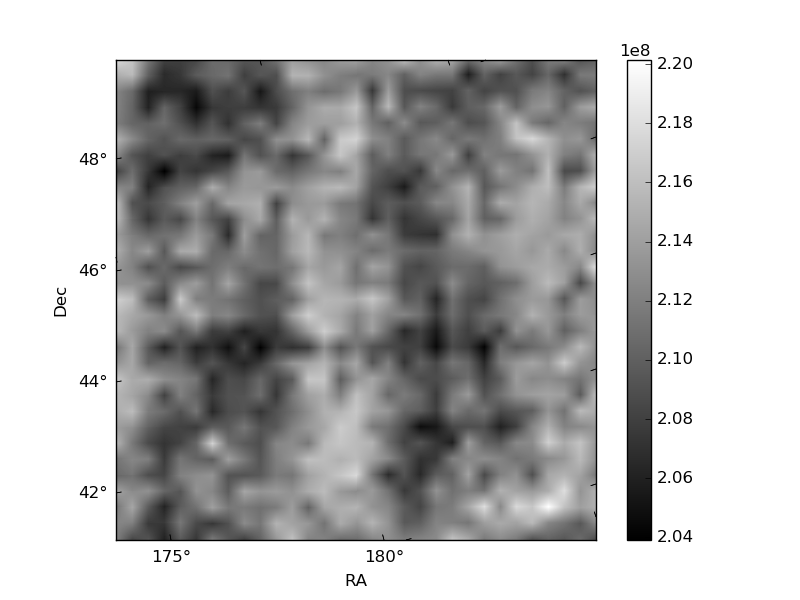
Histogram calculated using DETX and DETY for each event in the final _common_clean file
| Quadrant A | 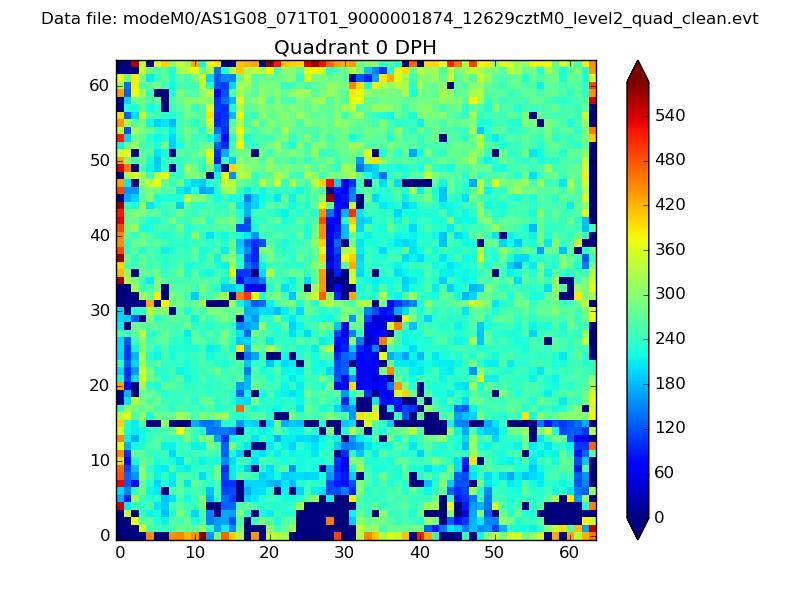 |
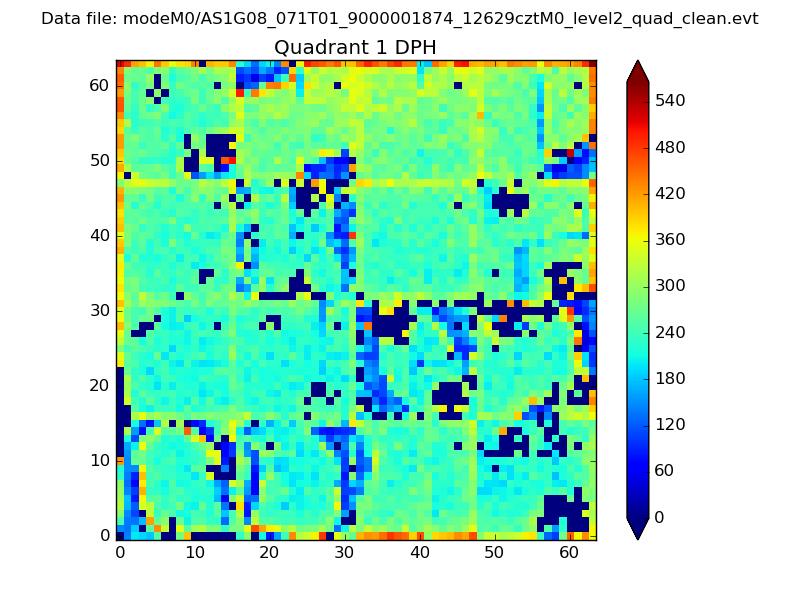 |
Quadrant B |
|---|---|---|---|
| Quadrant D |  |
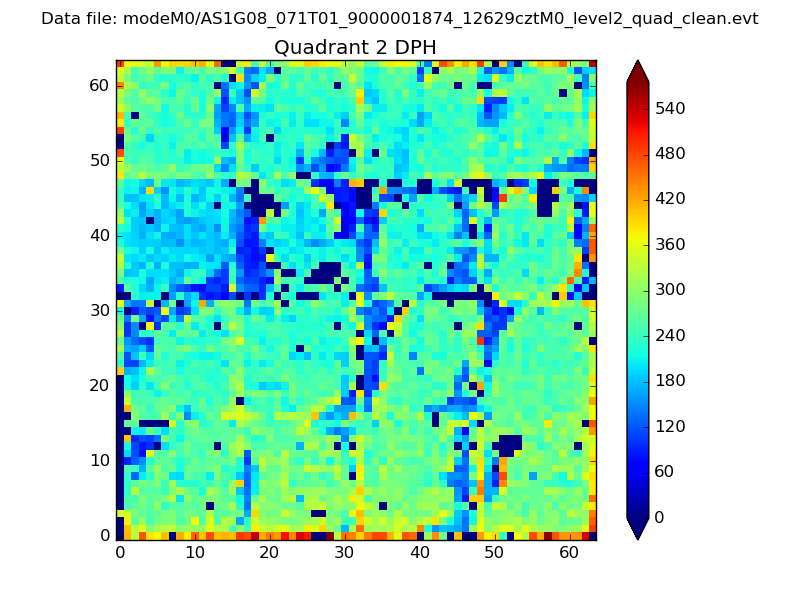 |
Quadrant C |
| Plot type | Count rate plots | Images |
|---|---|---|
| Comparison with Poisson distribution Blue bars denote a histogram of data divided into 1 sec bins. Red curve is a Poisson curve with rate = median count rate of data. |
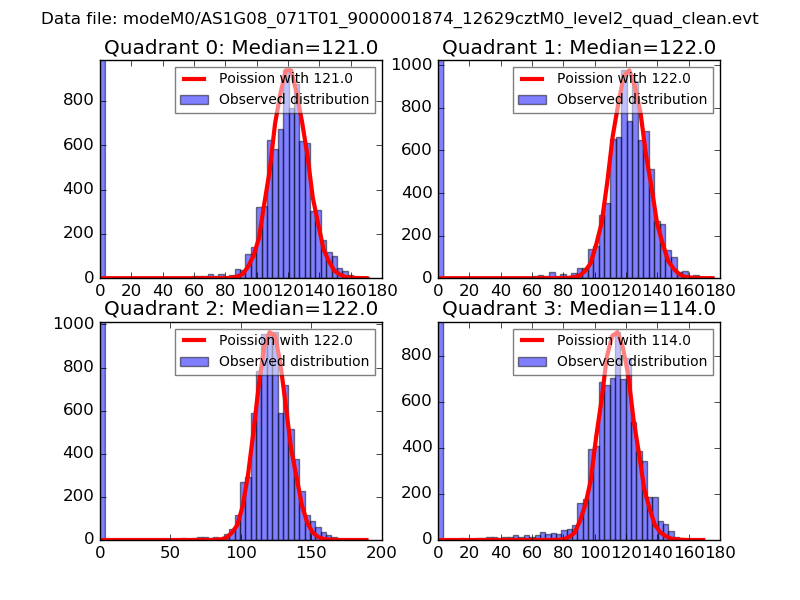 |
 |
| Quadrant-wise count rates Data is divided into 100 sec bins |
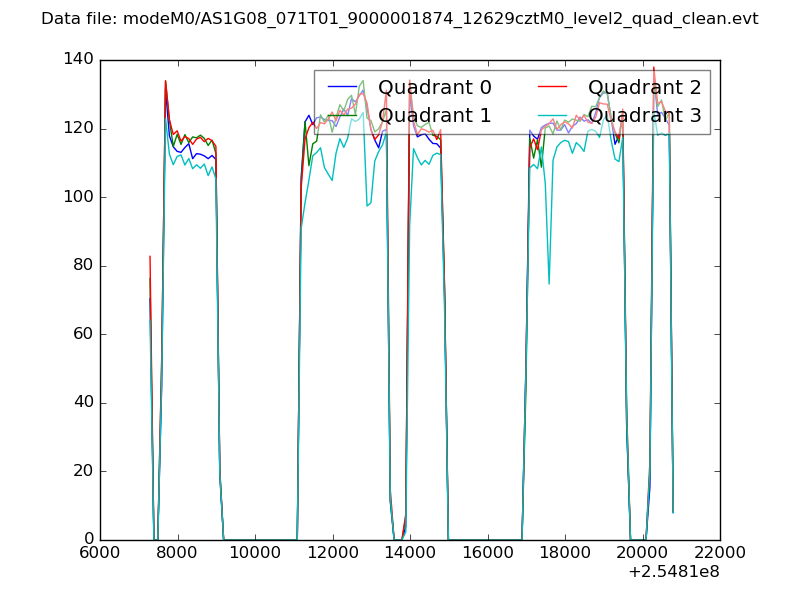 |
|
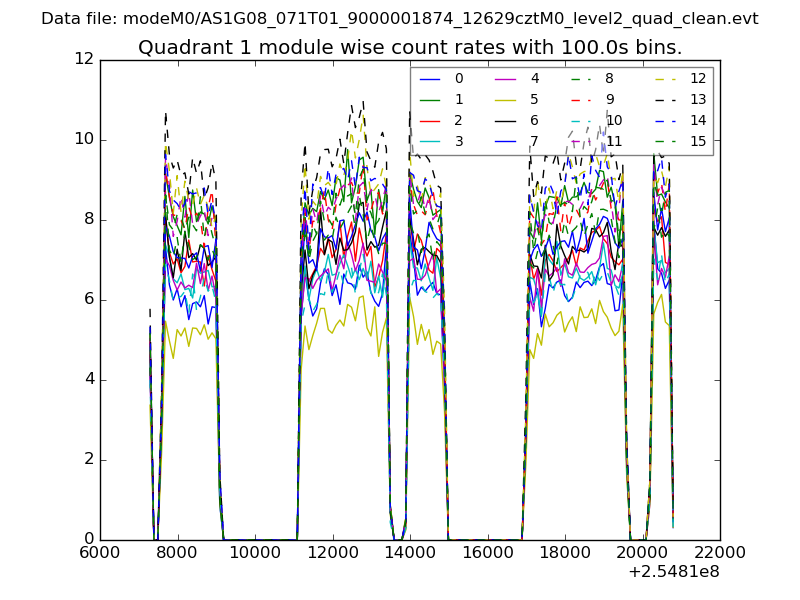
| Module-wise count rates for Quadrant A Data is divided into 100 sec bins |
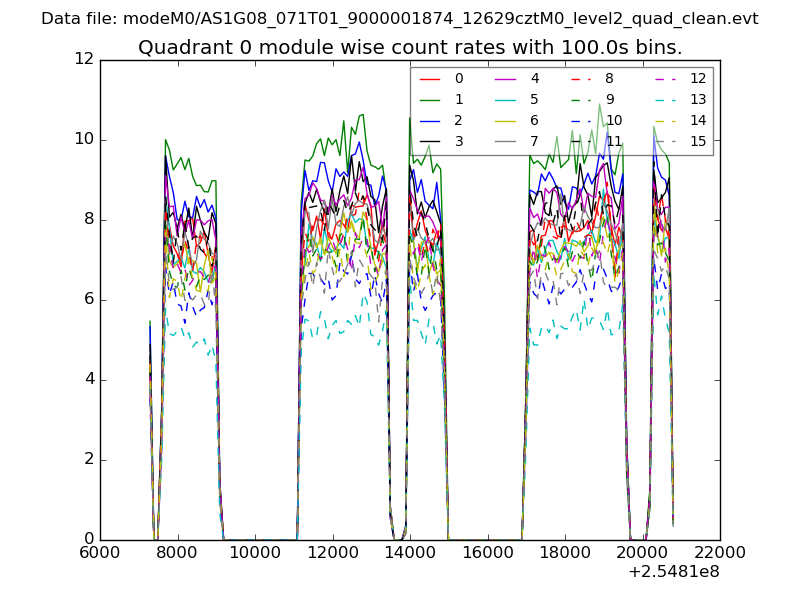 |
 |
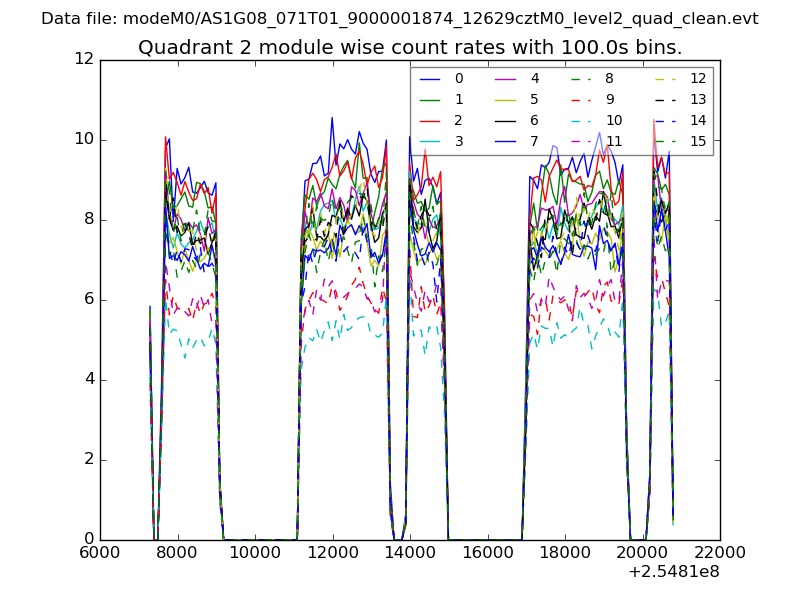
| Module-wise count rates for Quadrant B Data is divided into 100 sec bins |
 |
 |
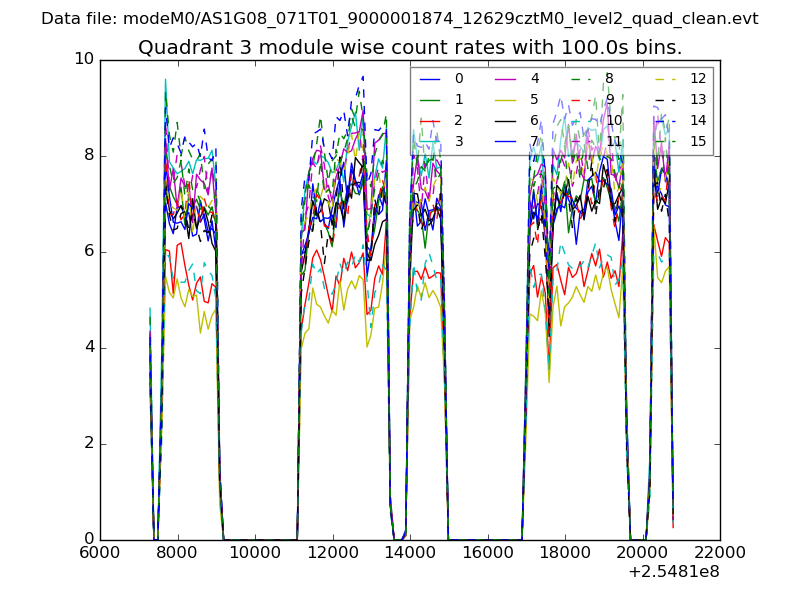
| Module-wise count rates for Quadrant C Data is divided into 100 sec bins |
 |
 |
| Module-wise count rates for Quadrant D Data is divided into 100 sec bins |
 |
 |
| Parameter | Plot |
|---|---|
| CZT HV Monitor | 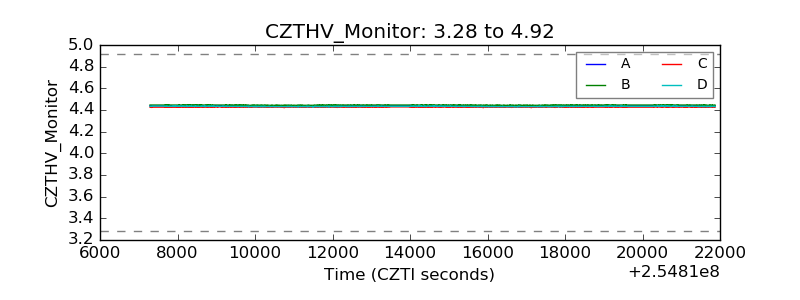 |
| D_VDD | 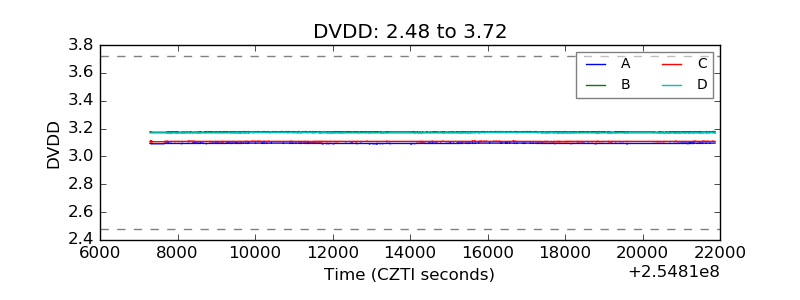 |
| Temperature 1 |  |
| Veto HV Monitor | 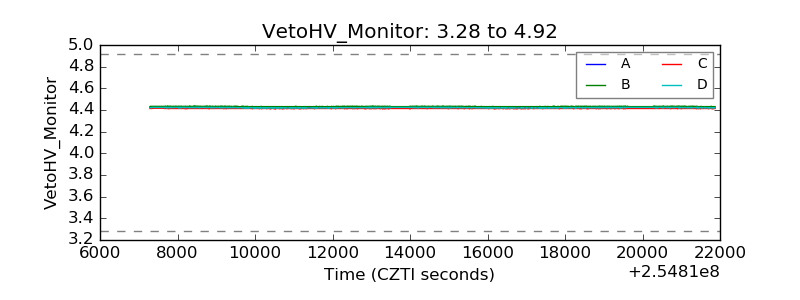 |
| Veto LLD | 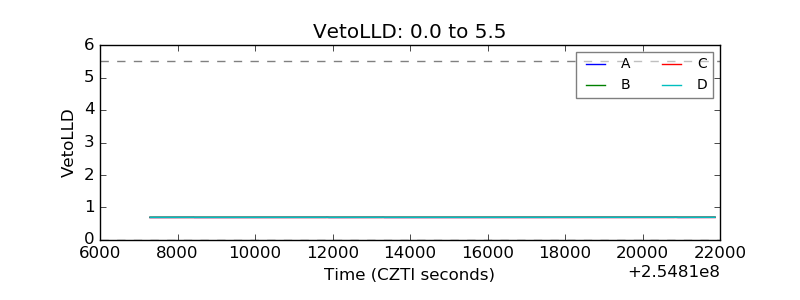 |
| Alpha Counter | 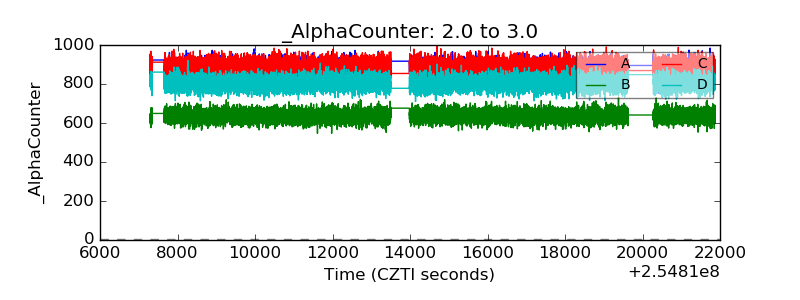 |
| _CPM_Rate | 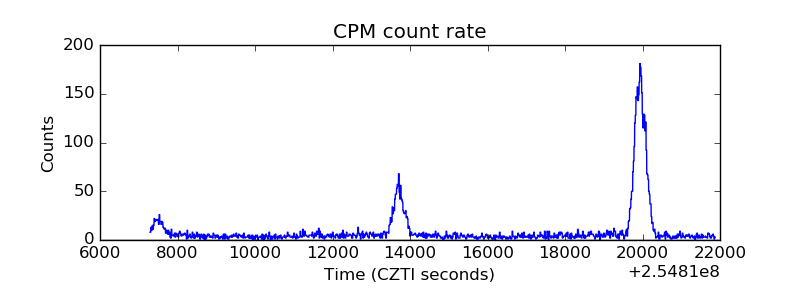 |
| CZT Counter | 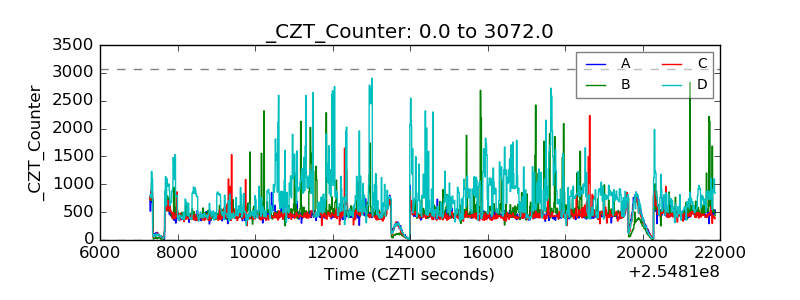 |
| +2.5 Volts monitor |  |
| +5 Volts monitor |  |
| _ROLL_ROT | 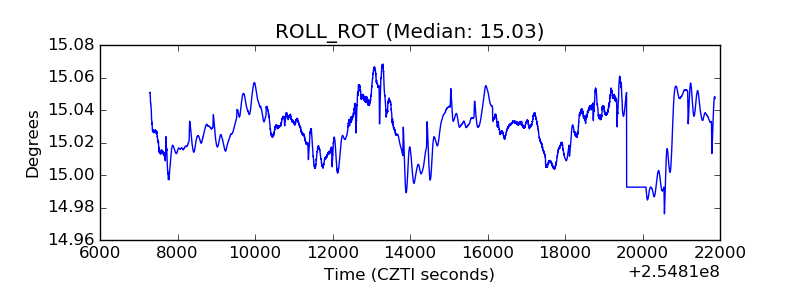 |
| _Roll_DEC | 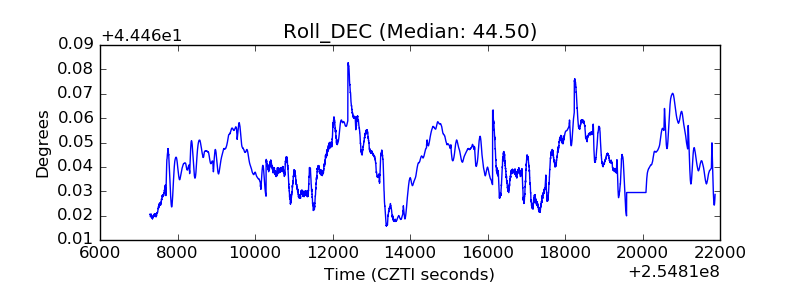 |
| _Roll_RA | 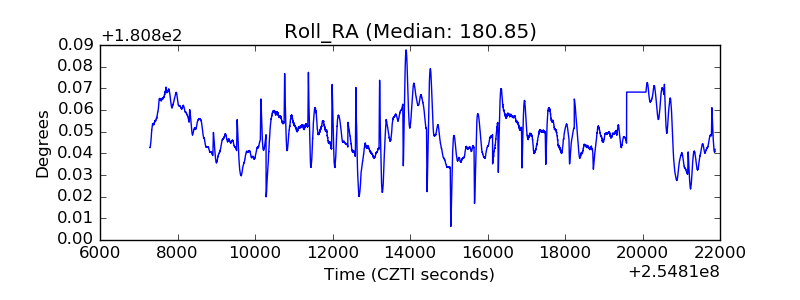 |
| Veto Counter | 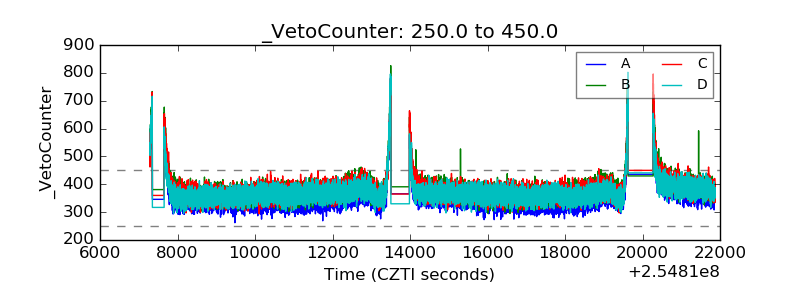 |