| Param | Original file | Final file |
|---|---|---|
| Filename | modeM0/AS1G08_071T01_9000001874_12633cztM0_level2.evt | modeM0/AS1G08_071T01_9000001874_12633cztM0_level2_quad_clean.evt |
| Size (bytes) | 567,267,840 | 71,245,440 |
| Size | 541.0 MB | 67.9 MB |
| Events in quadrant A | 3,127,079 | 432,412 |
| Events in quadrant B | 4,910,975 | 425,911 |
| Events in quadrant C | 3,331,412 | 437,396 |
| Events in quadrant D | 5,375,401 | 413,661 |
| Mode SS | |||
|---|---|---|---|
| Quadrant | BADHDUFLAG | Total packets | Discarded packets |
| A | 0 | 132 | 0 |
| B | 0 | 132 | 0 |
| C | 0 | 132 | 0 |
| D | 0 | 132 | 0 |
| Mode M0 | |||
|---|---|---|---|
| Quadrant | BADHDUFLAG | Total packets | Discarded packets |
| A | 0 | 13640 | 3 |
| B | 0 | 19064 | 2 |
| C | 0 | 14269 | 2 |
| D | 0 | 20419 | 2 |
| Mode M9 | |||
|---|---|---|---|
| Quadrant | BADHDUFLAG | Total packets | Discarded packets |
| A | 0 | 22 | 0 |
| B | 0 | 22 | 0 |
| C | 0 | 22 | 0 |
| D | 0 | 22 | 0 |
| Quadrant | Total seconds | Saturated seconds | Saturation percentage |
|---|---|---|---|
| A | 6420 | 87 | 1.355140% |
| B | 6420 | 432 | 6.728972% |
| C | 6420 | 97 | 1.510903% |
| D | 6420 | 488 | 7.601246% |
Noise dominated data is calculated using 1-second bins in cleaned event files. If a bin has >2000 counts, and if more than 50% of those come from <1% of pixels, then it is considered to be noise-dominated and hence unusable.
| Quadrant | # 1 sec bins | Bins with >0 counts | Bins with >2000 counts | High rate bins dominated by noise | Noise dominated (total time) | Noise dominated (detector-on time) | Marked lightcurve |
|---|---|---|---|---|---|---|---|
| A | 8586 | 6421 | 0 | 0 | 0.00% | 0.00% | 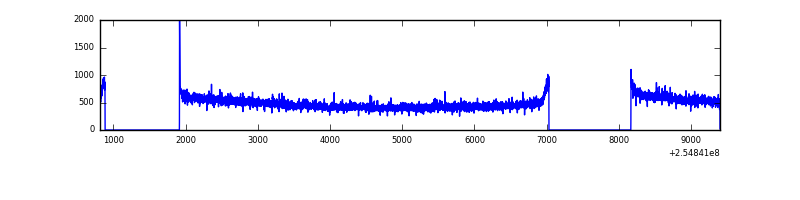 |
| B | 8585 | 6420 | 216 | 216 | 2.52% | 3.36% | 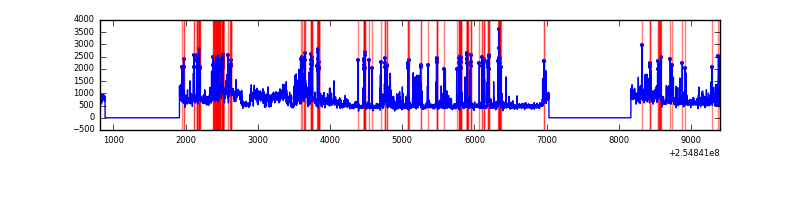 |
| C | 8586 | 6421 | 24 | 24 | 0.28% | 0.37% | 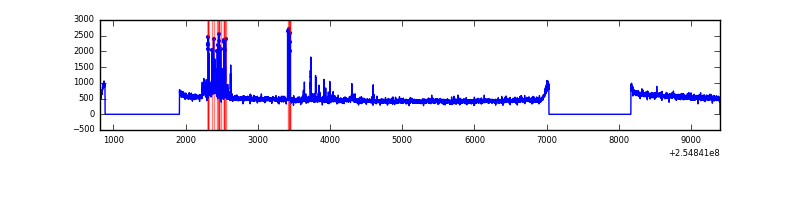 |
| D | 8586 | 6421 | 277 | 277 | 3.23% | 4.31% | 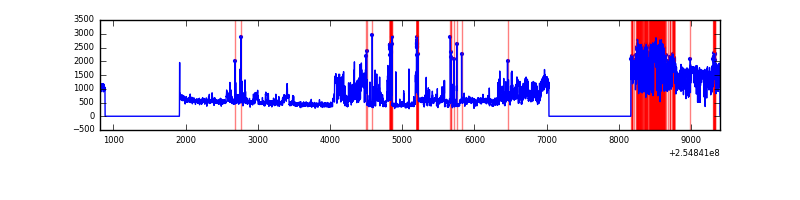 |
Top three noisy pixels from each quadrant. If the there are fewer than three noisy pixels in the level2.evt file, extra rows are filled as -1
| Pixel properties | Quadrant properties | ||||||
|---|---|---|---|---|---|---|---|
| Quadrant | DetID | PixID | Counts | Sigma | Mean | Median | Sigma |
| A | 8 | 192 | 7548 | 41.26 | 809 | 793 | 163.7 |
| A | 0 | 226 | 7238 | 39.36 | 809 | 793 | 163.7 |
| A | 8 | 15 | 6516 | 34.95 | 809 | 793 | 163.7 |
| B | 4 | 239 | 923970 | 6159.08 | 794 | 776 | 149.9 |
| B | 4 | 206 | 564240 | 3759.15 | 794 | 776 | 149.9 |
| B | 4 | 81 | 101766 | 673.75 | 794 | 776 | 149.9 |
| C | 15 | 208 | 210081 | 1148.99 | 793 | 797 | 182.1 |
| C | 14 | 234 | 23752 | 126.02 | 793 | 797 | 182.1 |
| C | 13 | 61 | 5817 | 27.56 | 793 | 797 | 182.1 |
| D | 1 | 52 | 1653211 | 8996.51 | 767 | 747 | 183.7 |
| D | 10 | 157 | 610137 | 3317.7 | 767 | 747 | 183.7 |
| D | 2 | 14 | 124976 | 676.34 | 767 | 747 | 183.7 |
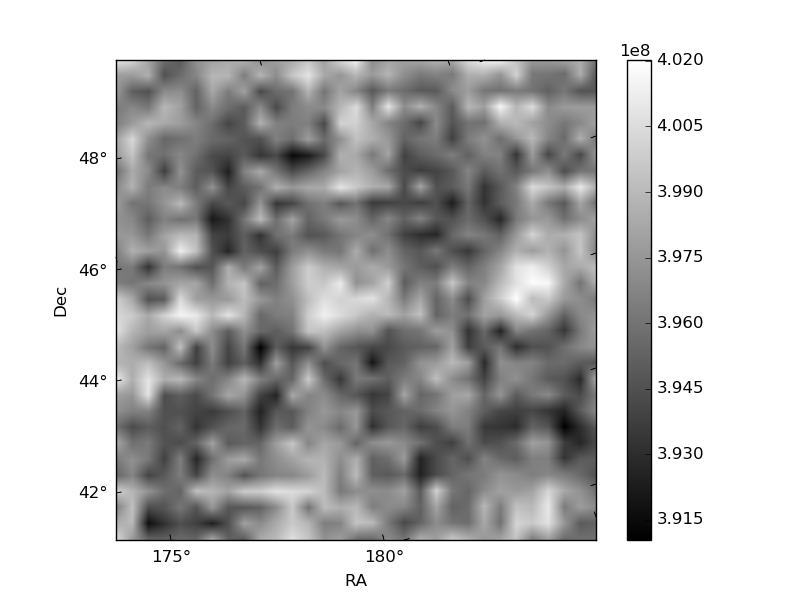
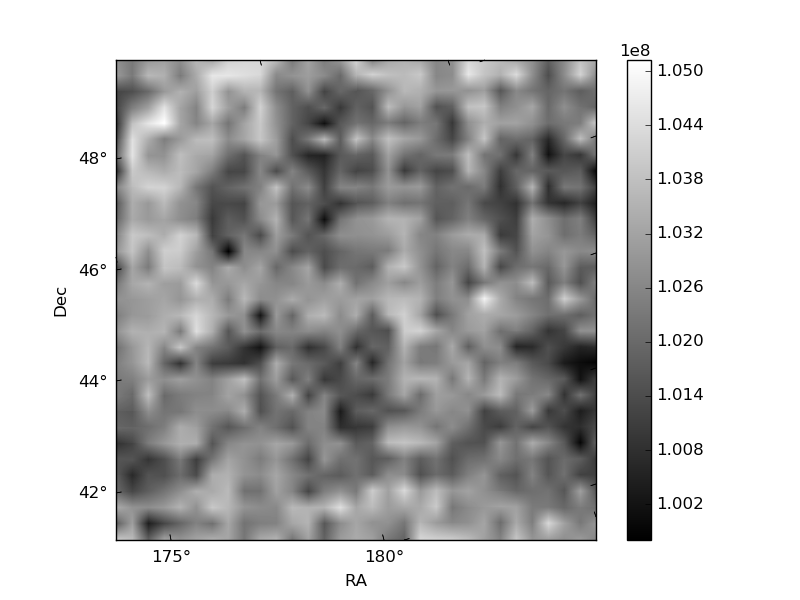
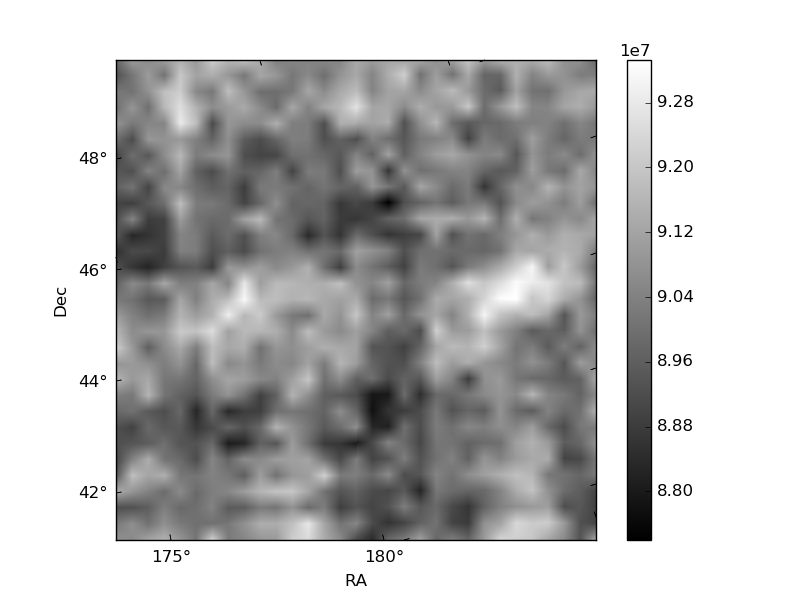
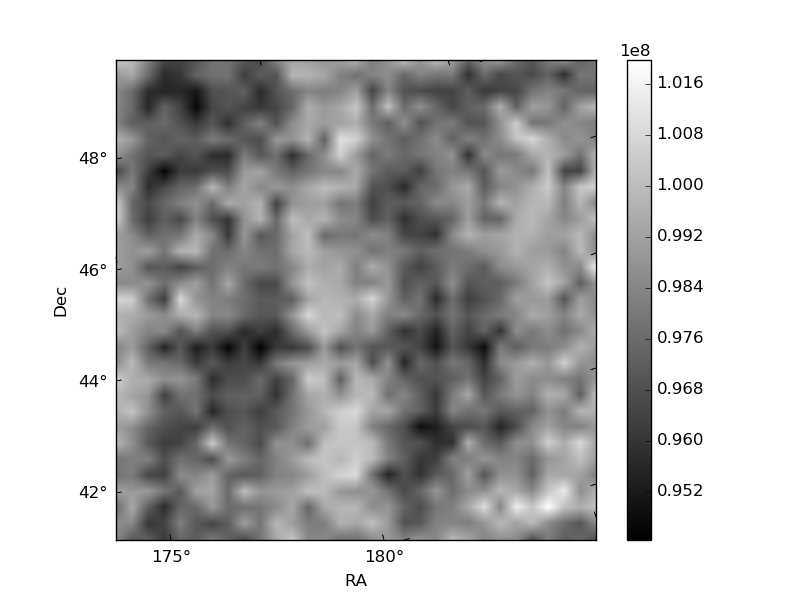
Histogram calculated using DETX and DETY for each event in the final _common_clean file
| Quadrant A | 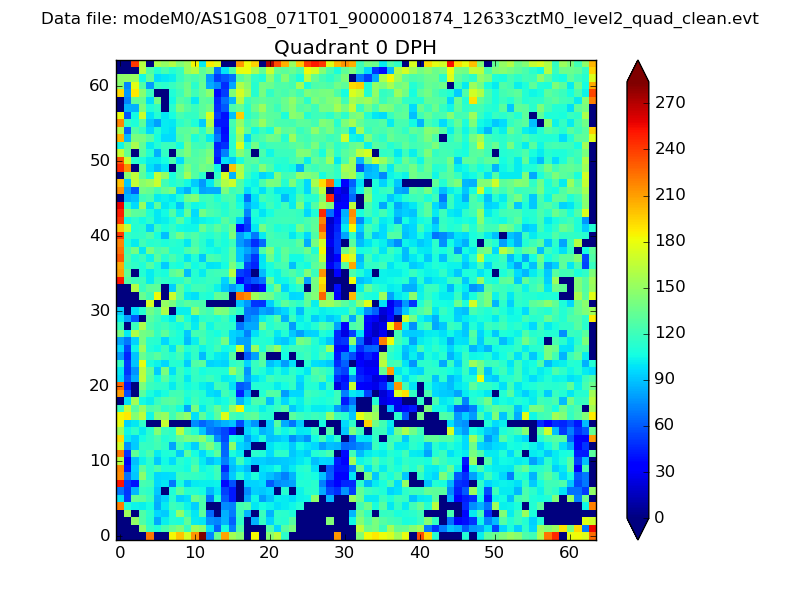 |
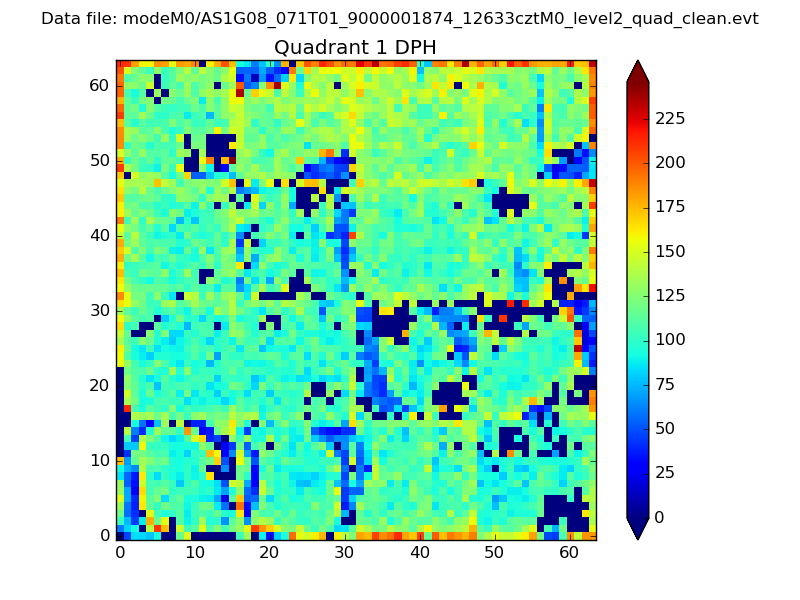 |
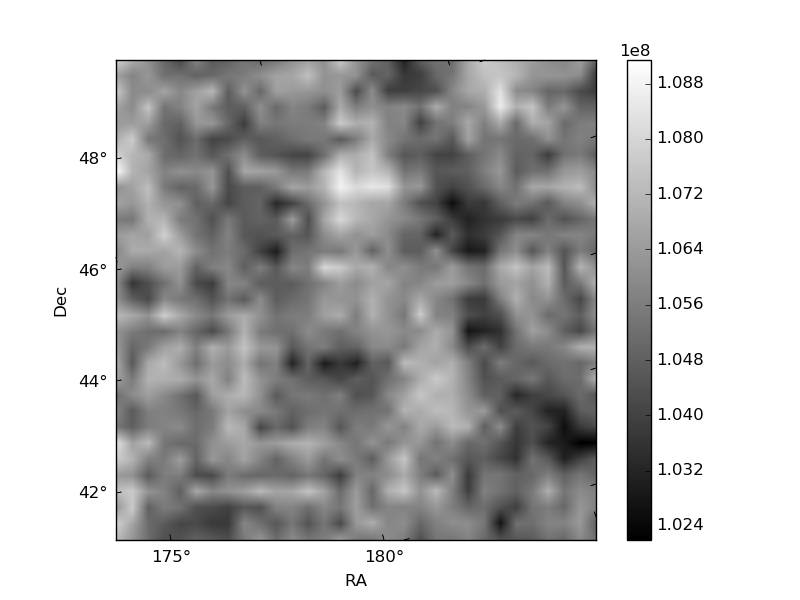
Quadrant B |
|---|---|---|---|
| Quadrant D | 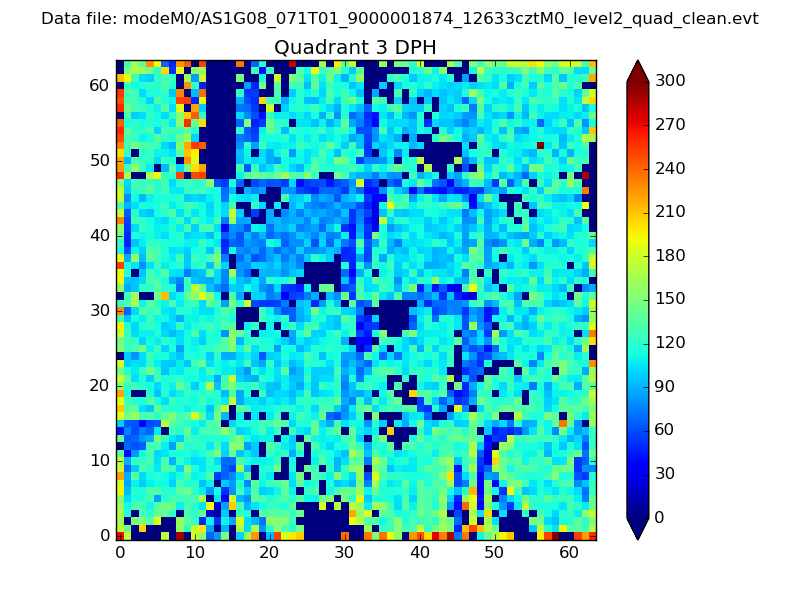 |
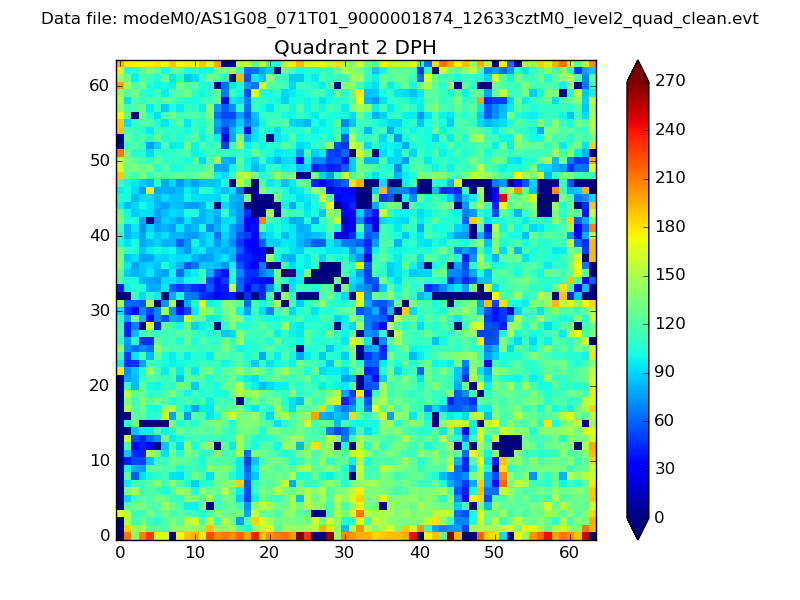 |
Quadrant C |
| Plot type | Count rate plots | Images |
|---|---|---|
| Comparison with Poisson distribution Blue bars denote a histogram of data divided into 1 sec bins. Red curve is a Poisson curve with rate = median count rate of data. |
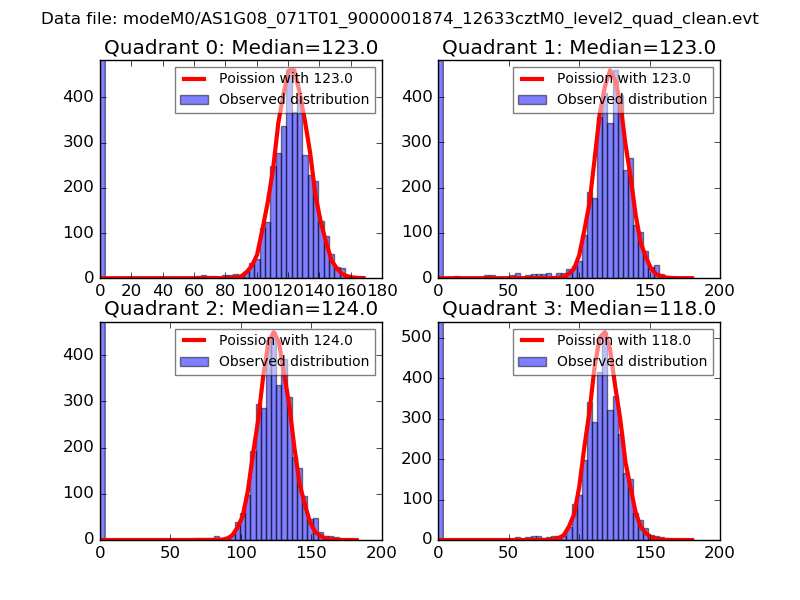 |
 |
| Quadrant-wise count rates Data is divided into 100 sec bins |
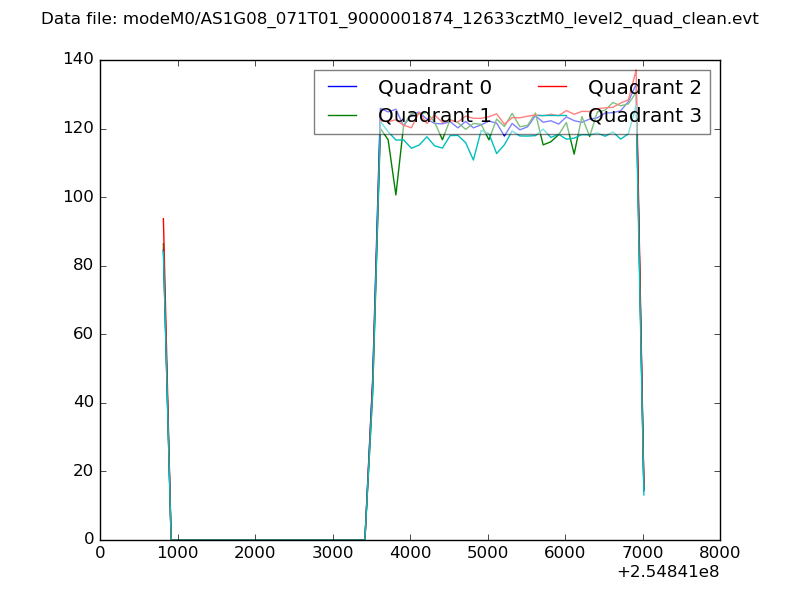 |
|
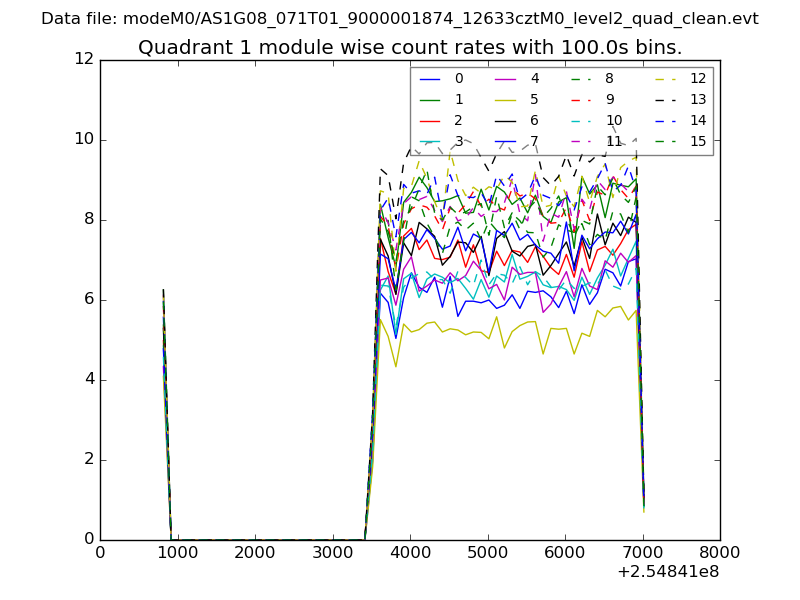
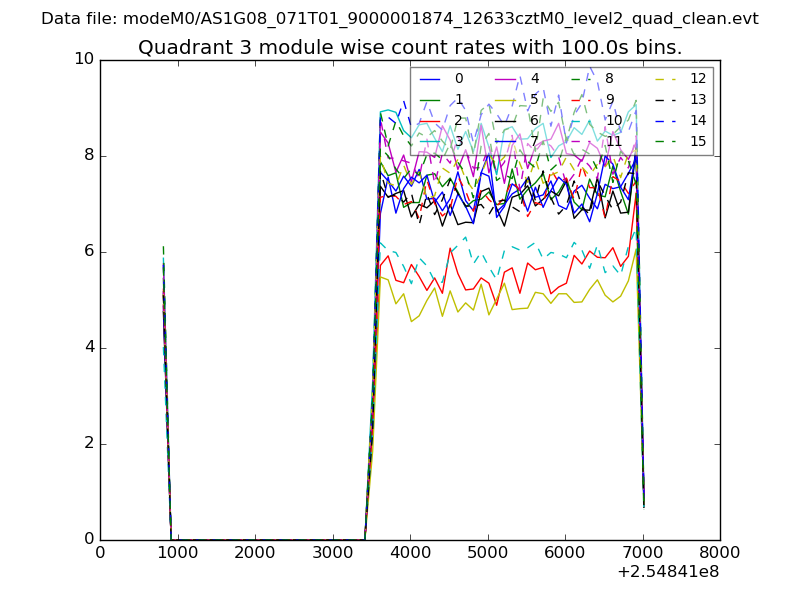
| Module-wise count rates for Quadrant A Data is divided into 100 sec bins |
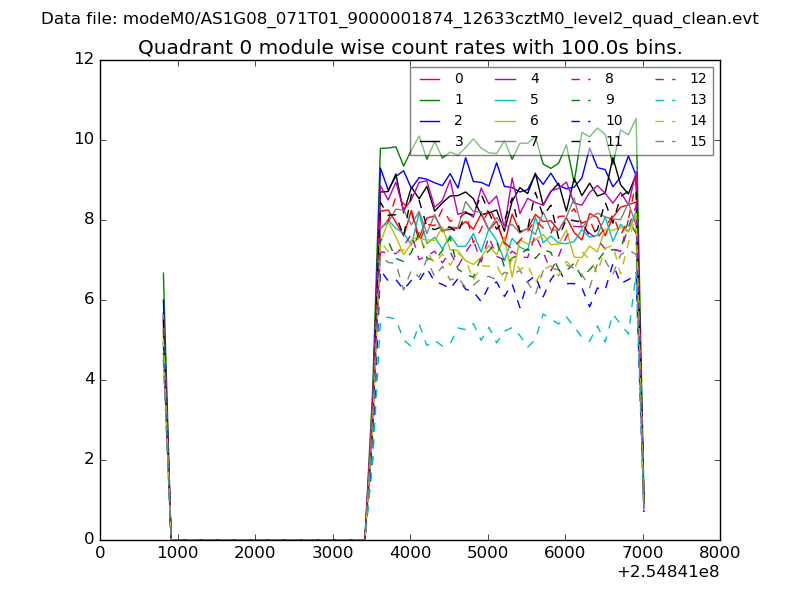 |
 |
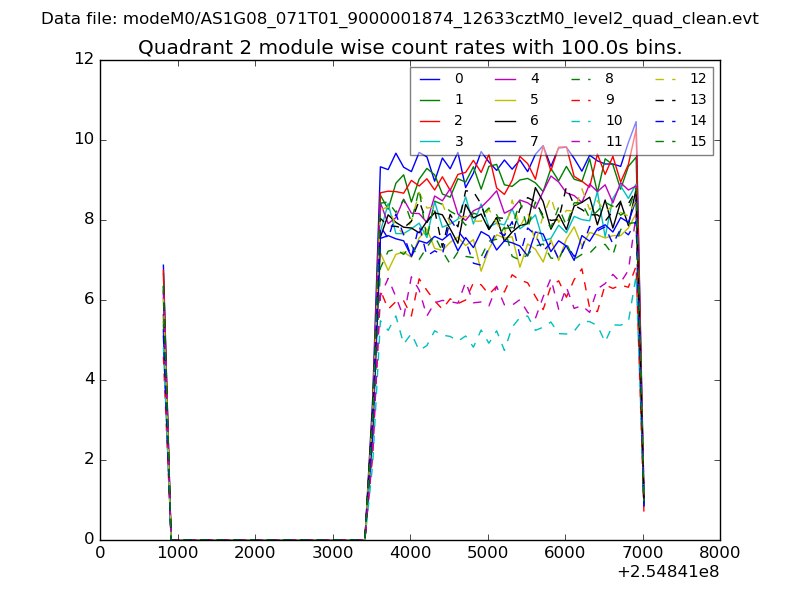
| Module-wise count rates for Quadrant B Data is divided into 100 sec bins |
 |
 |
| Module-wise count rates for Quadrant C Data is divided into 100 sec bins |
 |
 |
| Module-wise count rates for Quadrant D Data is divided into 100 sec bins |
 |
 |
| Parameter | Plot |
|---|---|
| CZT HV Monitor | 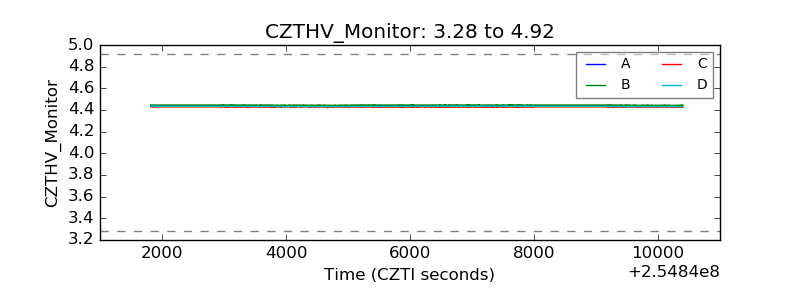 |
| D_VDD | 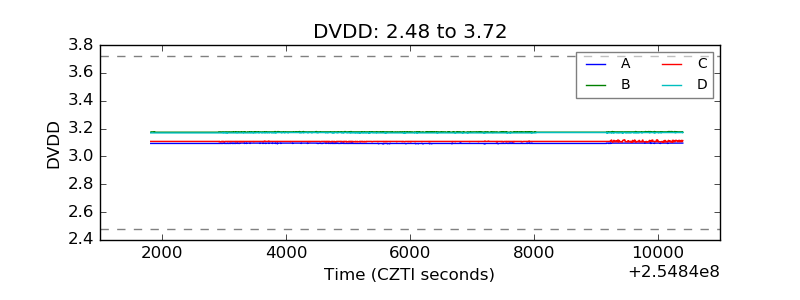 |
| Temperature 1 | 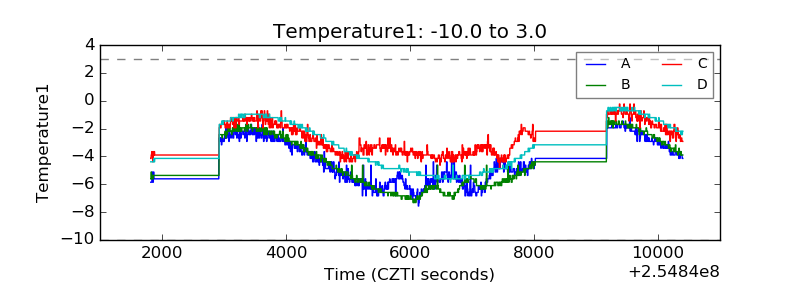 |
| Veto HV Monitor | 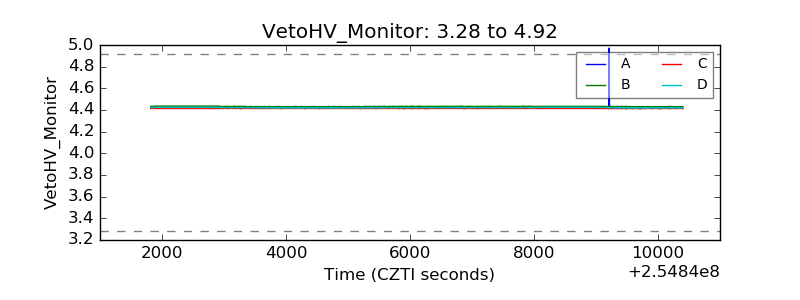 |
| Veto LLD | 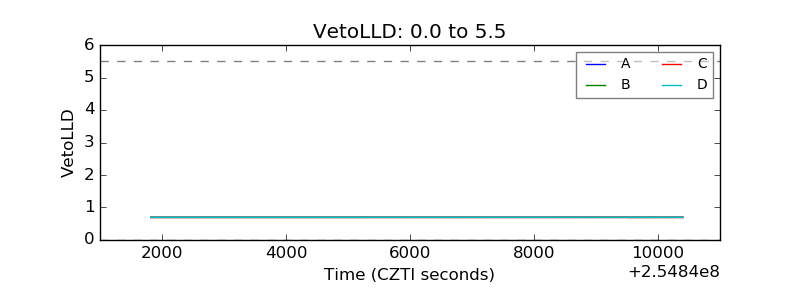 |
| Alpha Counter | 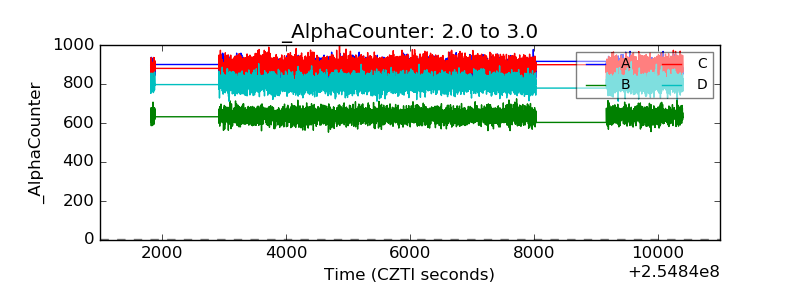 |
| _CPM_Rate |  |
| CZT Counter | 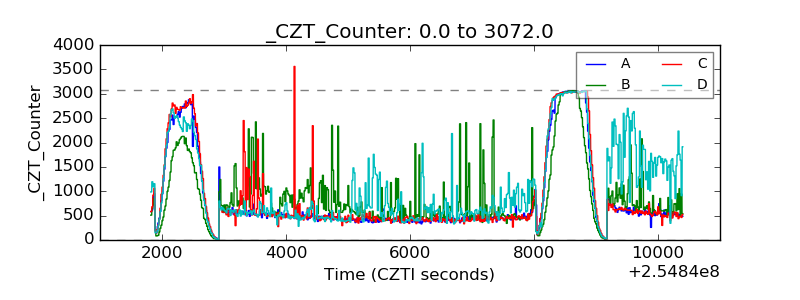 |
| +2.5 Volts monitor |  |
| +5 Volts monitor |  |
| _ROLL_ROT | 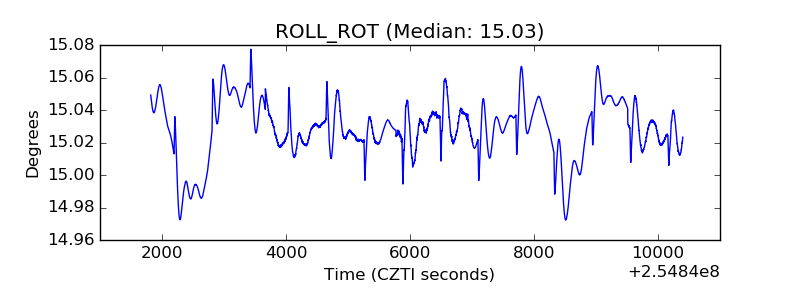 |
| _Roll_DEC | 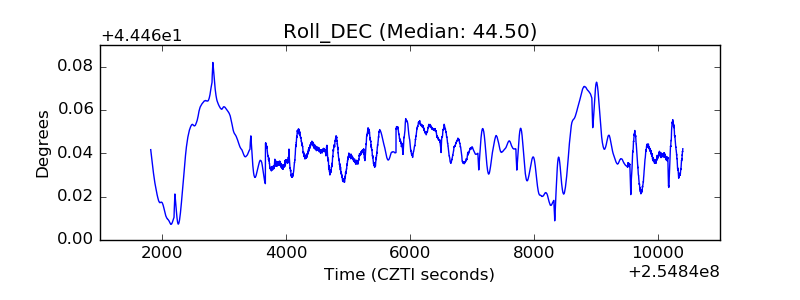 |
| _Roll_RA | 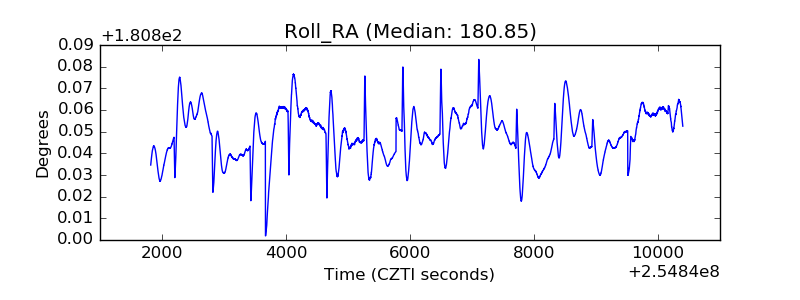 |
| Veto Counter | 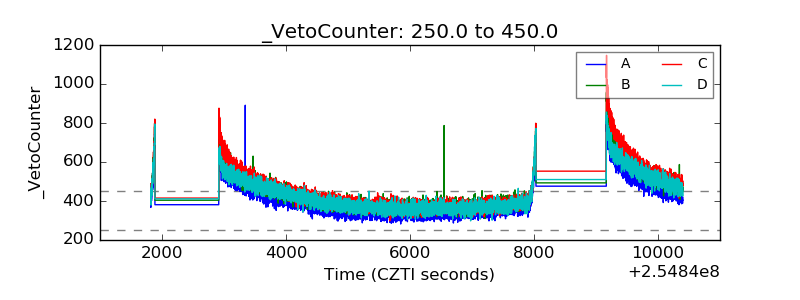 |