| Param | Original file | Final file |
|---|---|---|
| Filename | modeM0/AS1G08_071T01_9000001874_12635cztM0_level2.evt | modeM0/AS1G08_071T01_9000001874_12635cztM0_level2_quad_clean.evt |
| Size (bytes) | 515,381,760 | 97,125,120 |
| Size | 491.5 MB | 92.6 MB |
| Events in quadrant A | 3,119,549 | 633,722 |
| Events in quadrant B | 4,681,779 | 615,236 |
| Events in quadrant C | 3,221,826 | 650,834 |
| Events in quadrant D | 4,166,021 | 609,792 |
| Mode SS | |||
|---|---|---|---|
| Quadrant | BADHDUFLAG | Total packets | Discarded packets |
| A | 0 | 126 | 0 |
| B | 0 | 126 | 0 |
| C | 0 | 126 | 0 |
| D | 0 | 126 | 0 |
| Mode M0 | |||
|---|---|---|---|
| Quadrant | BADHDUFLAG | Total packets | Discarded packets |
| A | 0 | 13389 | 3 |
| B | 0 | 18146 | 2 |
| C | 0 | 13693 | 2 |
| D | 0 | 16798 | 2 |
| Mode M9 | |||
|---|---|---|---|
| Quadrant | BADHDUFLAG | Total packets | Discarded packets |
| A | 0 | 21 | 0 |
| B | 0 | 21 | 0 |
| C | 0 | 21 | 0 |
| D | 0 | 22 | 0 |
| Quadrant | Total seconds | Saturated seconds | Saturation percentage |
|---|---|---|---|
| A | 6182 | 24 | 0.388224% |
| B | 6182 | 484 | 7.829181% |
| C | 6182 | 34 | 0.549984% |
| D | 6182 | 113 | 1.827887% |
Noise dominated data is calculated using 1-second bins in cleaned event files. If a bin has >2000 counts, and if more than 50% of those come from <1% of pixels, then it is considered to be noise-dominated and hence unusable.
| Quadrant | # 1 sec bins | Bins with >0 counts | Bins with >2000 counts | High rate bins dominated by noise | Noise dominated (total time) | Noise dominated (detector-on time) | Marked lightcurve |
|---|---|---|---|---|---|---|---|
| A | 7548 | 6184 | 0 | 0 | 0.00% | 0.00% | 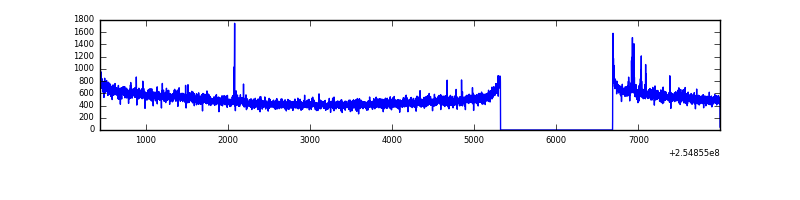 |
| B | 7548 | 6184 | 335 | 335 | 4.44% | 5.42% | 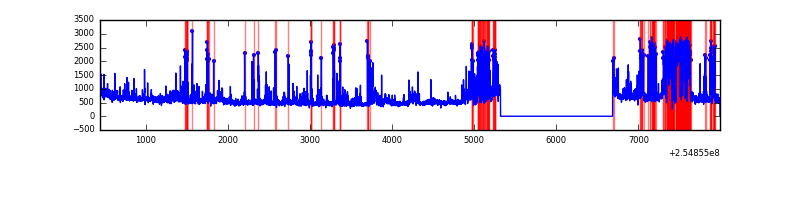 |
| C | 7548 | 6184 | 14 | 14 | 0.19% | 0.23% | 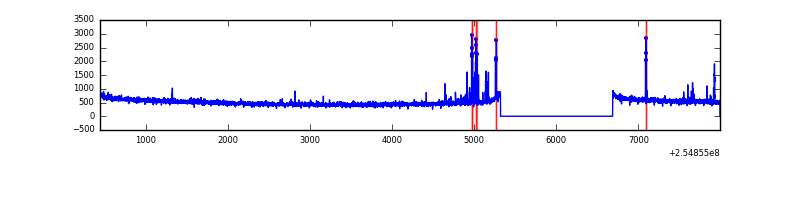 |
| D | 7548 | 6184 | 106 | 106 | 1.40% | 1.71% | 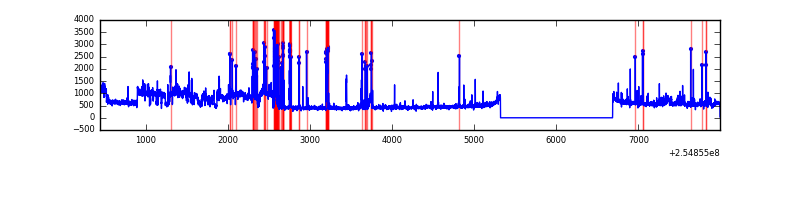 |
Top three noisy pixels from each quadrant. If the there are fewer than three noisy pixels in the level2.evt file, extra rows are filled as -1
| Pixel properties | Quadrant properties | ||||||
|---|---|---|---|---|---|---|---|
| Quadrant | DetID | PixID | Counts | Sigma | Mean | Median | Sigma |
| A | 8 | 15 | 27689 | 169.1 | 797 | 782 | 159.1 |
| A | 12 | 189 | 20100 | 121.4 | 797 | 782 | 159.1 |
| A | 13 | 248 | 7999 | 45.35 | 797 | 782 | 159.1 |
| B | 4 | 239 | 1020339 | 7037.09 | 778 | 763 | 144.9 |
| B | 0 | 85 | 290794 | 2001.79 | 778 | 763 | 144.9 |
| B | 11 | 51 | 109497 | 750.48 | 778 | 763 | 144.9 |
| C | 15 | 208 | 111409 | 610.81 | 793 | 800 | 181.1 |
| C | 12 | 4 | 14014 | 72.97 | 793 | 800 | 181.1 |
| C | 13 | 61 | 5711 | 27.12 | 793 | 800 | 181.1 |
| D | 10 | 157 | 625694 | 3365.89 | 779 | 759 | 185.7 |
| D | 1 | 52 | 255804 | 1373.67 | 779 | 759 | 185.7 |
| D | 1 | 255 | 170657 | 915.07 | 779 | 759 | 185.7 |
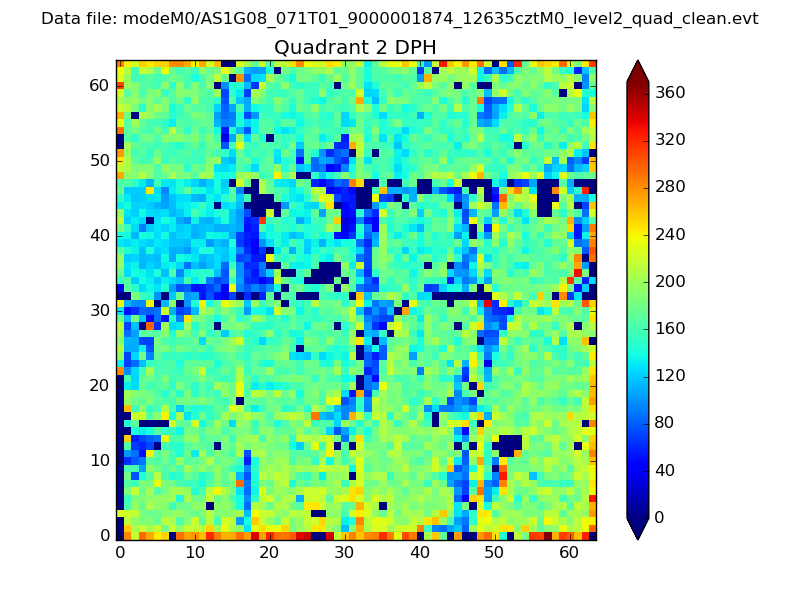
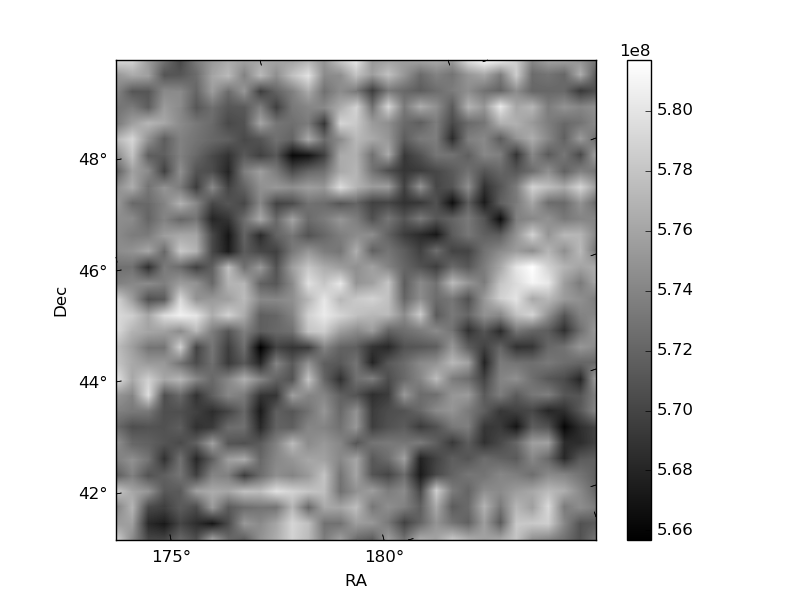
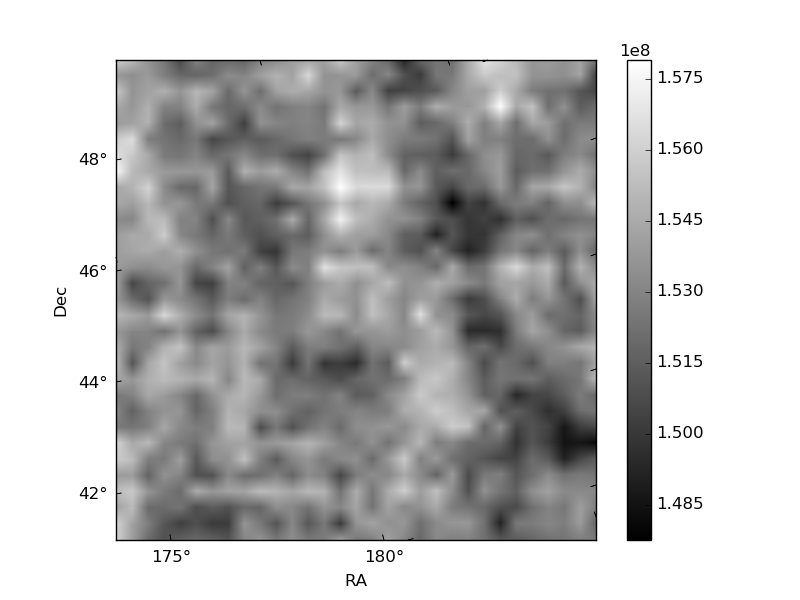
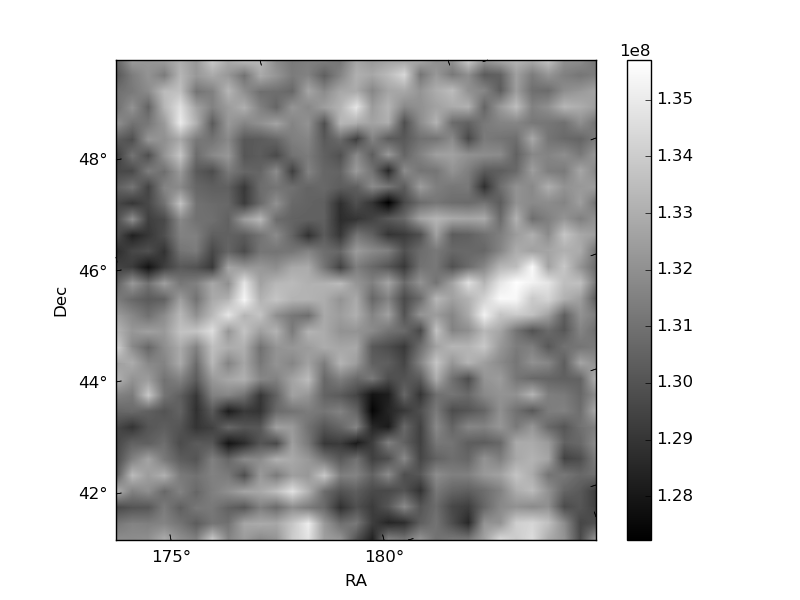
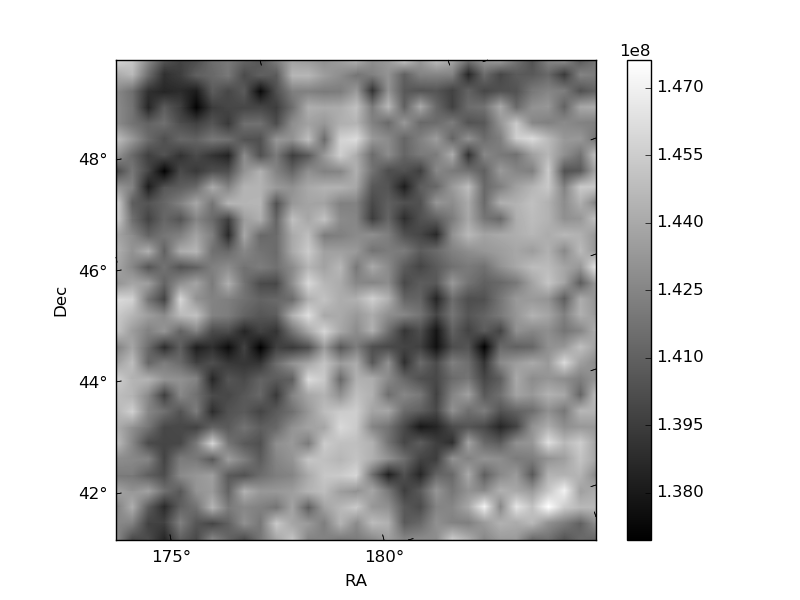
Histogram calculated using DETX and DETY for each event in the final _common_clean file
| Quadrant A | 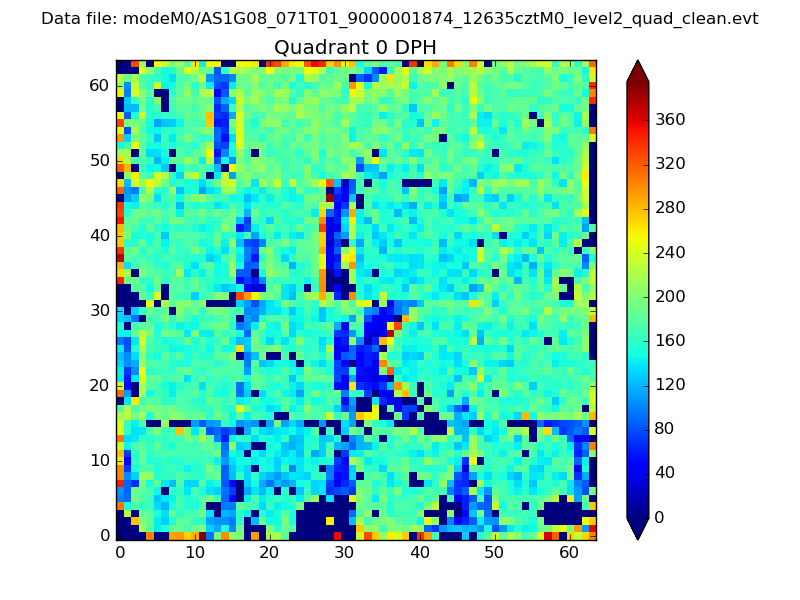 |
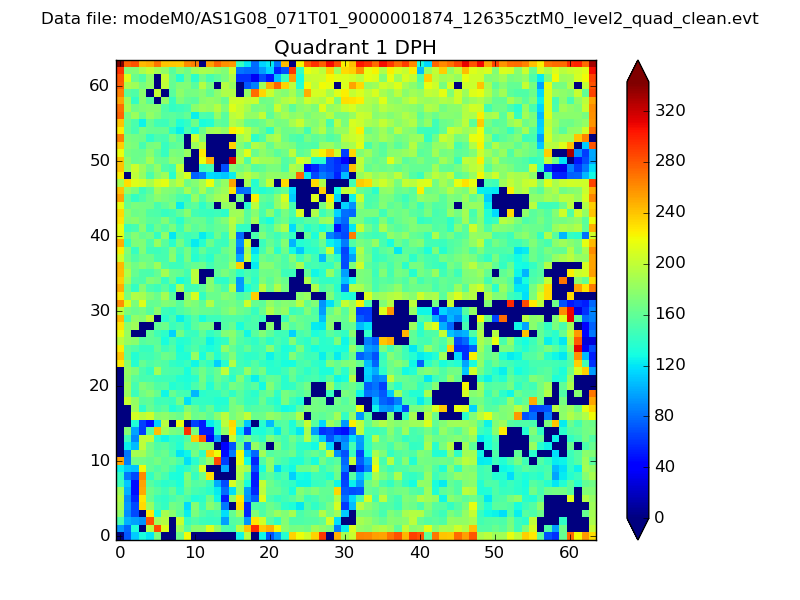 |
Quadrant B |
|---|---|---|---|
| Quadrant D | 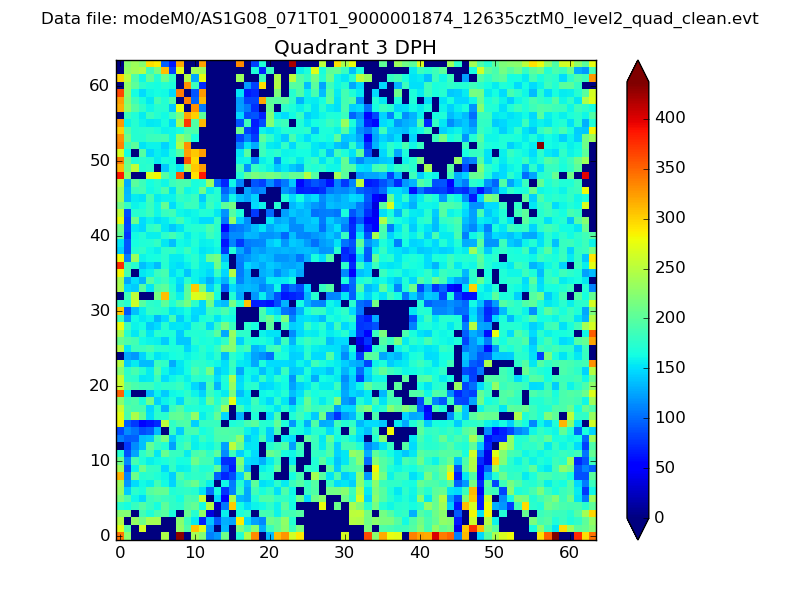 |
 |
Quadrant C |
| Plot type | Count rate plots | Images |
|---|---|---|
| Comparison with Poisson distribution Blue bars denote a histogram of data divided into 1 sec bins. Red curve is a Poisson curve with rate = median count rate of data. |
 |
 |
| Quadrant-wise count rates Data is divided into 100 sec bins |
 |
|
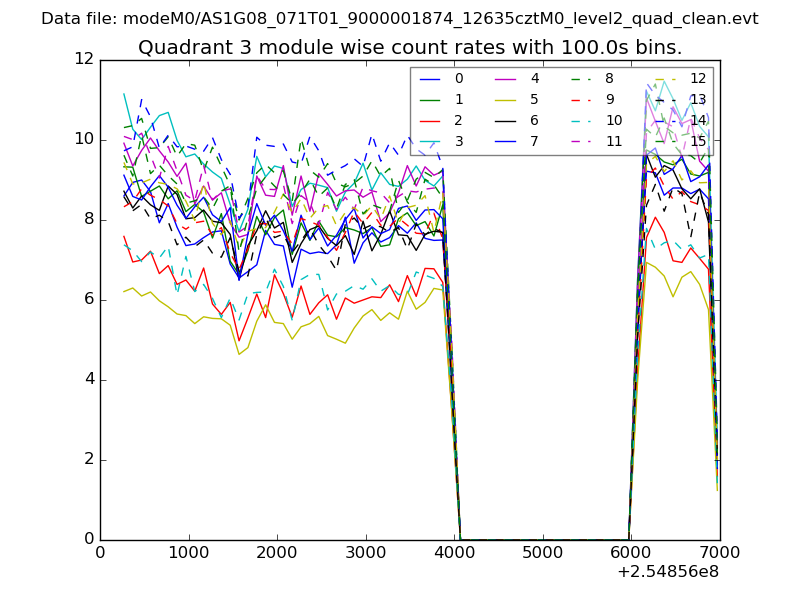
| Module-wise count rates for Quadrant A Data is divided into 100 sec bins |
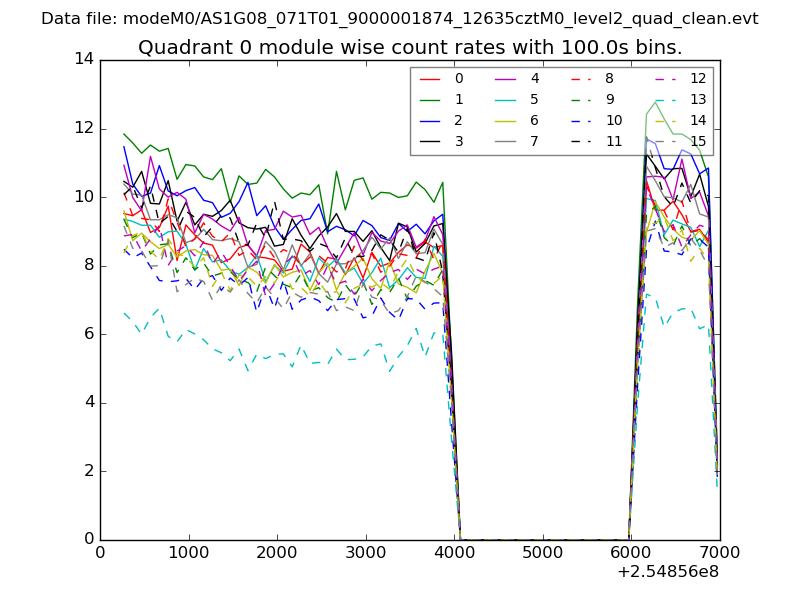 |
 |
| Module-wise count rates for Quadrant B Data is divided into 100 sec bins |
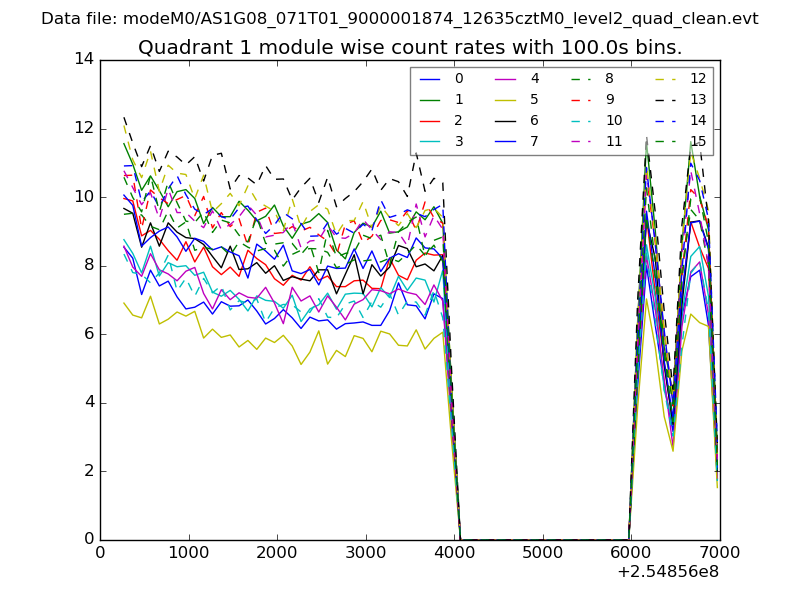 |
 |
| Module-wise count rates for Quadrant C Data is divided into 100 sec bins |
 |
 |
| Module-wise count rates for Quadrant D Data is divided into 100 sec bins |
 |
 |
| Parameter | Plot |
|---|---|
| CZT HV Monitor |  |
| D_VDD | 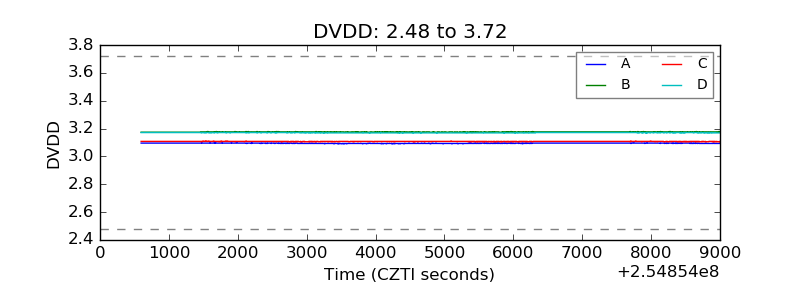 |
| Temperature 1 | 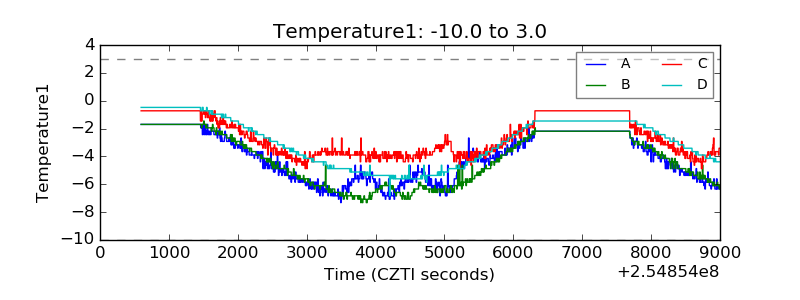 |
| Veto HV Monitor | 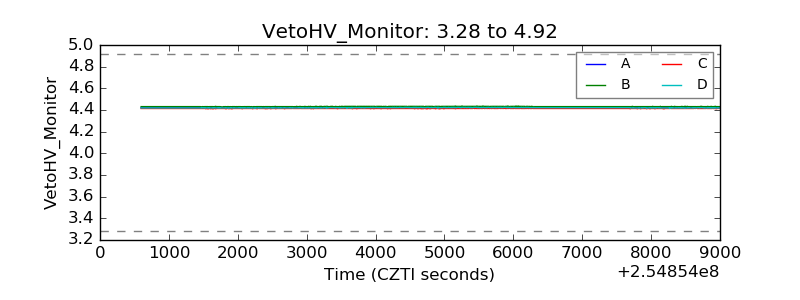 |
| Veto LLD | 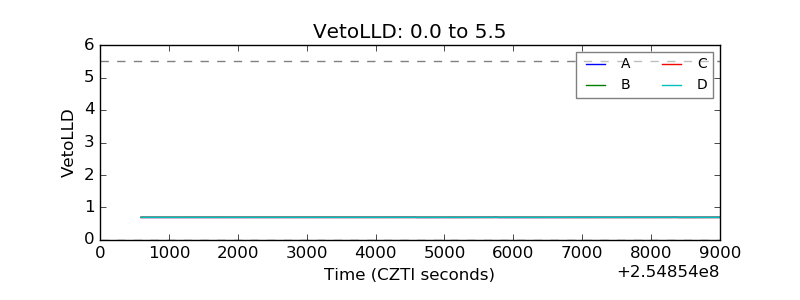 |
| Alpha Counter | 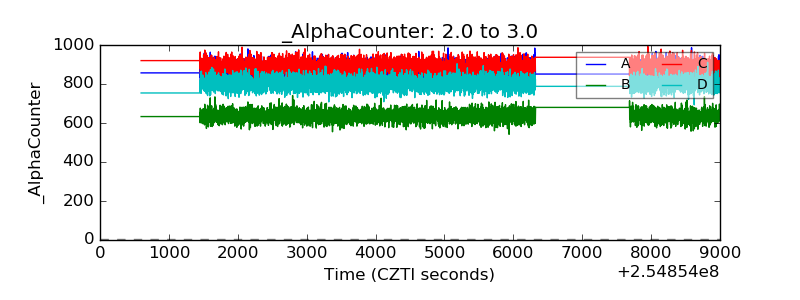 |
| _CPM_Rate | 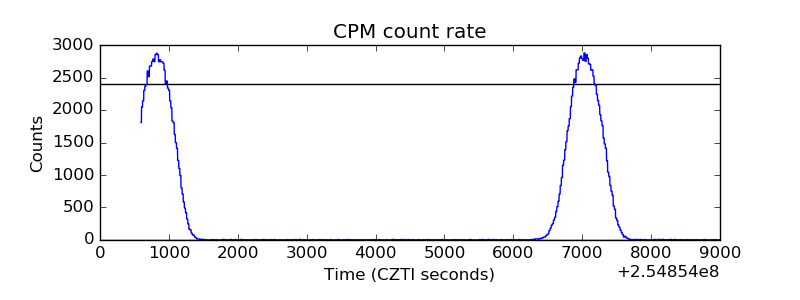 |
| CZT Counter | 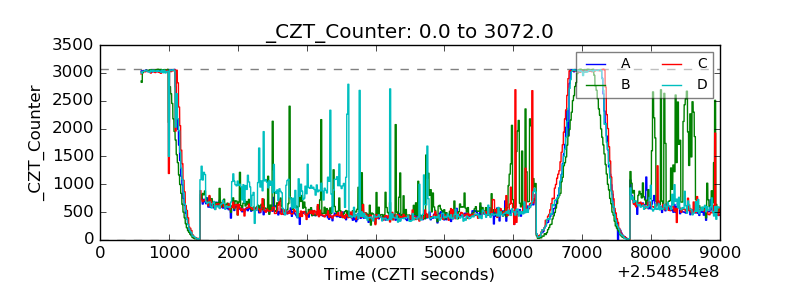 |
| +2.5 Volts monitor |  |
| +5 Volts monitor |  |
| _ROLL_ROT | 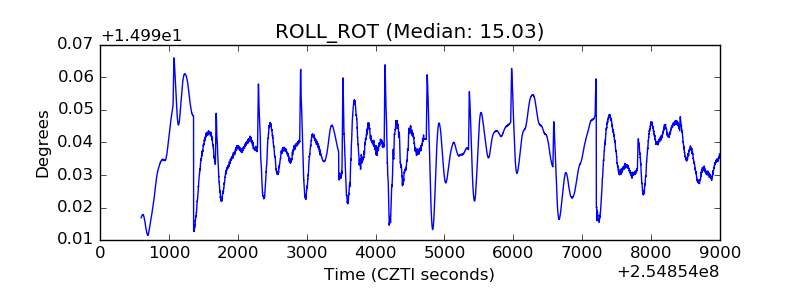 |
| _Roll_DEC | 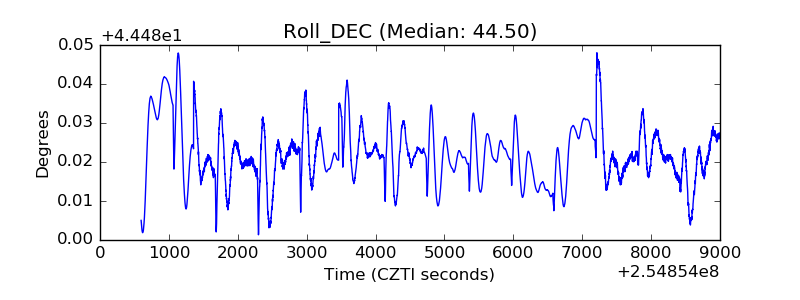 |
| _Roll_RA | 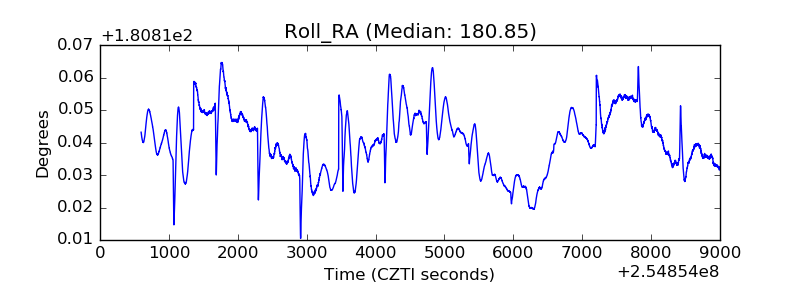 |
| Veto Counter | 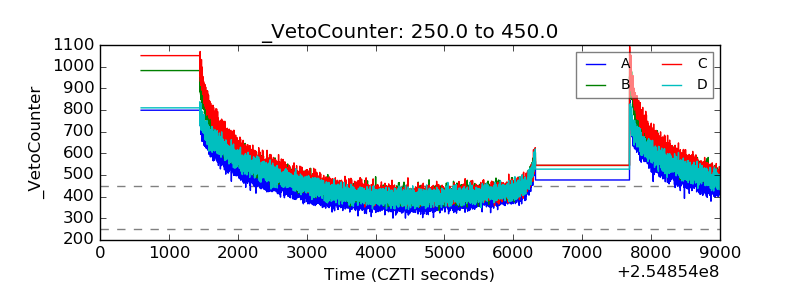 |