| Param | Original file | Final file |
|---|---|---|
| Filename | modeM0/AS1G08_071T01_9000001874_12636cztM0_level2.evt | modeM0/AS1G08_071T01_9000001874_12636cztM0_level2_quad_clean.evt |
| Size (bytes) | 573,696,000 | 106,488,000 |
| Size | 547.1 MB | 101.6 MB |
| Events in quadrant A | 3,308,928 | 705,110 |
| Events in quadrant B | 5,994,094 | 656,827 |
| Events in quadrant C | 3,687,455 | 722,089 |
| Events in quadrant D | 3,937,777 | 681,729 |
| Mode SS | |||
|---|---|---|---|
| Quadrant | BADHDUFLAG | Total packets | Discarded packets |
| A | 0 | 138 | 0 |
| B | 0 | 138 | 0 |
| C | 0 | 138 | 0 |
| D | 0 | 138 | 0 |
| Mode M0 | |||
|---|---|---|---|
| Quadrant | BADHDUFLAG | Total packets | Discarded packets |
| A | 0 | 14230 | 3 |
| B | 0 | 22289 | 2 |
| C | 0 | 15291 | 2 |
| D | 0 | 16079 | 2 |
| Mode M9 | |||
|---|---|---|---|
| Quadrant | BADHDUFLAG | Total packets | Discarded packets |
| A | 0 | 26 | 0 |
| B | 0 | 26 | 0 |
| C | 0 | 26 | 0 |
| D | 0 | 26 | 0 |
| Quadrant | Total seconds | Saturated seconds | Saturation percentage |
|---|---|---|---|
| A | 6574 | 83 | 1.262549% |
| B | 6574 | 956 | 14.542136% |
| C | 6574 | 138 | 2.099179% |
| D | 6574 | 100 | 1.521144% |
Noise dominated data is calculated using 1-second bins in cleaned event files. If a bin has >2000 counts, and if more than 50% of those come from <1% of pixels, then it is considered to be noise-dominated and hence unusable.
| Quadrant | # 1 sec bins | Bins with >0 counts | Bins with >2000 counts | High rate bins dominated by noise | Noise dominated (total time) | Noise dominated (detector-on time) | Marked lightcurve |
|---|---|---|---|---|---|---|---|
| A | 9286 | 6577 | 2 | 2 | 0.02% | 0.03% | 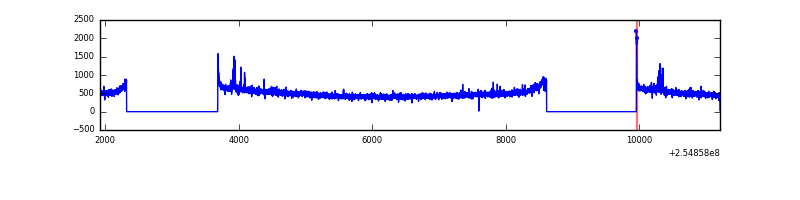 |
| B | 9286 | 6576 | 663 | 663 | 7.14% | 10.08% | 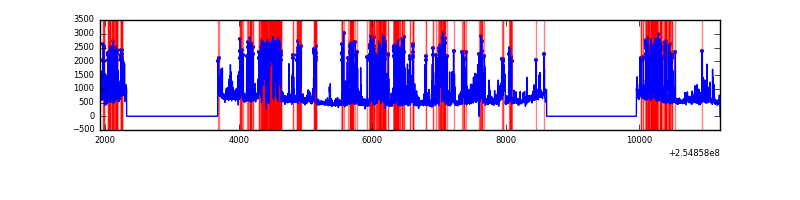 |
| C | 9286 | 6577 | 67 | 67 | 0.72% | 1.02% | 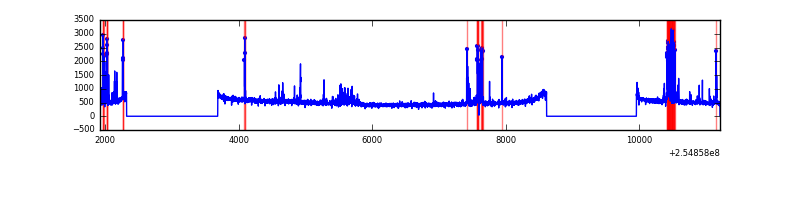 |
| D | 9286 | 6577 | 16 | 16 | 0.17% | 0.24% | 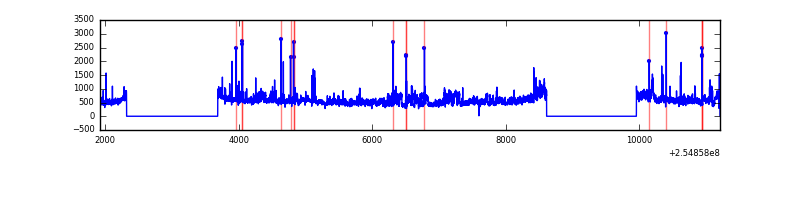 |
Top three noisy pixels from each quadrant. If the there are fewer than three noisy pixels in the level2.evt file, extra rows are filled as -1
| Pixel properties | Quadrant properties | ||||||
|---|---|---|---|---|---|---|---|
| Quadrant | DetID | PixID | Counts | Sigma | Mean | Median | Sigma |
| A | 8 | 15 | 58535 | 337.68 | 842 | 824 | 170.9 |
| A | 8 | 192 | 8269 | 43.56 | 842 | 824 | 170.9 |
| A | 0 | 226 | 7505 | 39.09 | 842 | 824 | 170.9 |
| B | 4 | 239 | 1543543 | 10443.68 | 794 | 775 | 147.7 |
| B | 3 | 64 | 840243 | 5682.73 | 794 | 775 | 147.7 |
| B | 0 | 85 | 183566 | 1237.39 | 794 | 775 | 147.7 |
| C | 15 | 208 | 417779 | 2179.9 | 834 | 840 | 191.3 |
| C | 12 | 4 | 14055 | 69.09 | 834 | 840 | 191.3 |
| C | 13 | 61 | 6105 | 27.52 | 834 | 840 | 191.3 |
| D | 10 | 157 | 553266 | 2800.38 | 823 | 800 | 197.3 |
| D | 1 | 255 | 143951 | 725.62 | 823 | 800 | 197.3 |
| D | 1 | 52 | 33899 | 167.77 | 823 | 800 | 197.3 |
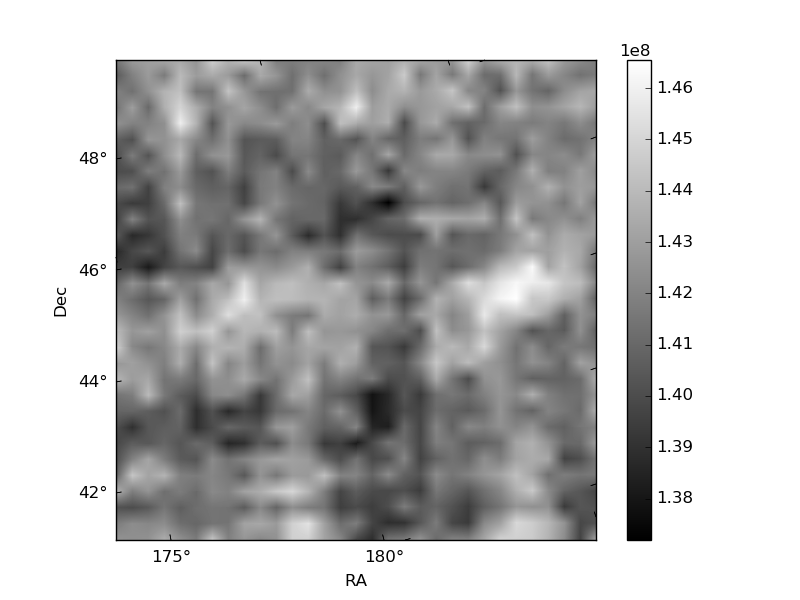
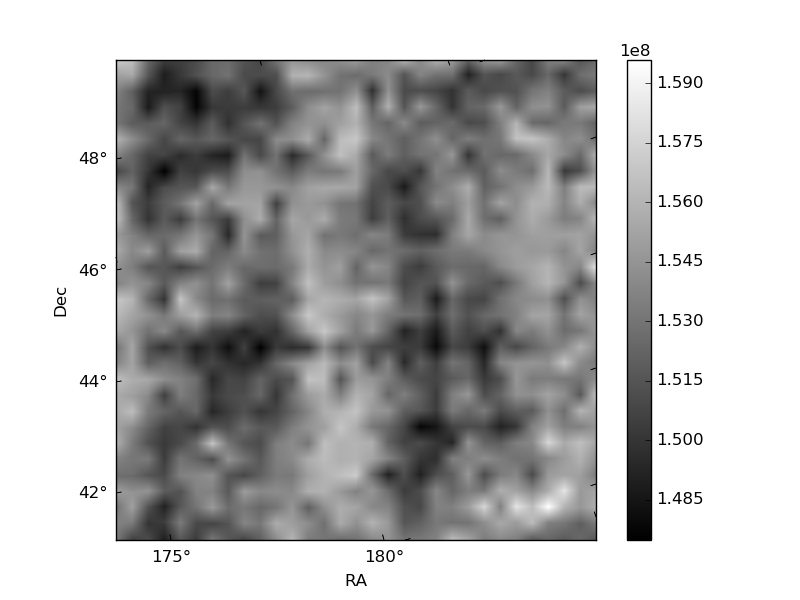
Histogram calculated using DETX and DETY for each event in the final _common_clean file
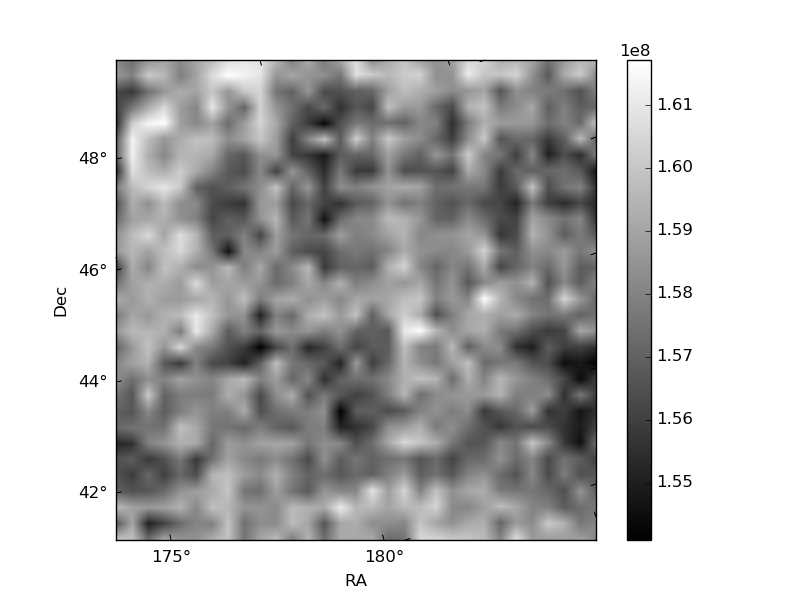
| Quadrant A |  |
 |
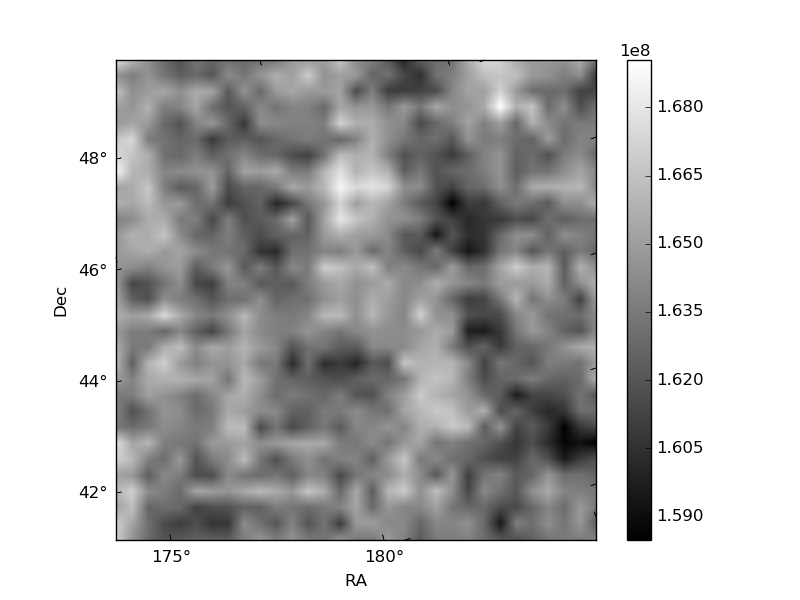
Quadrant B |
|---|---|---|---|
| Quadrant D |  |
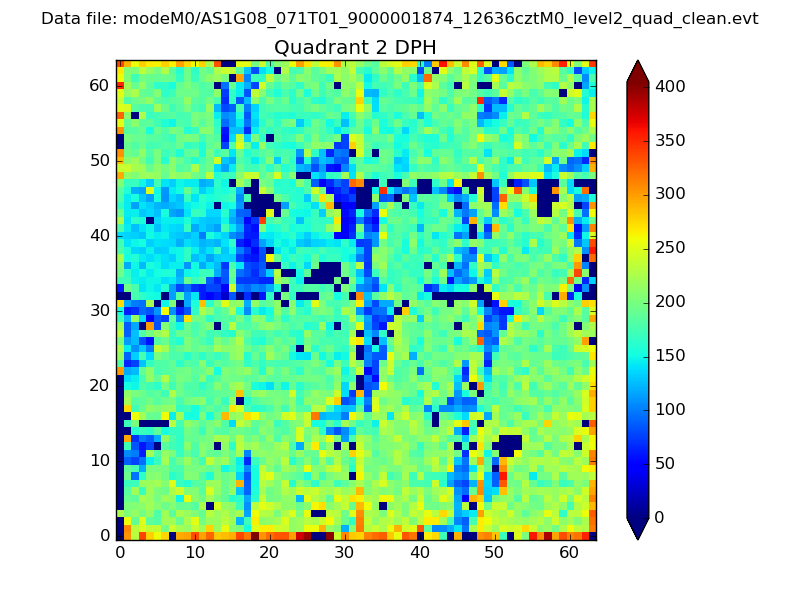 |
Quadrant C |
| Plot type | Count rate plots | Images |
|---|---|---|
| Comparison with Poisson distribution Blue bars denote a histogram of data divided into 1 sec bins. Red curve is a Poisson curve with rate = median count rate of data. |
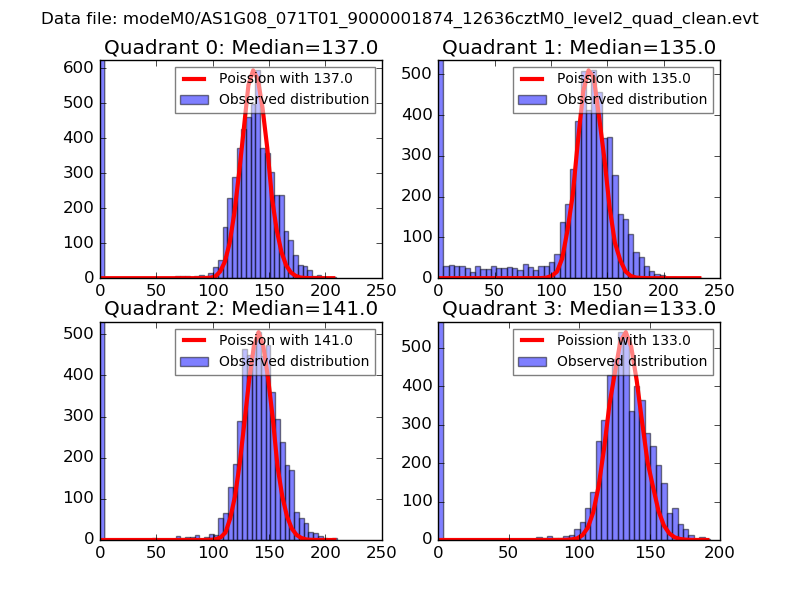 |
 |
| Quadrant-wise count rates Data is divided into 100 sec bins |
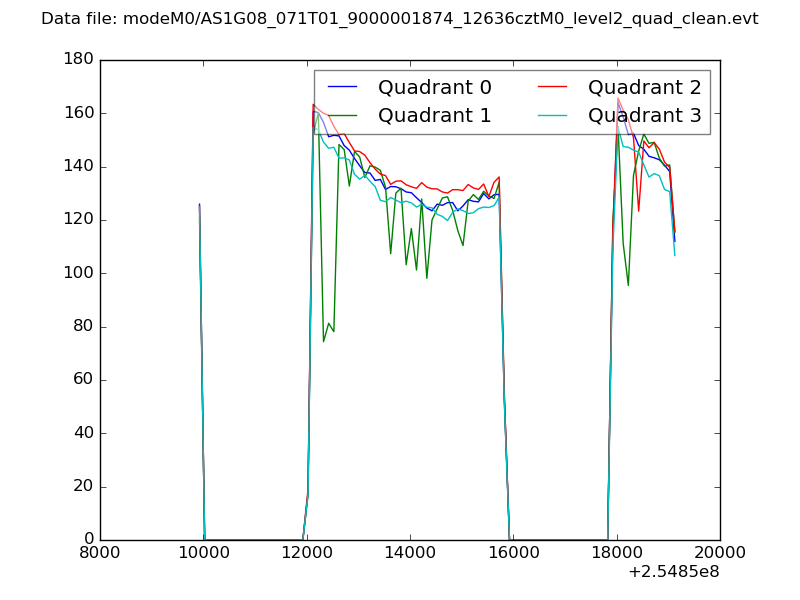 |
|
| Module-wise count rates for Quadrant A Data is divided into 100 sec bins |
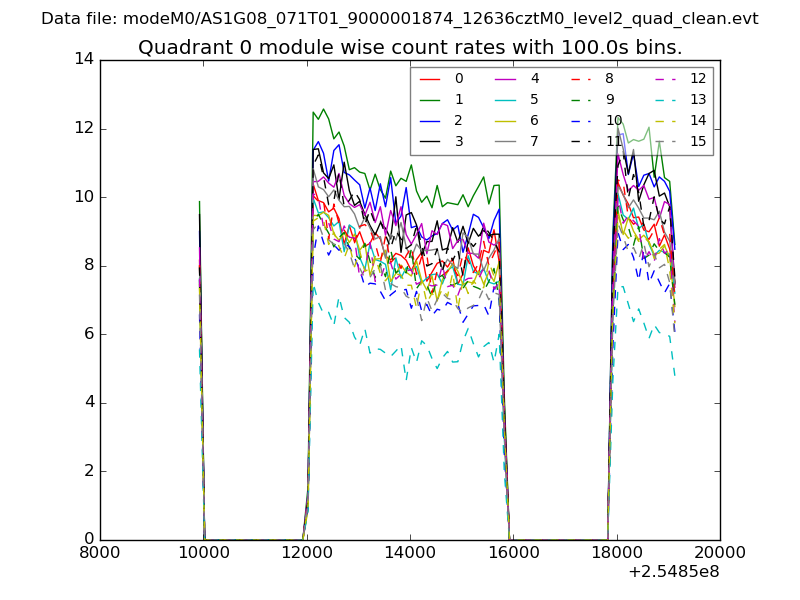 |
 |
| Module-wise count rates for Quadrant B Data is divided into 100 sec bins |
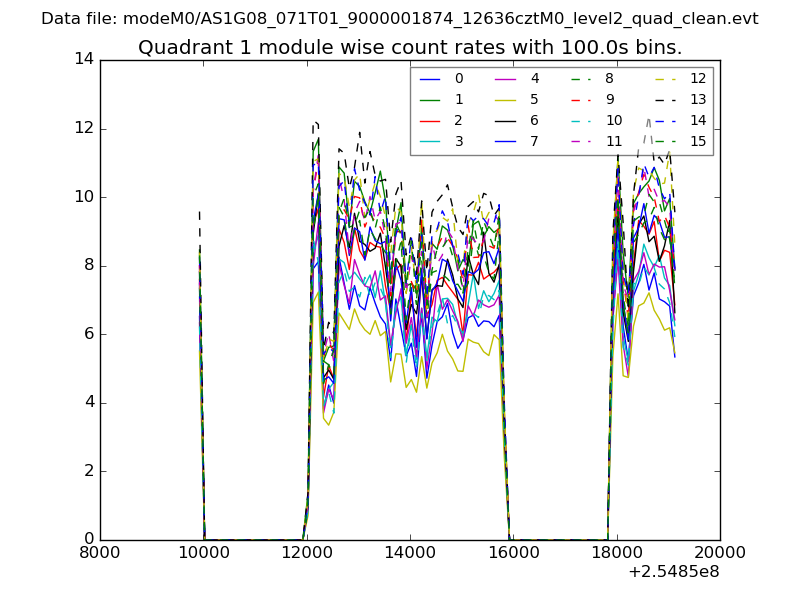 |
 |
| Module-wise count rates for Quadrant C Data is divided into 100 sec bins |
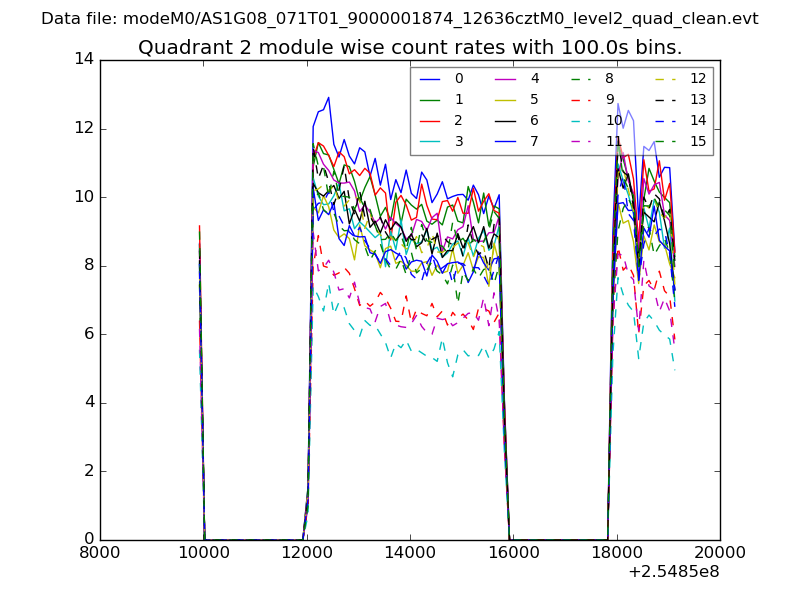 |
 |
| Module-wise count rates for Quadrant D Data is divided into 100 sec bins |
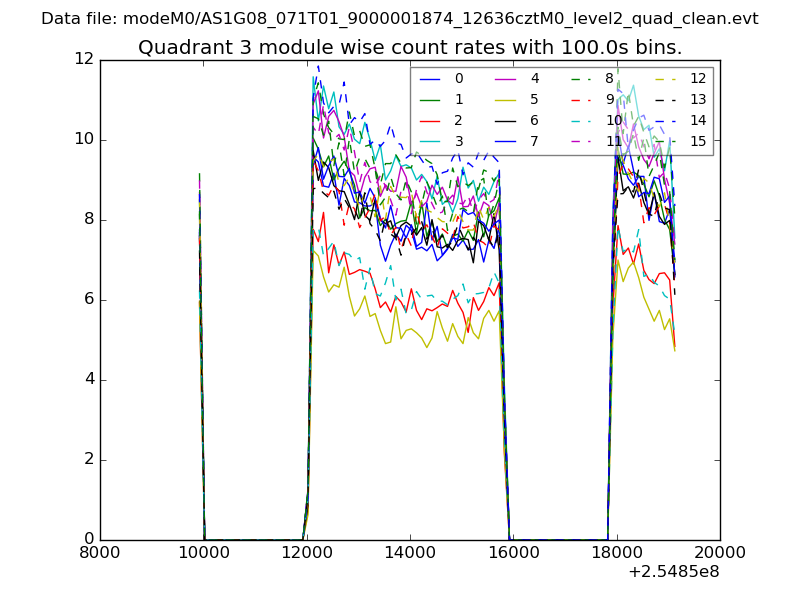 |
 |
| Parameter | Plot |
|---|---|
| CZT HV Monitor | 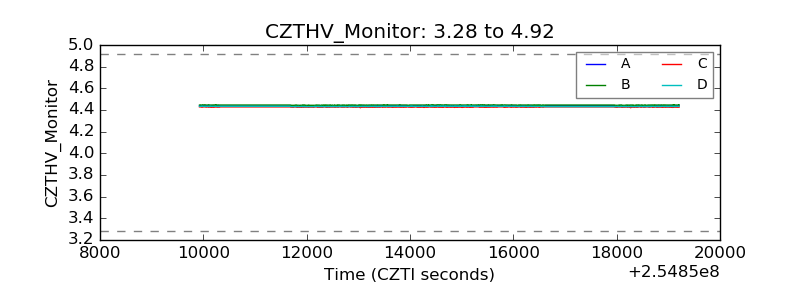 |
| D_VDD |  |
| Temperature 1 | 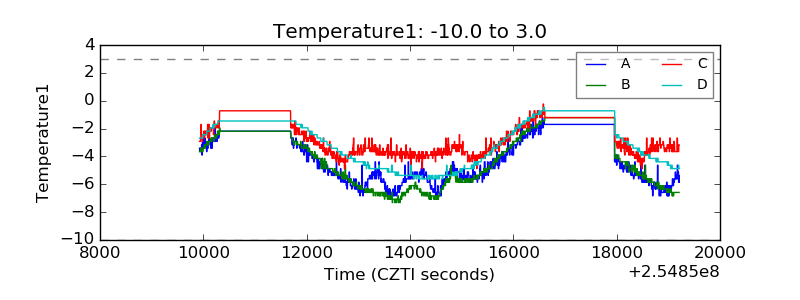 |
| Veto HV Monitor | 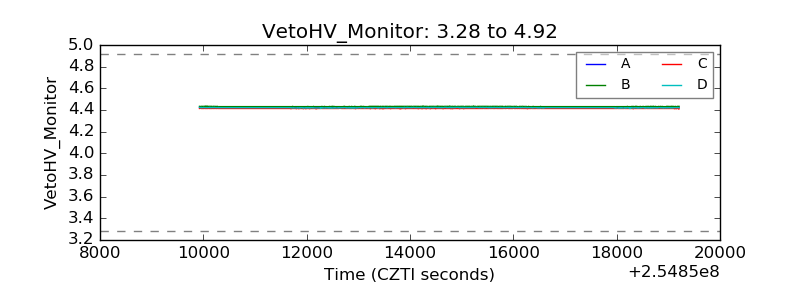 |
| Veto LLD | 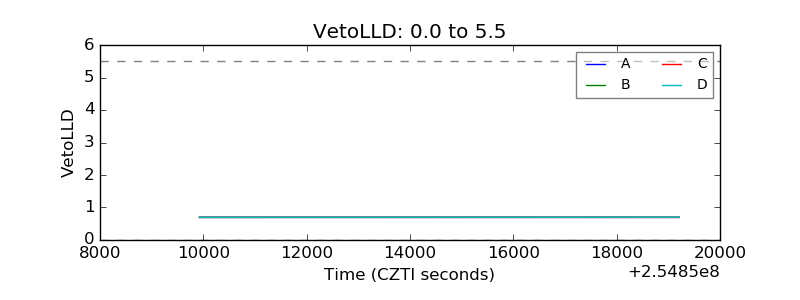 |
| Alpha Counter | 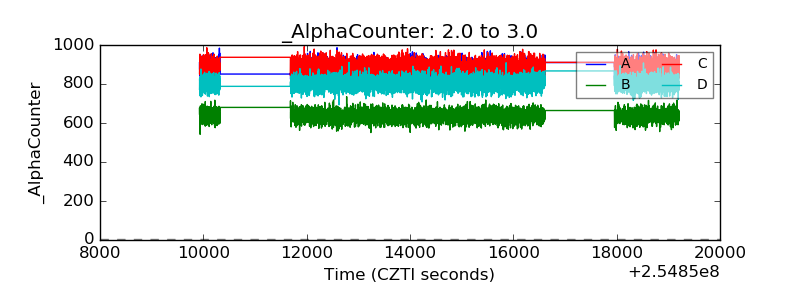 |
| _CPM_Rate | 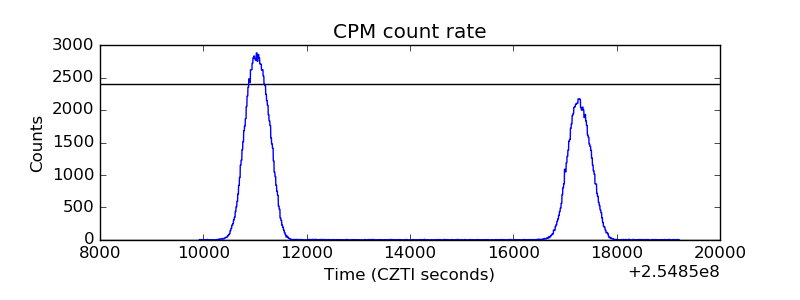 |
| CZT Counter | 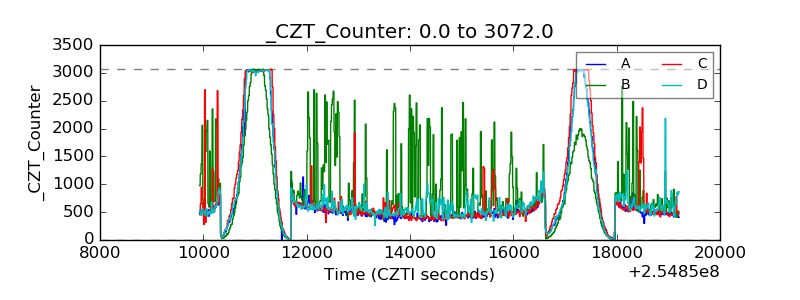 |
| +2.5 Volts monitor | 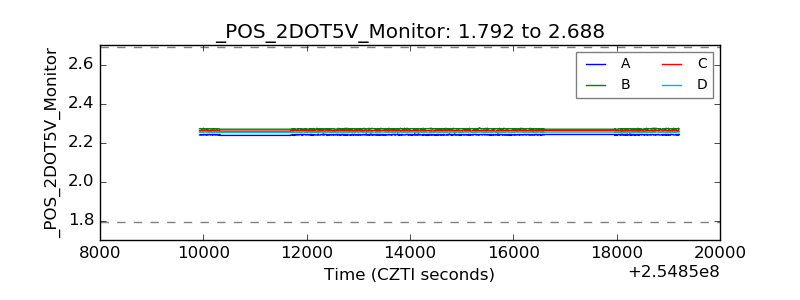 |
| +5 Volts monitor |  |
| _ROLL_ROT |  |
| _Roll_DEC | 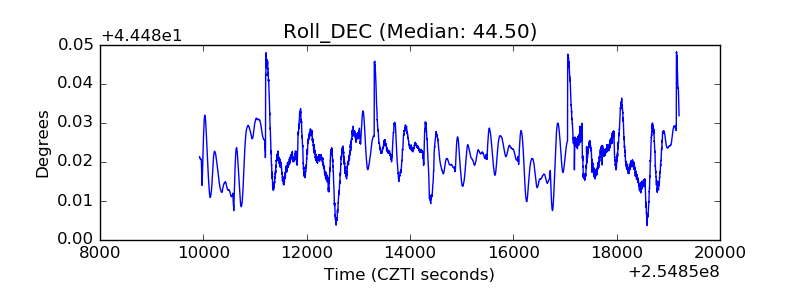 |
| _Roll_RA | 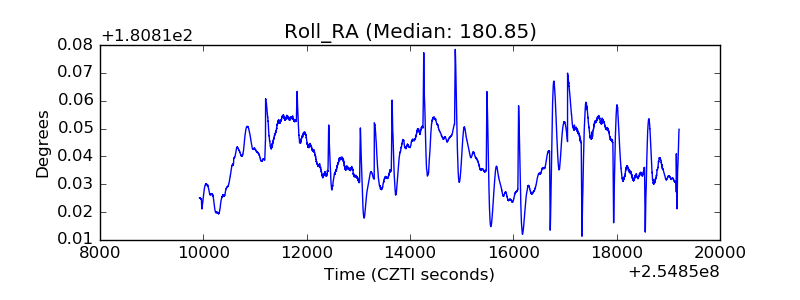 |
| Veto Counter | 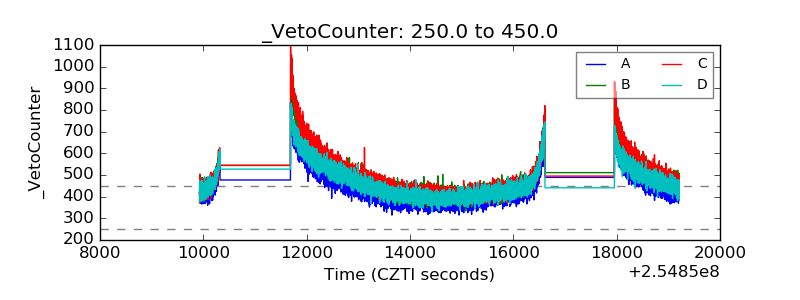 |