| Param | Original file | Final file |
|---|---|---|
| Filename | modeM0/AS1G08_071T01_9000001874_12637cztM0_level2.evt | modeM0/AS1G08_071T01_9000001874_12637cztM0_level2_quad_clean.evt |
| Size (bytes) | 489,245,760 | 101,318,400 |
| Size | 466.6 MB | 96.6 MB |
| Events in quadrant A | 2,949,576 | 663,656 |
| Events in quadrant B | 4,153,200 | 659,043 |
| Events in quadrant C | 3,117,207 | 678,725 |
| Events in quadrant D | 4,178,874 | 636,906 |
| Mode SS | |||
|---|---|---|---|
| Quadrant | BADHDUFLAG | Total packets | Discarded packets |
| A | 0 | 124 | 0 |
| B | 0 | 124 | 0 |
| C | 0 | 124 | 0 |
| D | 0 | 124 | 0 |
| Mode M0 | |||
|---|---|---|---|
| Quadrant | BADHDUFLAG | Total packets | Discarded packets |
| A | 0 | 13022 | 3 |
| B | 0 | 16467 | 2 |
| C | 0 | 13441 | 2 |
| D | 0 | 16809 | 2 |
| Mode M9 | |||
|---|---|---|---|
| Quadrant | BADHDUFLAG | Total packets | Discarded packets |
| A | 0 | 24 | 0 |
| B | 0 | 24 | 0 |
| C | 0 | 24 | 0 |
| D | 0 | 25 | 0 |
| Quadrant | Total seconds | Saturated seconds | Saturation percentage |
|---|---|---|---|
| A | 6163 | 22 | 0.356969% |
| B | 6163 | 387 | 6.279409% |
| C | 6163 | 80 | 1.298069% |
| D | 6163 | 131 | 2.125588% |
Noise dominated data is calculated using 1-second bins in cleaned event files. If a bin has >2000 counts, and if more than 50% of those come from <1% of pixels, then it is considered to be noise-dominated and hence unusable.
| Quadrant | # 1 sec bins | Bins with >0 counts | Bins with >2000 counts | High rate bins dominated by noise | Noise dominated (total time) | Noise dominated (detector-on time) | Marked lightcurve |
|---|---|---|---|---|---|---|---|
| A | 7489 | 6164 | 2 | 2 | 0.03% | 0.03% | 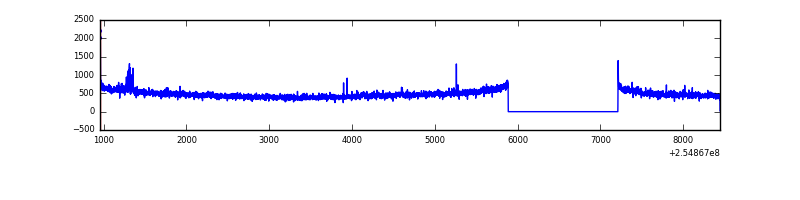 |
| B | 7489 | 6165 | 246 | 246 | 3.28% | 3.99% | 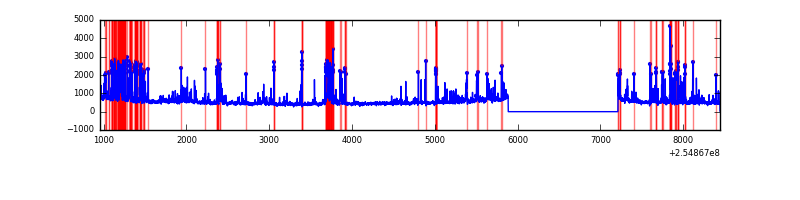 |
| C | 7489 | 6165 | 44 | 44 | 0.59% | 0.71% | 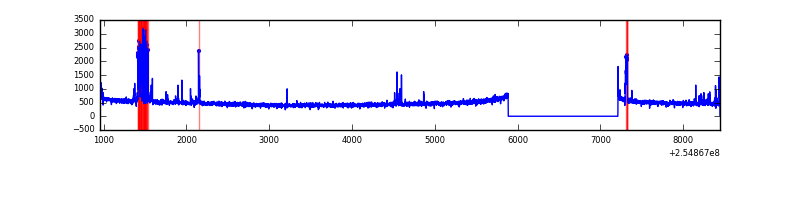 |
| D | 7489 | 6164 | 53 | 53 | 0.71% | 0.86% | 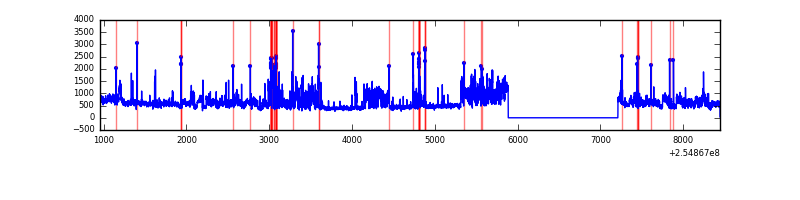 |
Top three noisy pixels from each quadrant. If the there are fewer than three noisy pixels in the level2.evt file, extra rows are filled as -1
| Pixel properties | Quadrant properties | ||||||
|---|---|---|---|---|---|---|---|
| Quadrant | DetID | PixID | Counts | Sigma | Mean | Median | Sigma |
| A | 8 | 15 | 65147 | 430.35 | 745 | 729 | 149.7 |
| A | 8 | 192 | 9823 | 60.75 | 745 | 729 | 149.7 |
| A | 0 | 226 | 6572 | 39.04 | 745 | 729 | 149.7 |
| B | 4 | 239 | 867528 | 6255.02 | 735 | 718 | 138.6 |
| B | 3 | 64 | 209658 | 1507.74 | 735 | 718 | 138.6 |
| B | 4 | 81 | 86114 | 616.23 | 735 | 718 | 138.6 |
| C | 15 | 208 | 189873 | 1120.53 | 739 | 745 | 168.8 |
| C | 7 | 238 | 25482 | 146.56 | 739 | 745 | 168.8 |
| C | 14 | 234 | 13179 | 73.67 | 739 | 745 | 168.8 |
| D | 10 | 157 | 1116612 | 6363.07 | 723 | 701 | 175.4 |
| D | 1 | 52 | 154800 | 878.69 | 723 | 701 | 175.4 |
| D | 13 | 104 | 65089 | 367.15 | 723 | 701 | 175.4 |
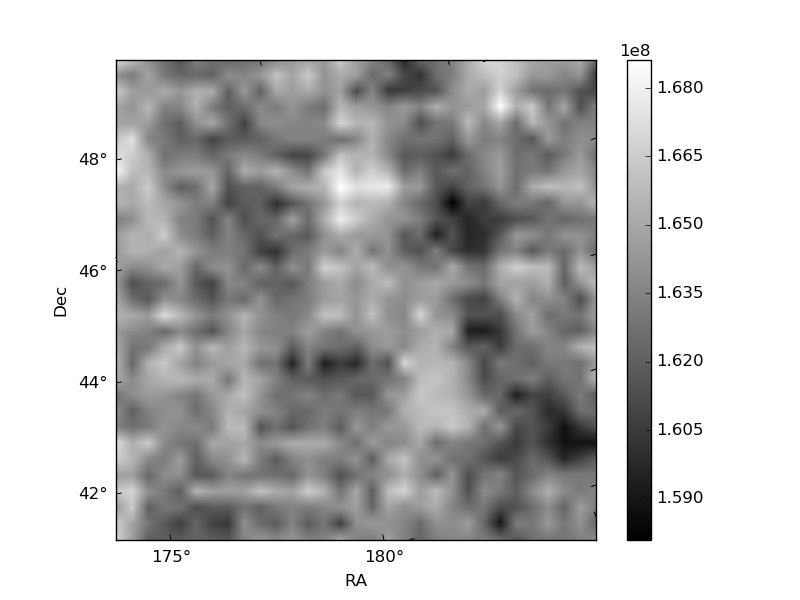
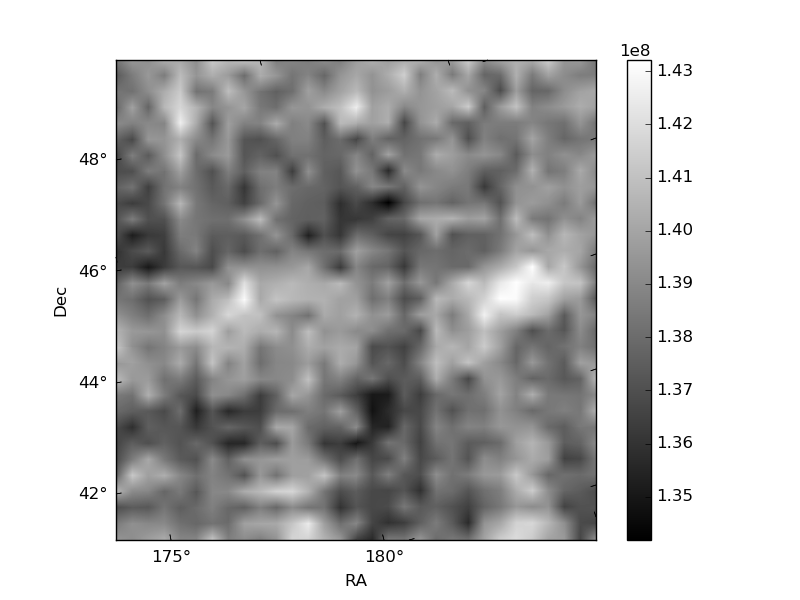
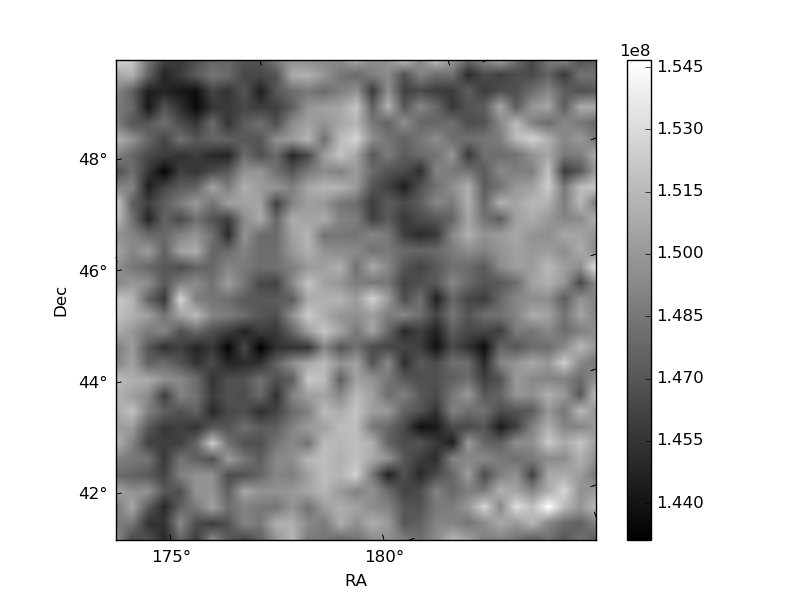
Histogram calculated using DETX and DETY for each event in the final _common_clean file
| Quadrant A | 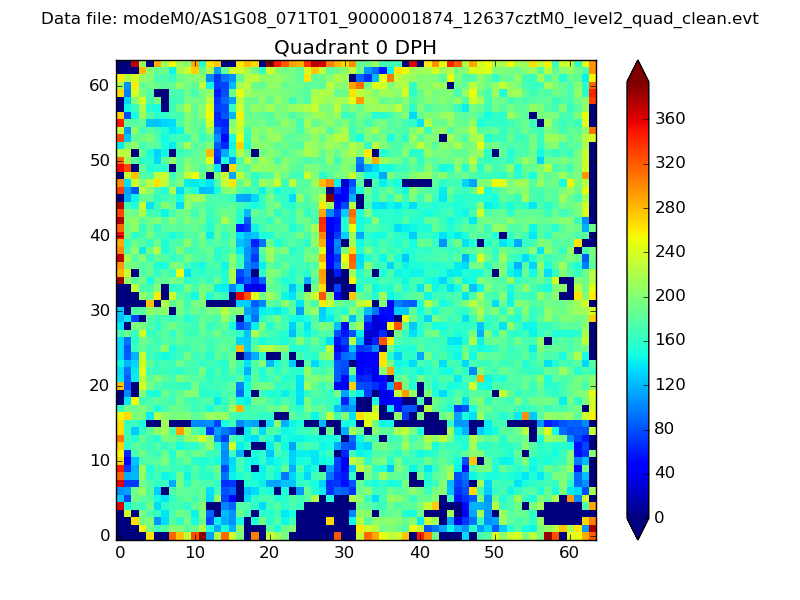 |
 |
Quadrant B |
|---|---|---|---|
| Quadrant D | 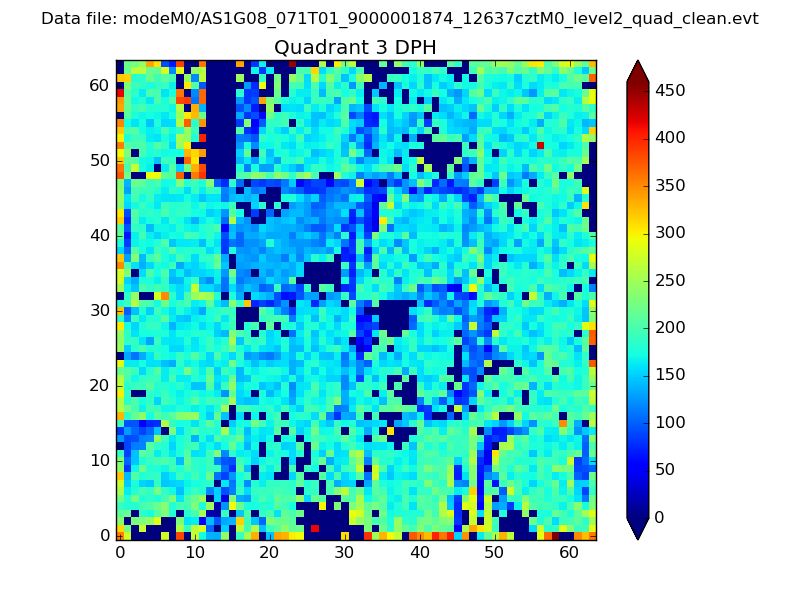 |
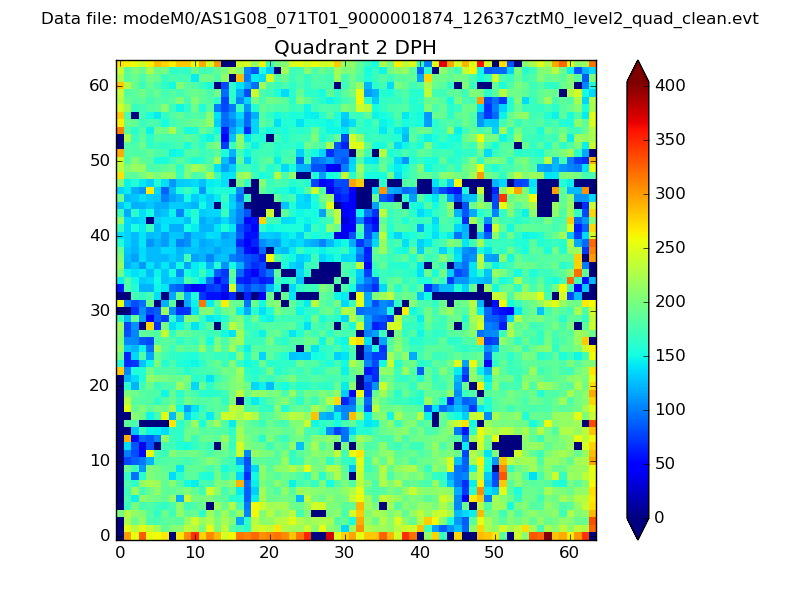 |
Quadrant C |
| Plot type | Count rate plots | Images |
|---|---|---|
| Comparison with Poisson distribution Blue bars denote a histogram of data divided into 1 sec bins. Red curve is a Poisson curve with rate = median count rate of data. |
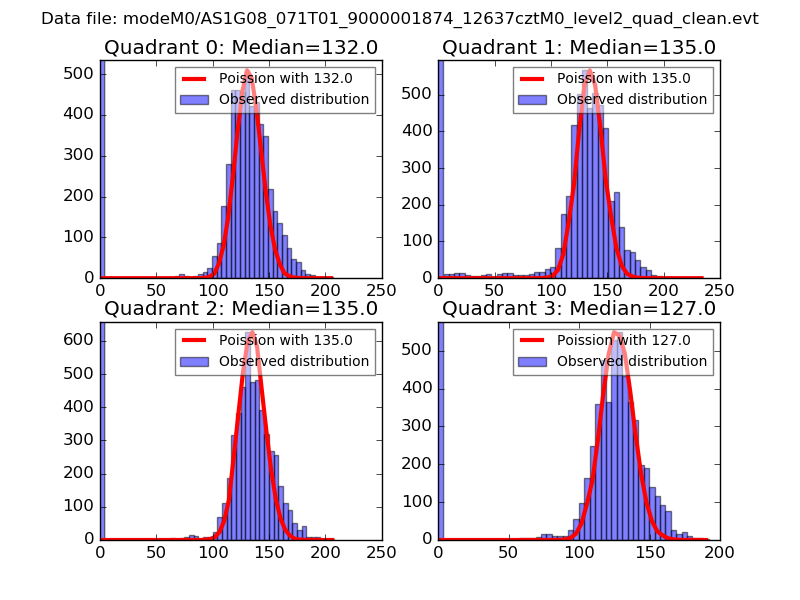 |
 |
| Quadrant-wise count rates Data is divided into 100 sec bins |
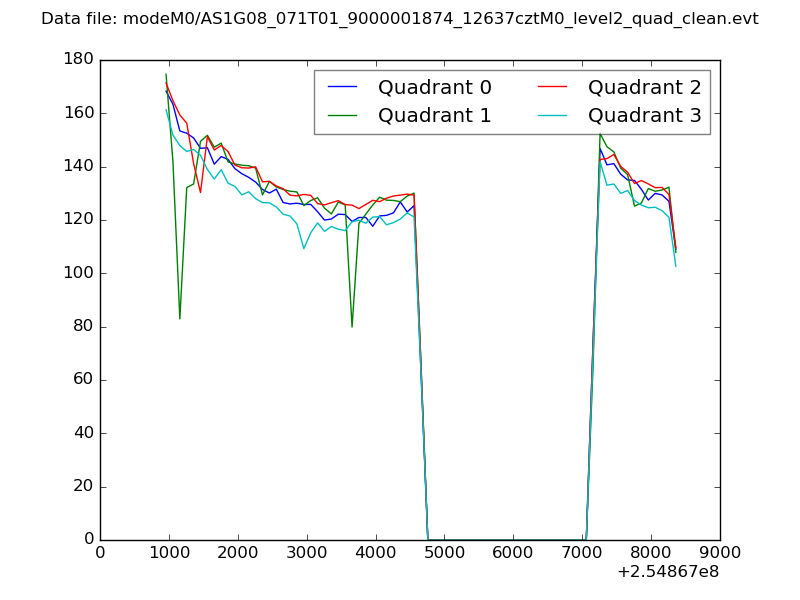 |
|
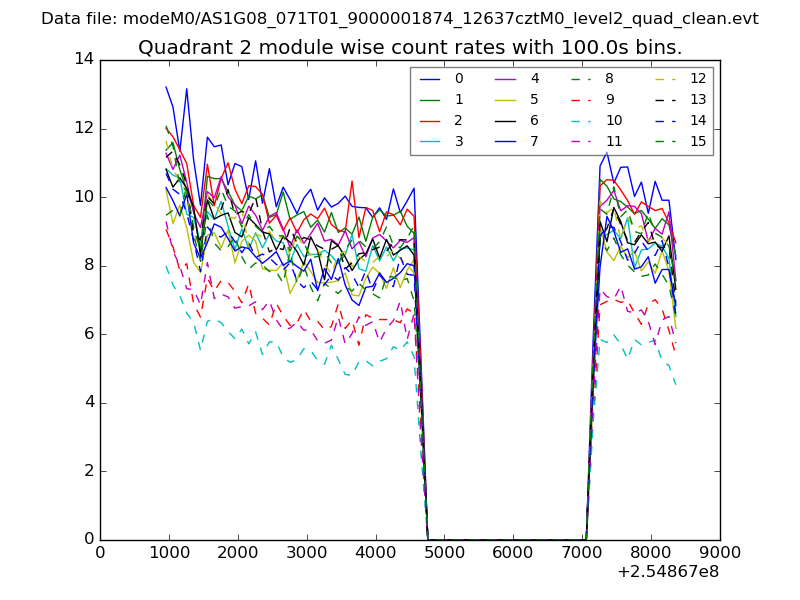
| Module-wise count rates for Quadrant A Data is divided into 100 sec bins |
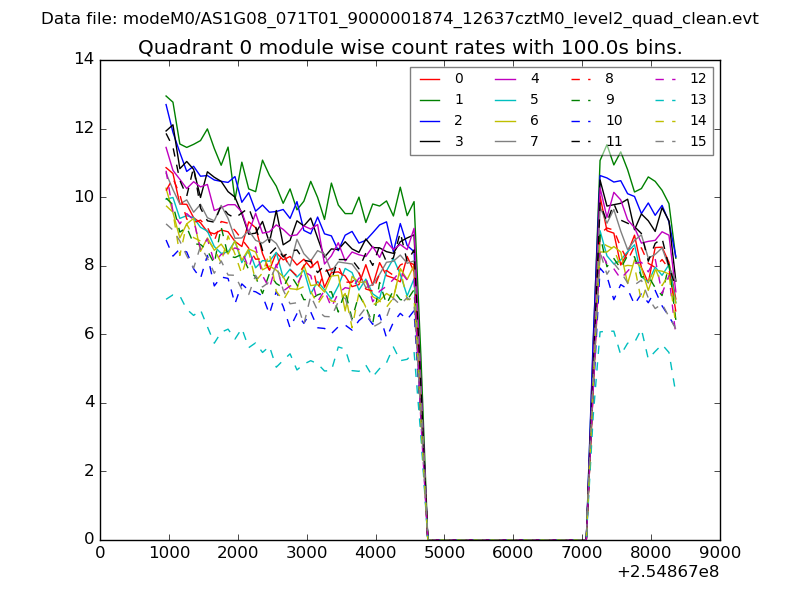 |
 |
| Module-wise count rates for Quadrant B Data is divided into 100 sec bins |
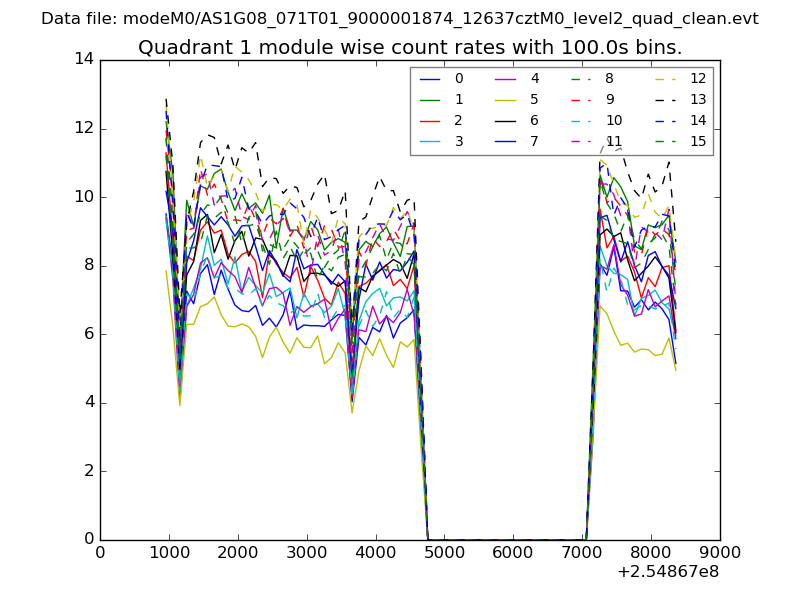 |
 |
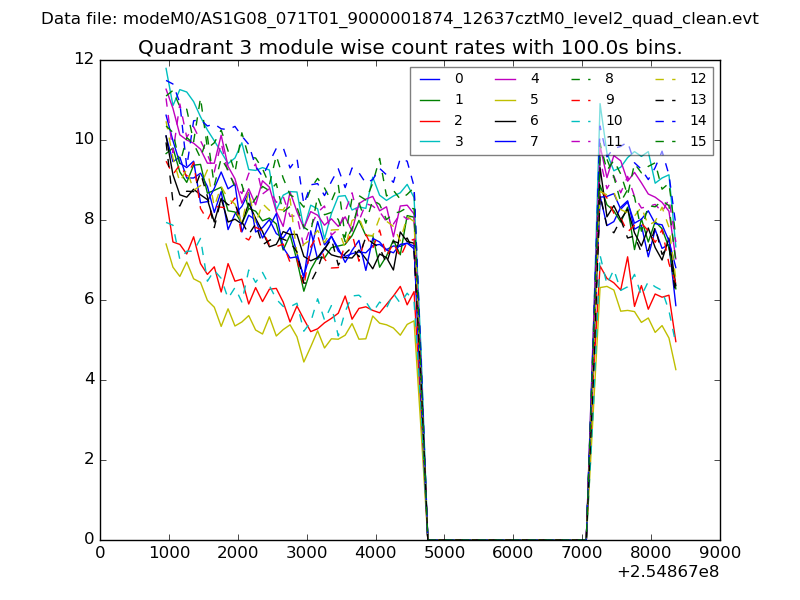
| Module-wise count rates for Quadrant C Data is divided into 100 sec bins |
 |
 |
| Module-wise count rates for Quadrant D Data is divided into 100 sec bins |
 |
 |
| Parameter | Plot |
|---|---|
| CZT HV Monitor | 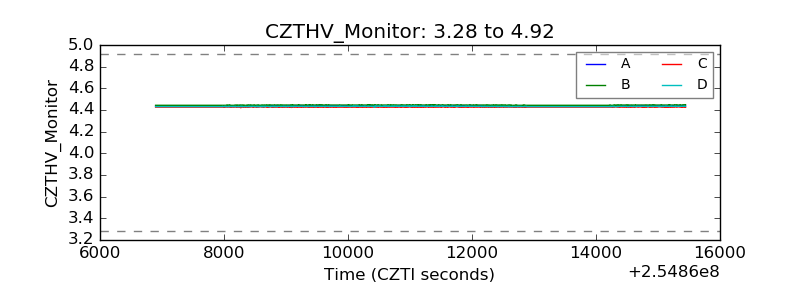 |
| D_VDD | 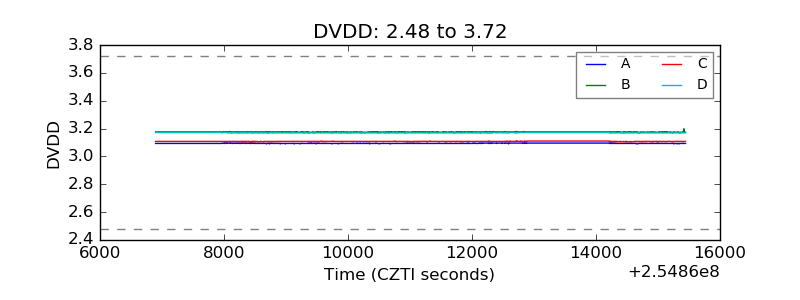 |
| Temperature 1 | 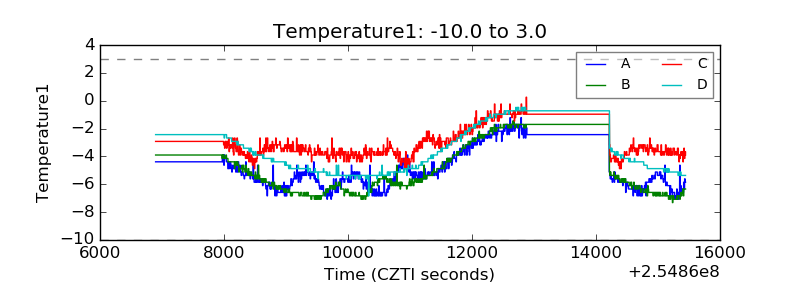 |
| Veto HV Monitor | 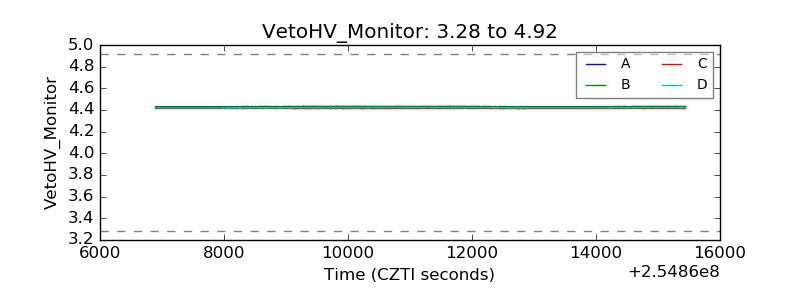 |
| Veto LLD | 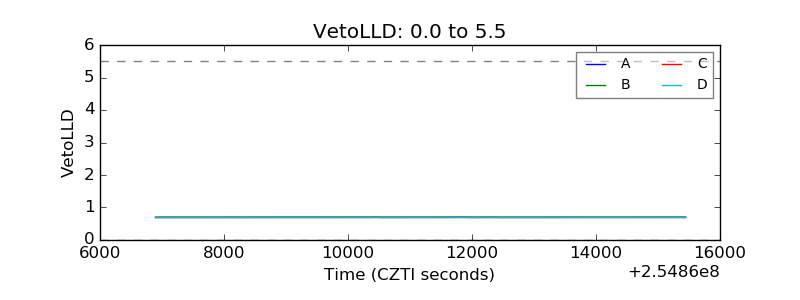 |
| Alpha Counter | 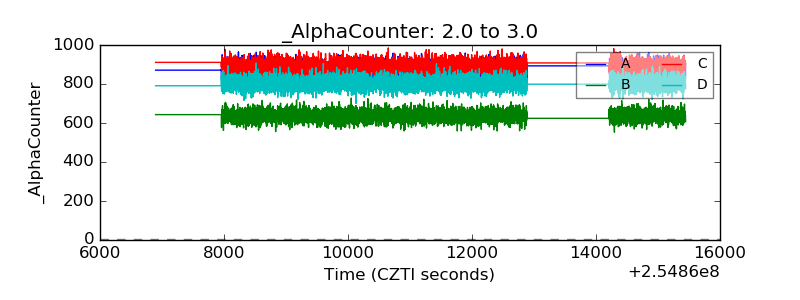 |
| _CPM_Rate | 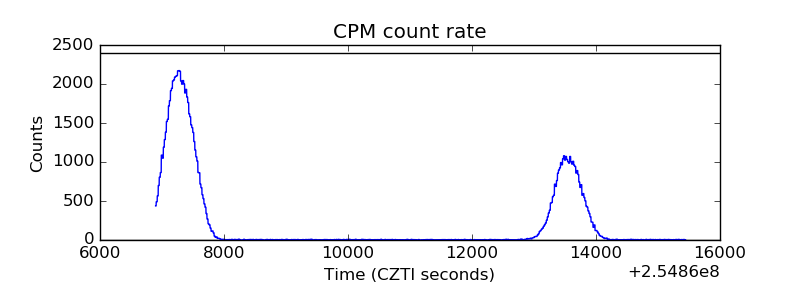 |
| CZT Counter |  |
| +2.5 Volts monitor |  |
| +5 Volts monitor |  |
| _ROLL_ROT | 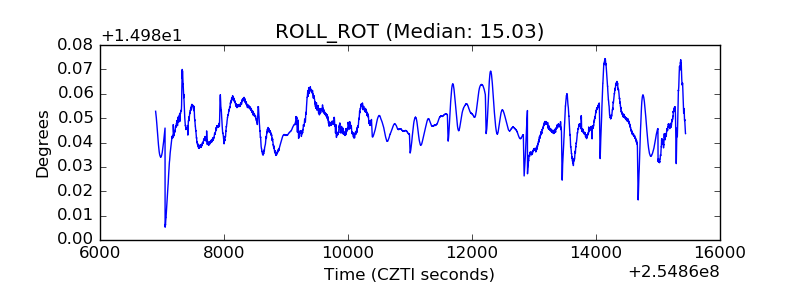 |
| _Roll_DEC | 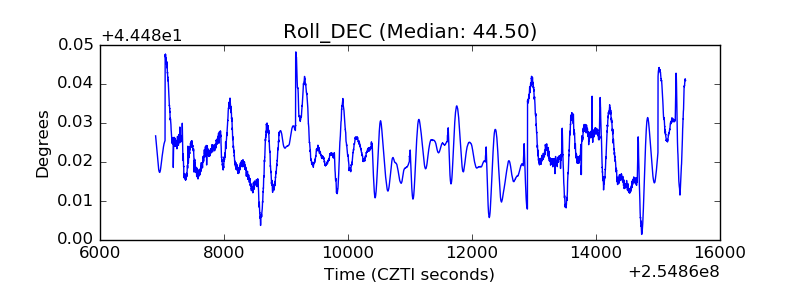 |
| _Roll_RA |  |
| Veto Counter | 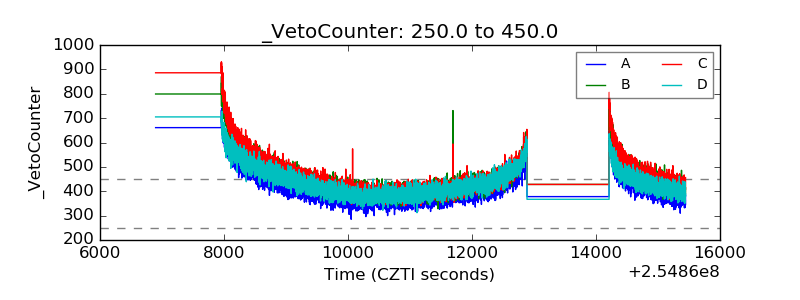 |