| Param | Original file | Final file |
|---|---|---|
| Filename | modeM0/AS1G08_071T01_9000001874_12638cztM0_level2.evt | modeM0/AS1G08_071T01_9000001874_12638cztM0_level2_quad_clean.evt |
| Size (bytes) | 568,189,440 | 91,310,400 |
| Size | 541.9 MB | 87.1 MB |
| Events in quadrant A | 3,380,194 | 574,005 |
| Events in quadrant B | 4,356,836 | 584,705 |
| Events in quadrant C | 3,369,325 | 589,089 |
| Events in quadrant D | 5,620,306 | 523,036 |
| Mode SS | |||
|---|---|---|---|
| Quadrant | BADHDUFLAG | Total packets | Discarded packets |
| A | 0 | 144 | 0 |
| B | 0 | 144 | 0 |
| C | 0 | 144 | 0 |
| D | 0 | 144 | 0 |
| Mode M0 | |||
|---|---|---|---|
| Quadrant | BADHDUFLAG | Total packets | Discarded packets |
| A | 0 | 14927 | 3 |
| B | 0 | 17796 | 2 |
| C | 0 | 14902 | 2 |
| D | 0 | 21683 | 2 |
| Mode M9 | |||
|---|---|---|---|
| Quadrant | BADHDUFLAG | Total packets | Discarded packets |
| A | 0 | 25 | 0 |
| B | 0 | 25 | 0 |
| C | 0 | 25 | 0 |
| D | 0 | 25 | 0 |
| Quadrant | Total seconds | Saturated seconds | Saturation percentage |
|---|---|---|---|
| A | 7103 | 31 | 0.436435% |
| B | 7103 | 243 | 3.421090% |
| C | 7103 | 44 | 0.619457% |
| D | 7103 | 461 | 6.490215% |
Noise dominated data is calculated using 1-second bins in cleaned event files. If a bin has >2000 counts, and if more than 50% of those come from <1% of pixels, then it is considered to be noise-dominated and hence unusable.
| Quadrant | # 1 sec bins | Bins with >0 counts | Bins with >2000 counts | High rate bins dominated by noise | Noise dominated (total time) | Noise dominated (detector-on time) | Marked lightcurve |
|---|---|---|---|---|---|---|---|
| A | 9469 | 7105 | 0 | 0 | 0.00% | 0.00% | 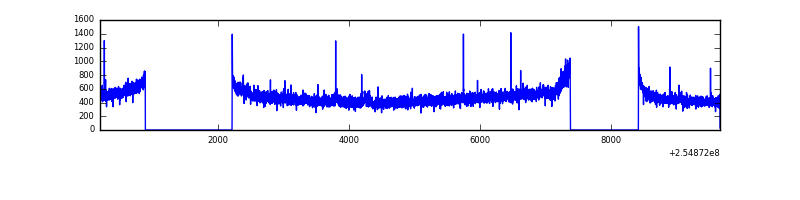 |
| B | 9469 | 7105 | 94 | 94 | 0.99% | 1.32% | 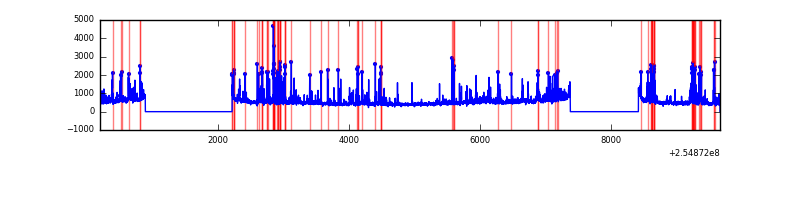 |
| C | 9469 | 7105 | 9 | 9 | 0.10% | 0.13% | 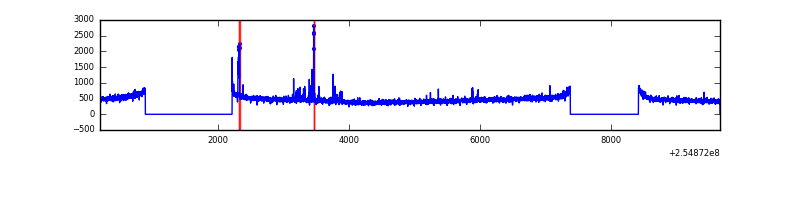 |
| D | 9469 | 7105 | 398 | 398 | 4.20% | 5.60% | 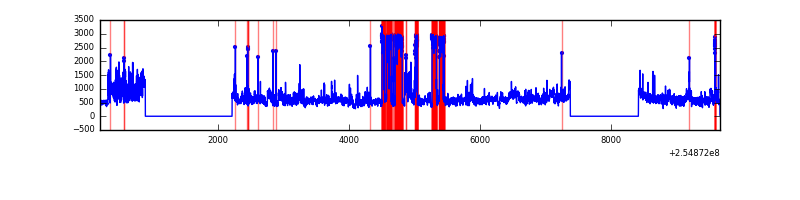 |
Top three noisy pixels from each quadrant. If the there are fewer than three noisy pixels in the level2.evt file, extra rows are filled as -1
| Pixel properties | Quadrant properties | ||||||
|---|---|---|---|---|---|---|---|
| Quadrant | DetID | PixID | Counts | Sigma | Mean | Median | Sigma |
| A | 8 | 15 | 81497 | 467.41 | 852 | 832 | 172.6 |
| A | 14 | 239 | 8906 | 46.78 | 852 | 832 | 172.6 |
| A | 0 | 226 | 7527 | 38.79 | 852 | 832 | 172.6 |
| B | 4 | 239 | 614452 | 3776.19 | 855 | 835 | 162.5 |
| B | 3 | 64 | 146007 | 893.39 | 855 | 835 | 162.5 |
| B | 4 | 81 | 106869 | 652.53 | 855 | 835 | 162.5 |
| C | 15 | 208 | 62650 | 318.78 | 839 | 842 | 193.9 |
| C | 7 | 238 | 25629 | 127.84 | 839 | 842 | 193.9 |
| C | 7 | 239 | 8204 | 37.97 | 839 | 842 | 193.9 |
| D | 10 | 157 | 1371586 | 7098.13 | 804 | 781 | 193.1 |
| D | 10 | 199 | 1079832 | 5587.41 | 804 | 781 | 193.1 |
| D | 13 | 249 | 30286 | 152.78 | 804 | 781 | 193.1 |
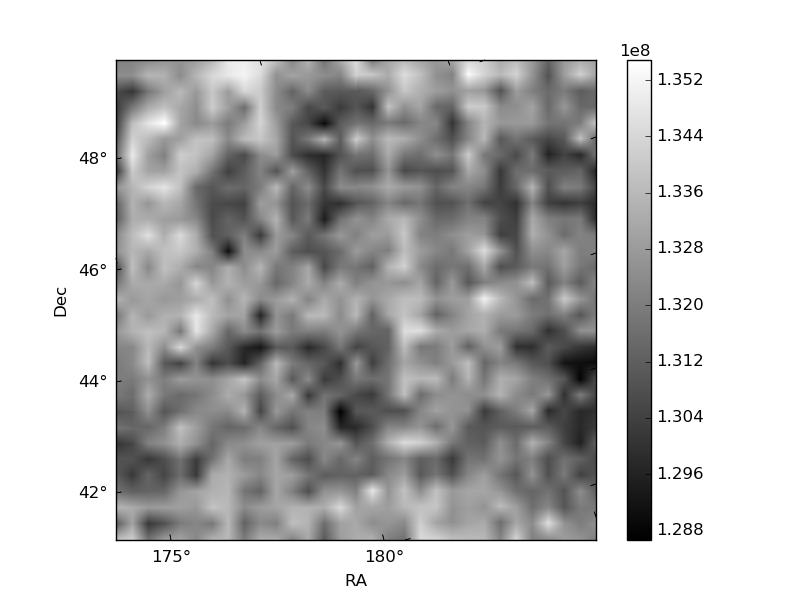
Histogram calculated using DETX and DETY for each event in the final _common_clean file
| Quadrant A | 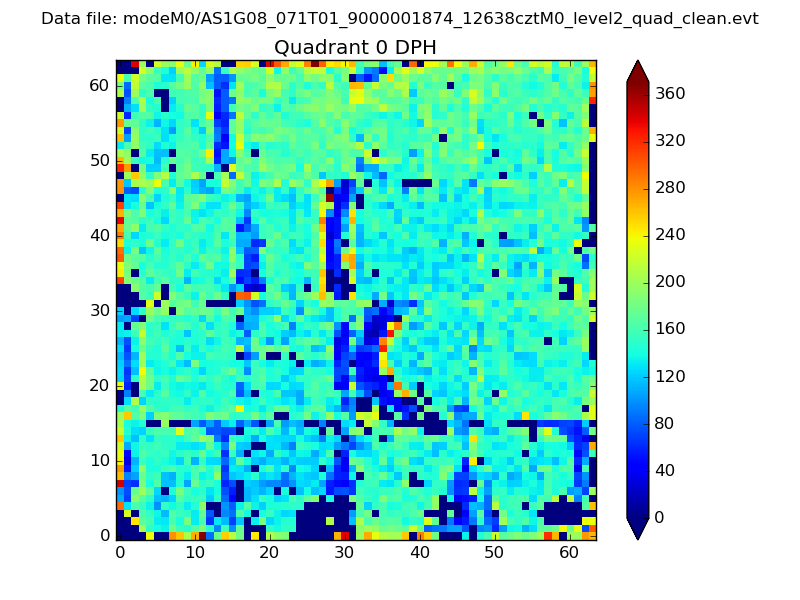 |
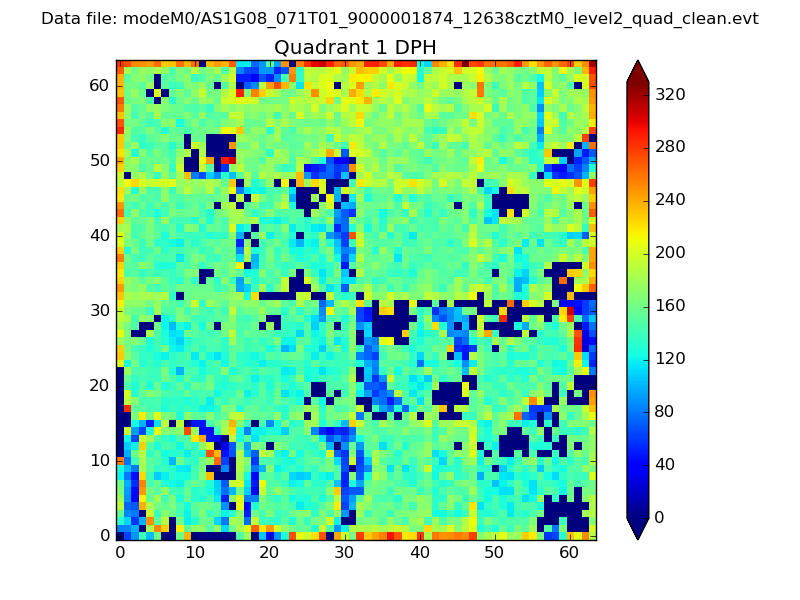 |
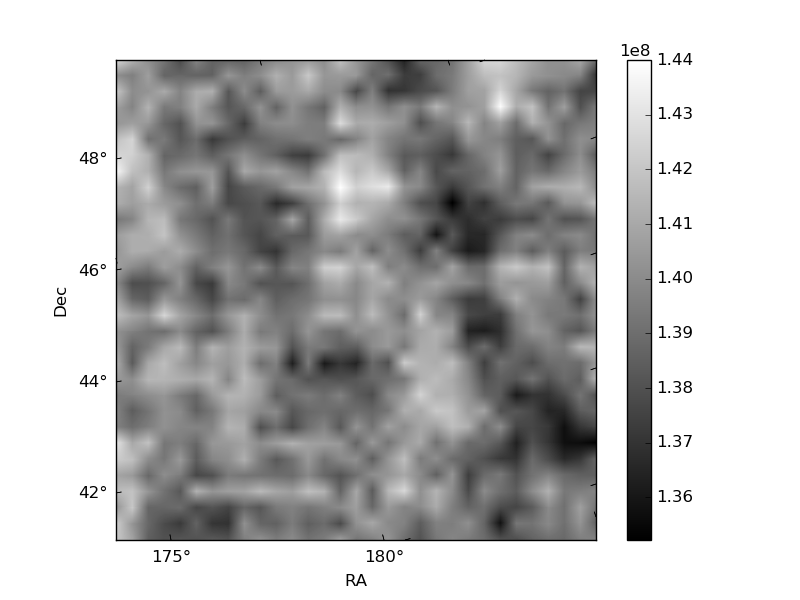
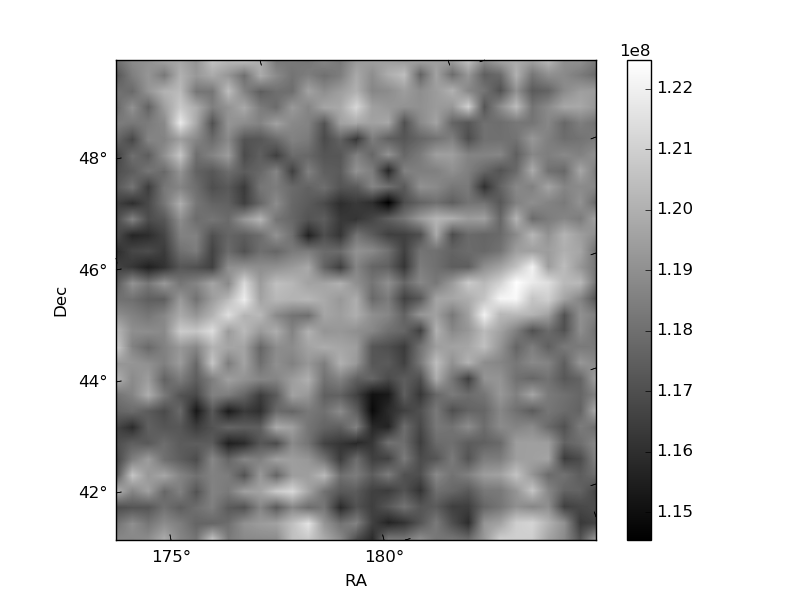
Quadrant B |
|---|---|---|---|
| Quadrant D |  |
 |
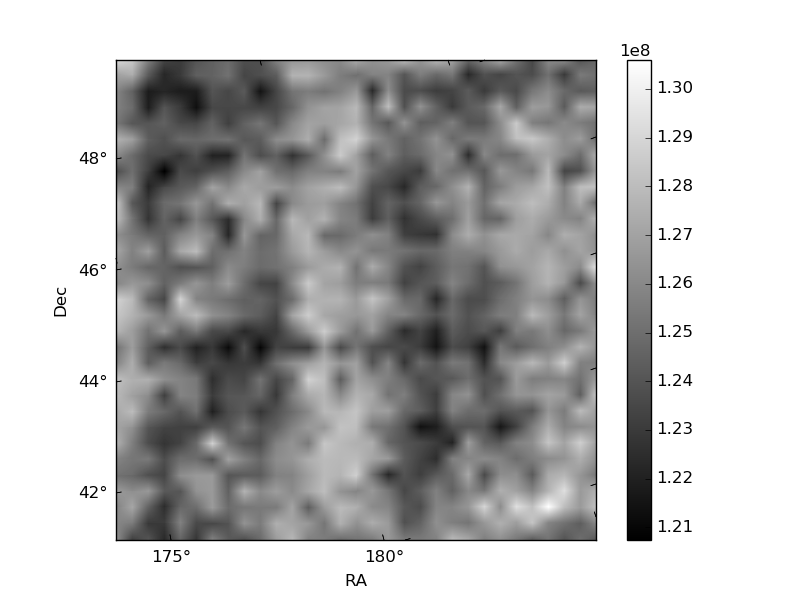
Quadrant C |
| Plot type | Count rate plots | Images |
|---|---|---|
| Comparison with Poisson distribution Blue bars denote a histogram of data divided into 1 sec bins. Red curve is a Poisson curve with rate = median count rate of data. |
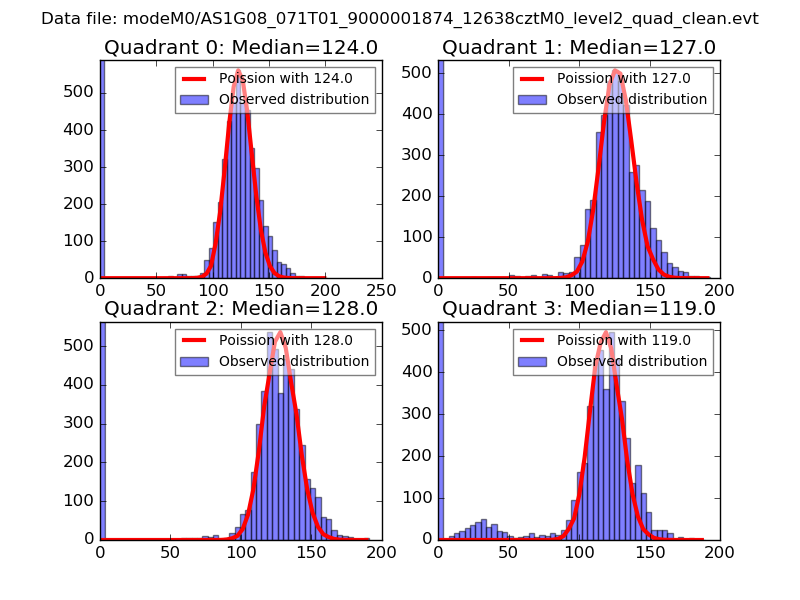 |
 |
| Quadrant-wise count rates Data is divided into 100 sec bins |
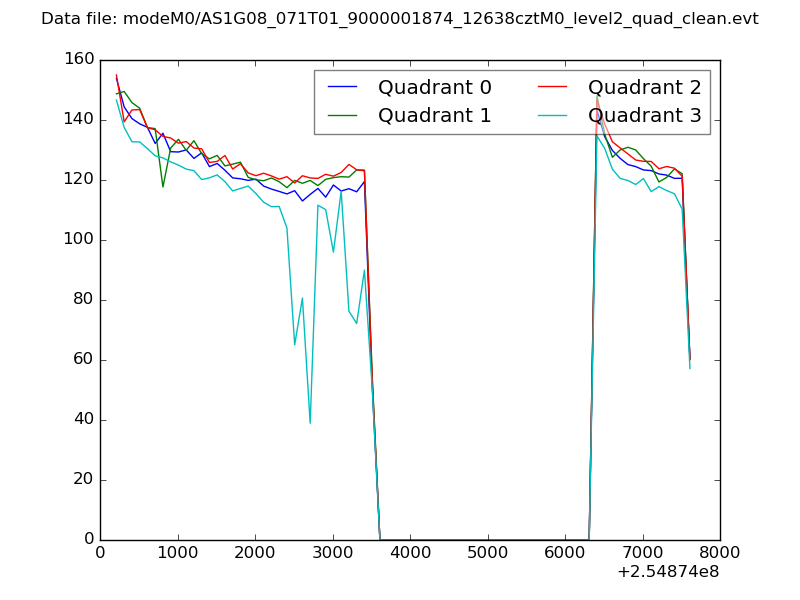 |
|
| Module-wise count rates for Quadrant A Data is divided into 100 sec bins |
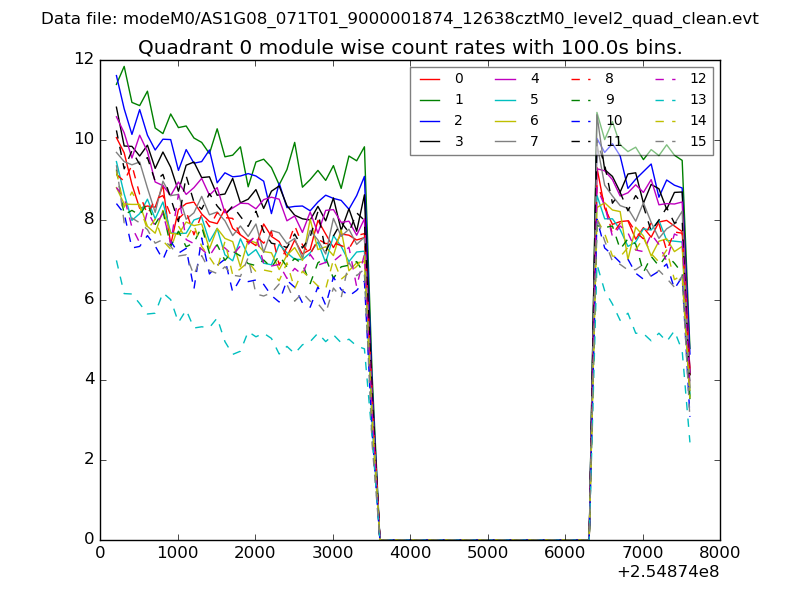 |
 |
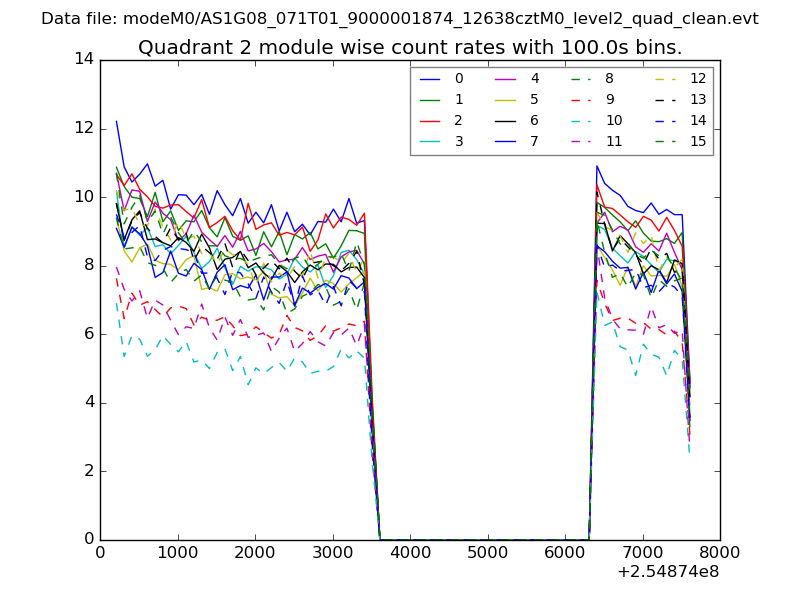
| Module-wise count rates for Quadrant B Data is divided into 100 sec bins |
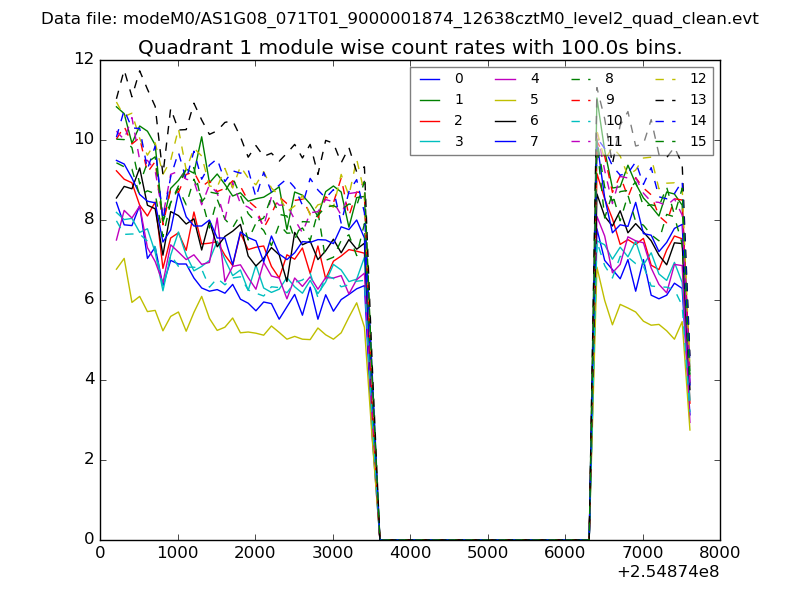 |
 |
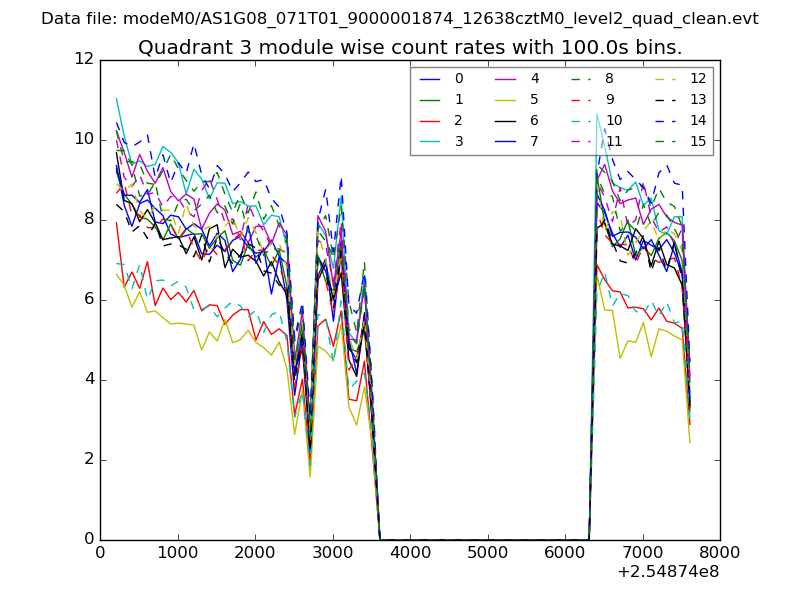
| Module-wise count rates for Quadrant C Data is divided into 100 sec bins |
 |
 |
| Module-wise count rates for Quadrant D Data is divided into 100 sec bins |
 |
 |
| Parameter | Plot |
|---|---|
| CZT HV Monitor | 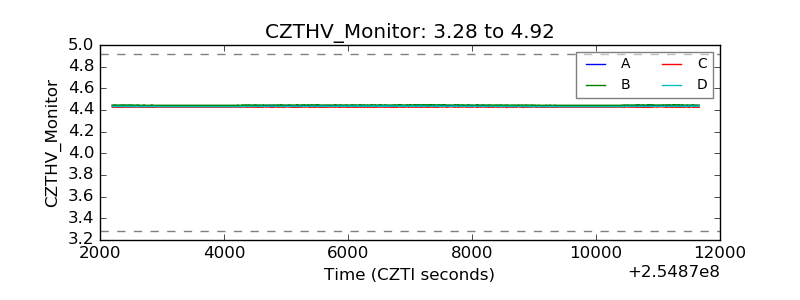 |
| D_VDD | 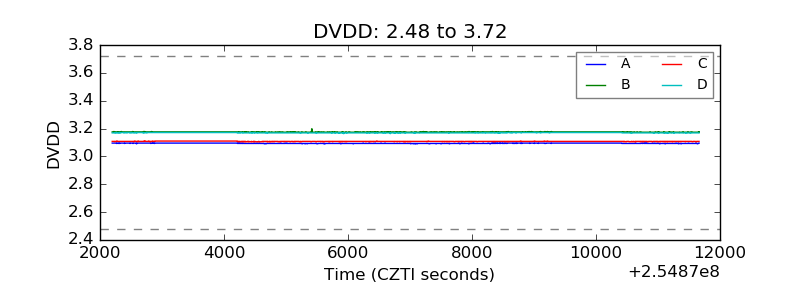 |
| Temperature 1 | 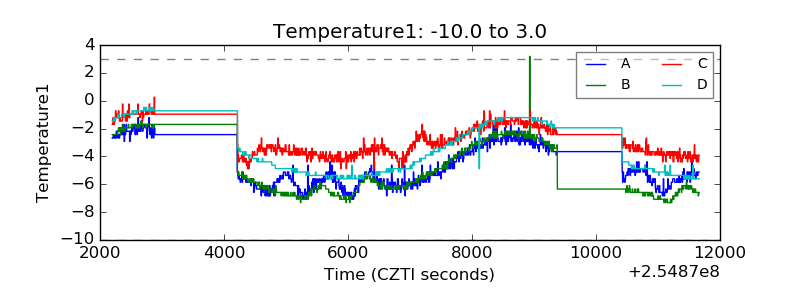 |
| Veto HV Monitor | 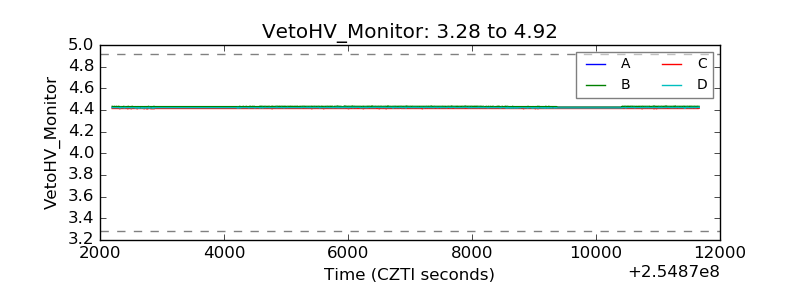 |
| Veto LLD | 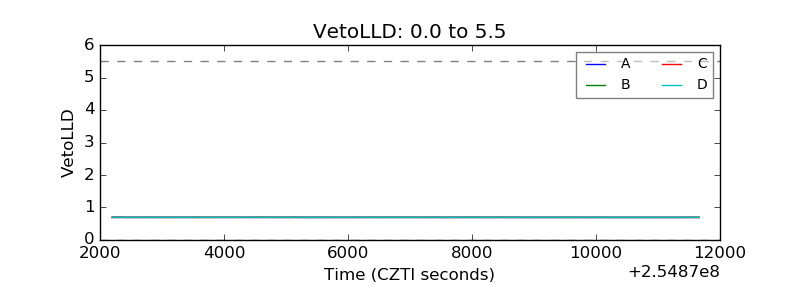 |
| Alpha Counter | 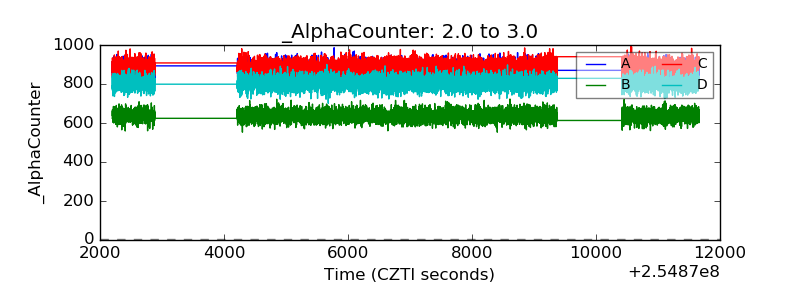 |
| _CPM_Rate | 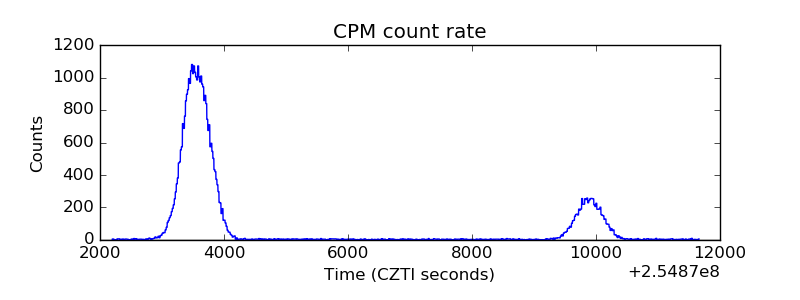 |
| CZT Counter |  |
| +2.5 Volts monitor |  |
| +5 Volts monitor | 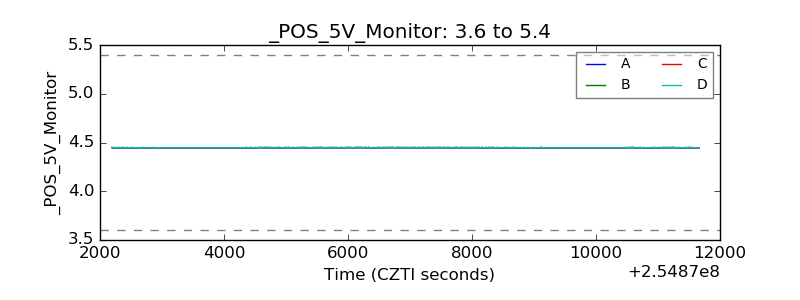 |
| _ROLL_ROT | 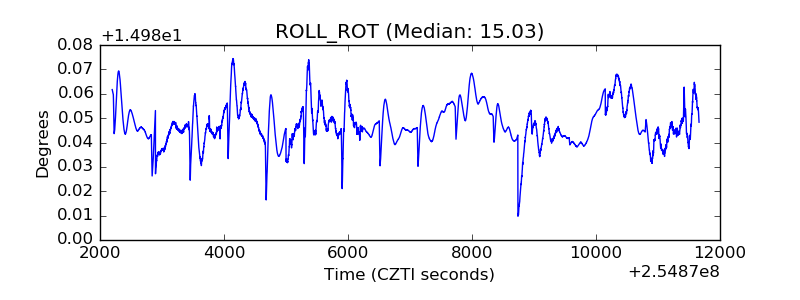 |
| _Roll_DEC | 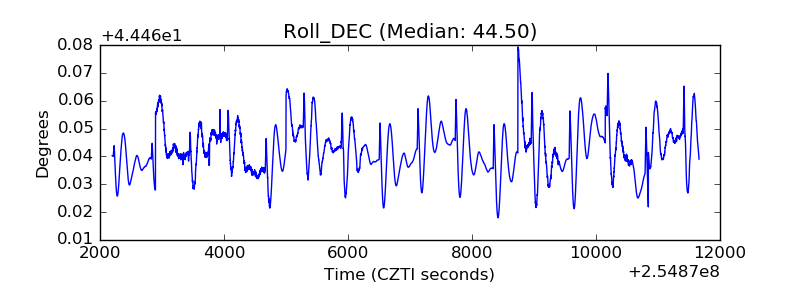 |
| _Roll_RA |  |
| Veto Counter | 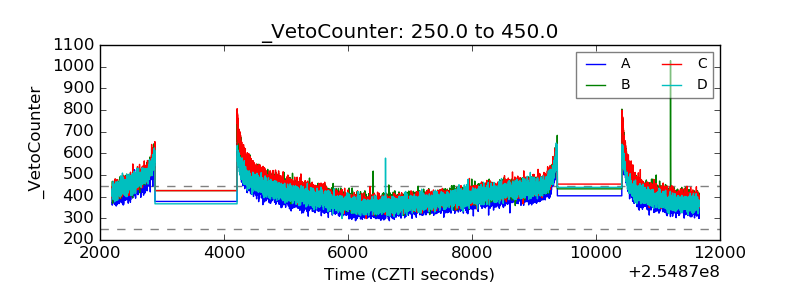 |