| Param | Original file | Final file |
|---|---|---|
| Filename | modeM0/AS1G08_071T01_9000001874_12639cztM0_level2.evt | modeM0/AS1G08_071T01_9000001874_12639cztM0_level2_quad_clean.evt |
| Size (bytes) | 538,053,120 | 98,568,000 |
| Size | 513.1 MB | 94.0 MB |
| Events in quadrant A | 3,432,433 | 620,806 |
| Events in quadrant B | 4,575,788 | 616,473 |
| Events in quadrant C | 3,455,933 | 633,487 |
| Events in quadrant D | 4,328,797 | 599,273 |
| Mode SS | |||
|---|---|---|---|
| Quadrant | BADHDUFLAG | Total packets | Discarded packets |
| A | 0 | 152 | 0 |
| B | 0 | 152 | 0 |
| C | 0 | 152 | 0 |
| D | 0 | 152 | 0 |
| Mode M0 | |||
|---|---|---|---|
| Quadrant | BADHDUFLAG | Total packets | Discarded packets |
| A | 0 | 15473 | 3 |
| B | 0 | 18604 | 2 |
| C | 0 | 15602 | 2 |
| D | 0 | 17983 | 2 |
| Mode M9 | |||
|---|---|---|---|
| Quadrant | BADHDUFLAG | Total packets | Discarded packets |
| A | 0 | 17 | 0 |
| B | 0 | 17 | 0 |
| C | 0 | 17 | 0 |
| D | 0 | 17 | 0 |
| Quadrant | Total seconds | Saturated seconds | Saturation percentage |
|---|---|---|---|
| A | 7399 | 61 | 0.824436% |
| B | 7399 | 358 | 4.838492% |
| C | 7399 | 43 | 0.581160% |
| D | 7399 | 99 | 1.338019% |
Noise dominated data is calculated using 1-second bins in cleaned event files. If a bin has >2000 counts, and if more than 50% of those come from <1% of pixels, then it is considered to be noise-dominated and hence unusable.
| Quadrant | # 1 sec bins | Bins with >0 counts | Bins with >2000 counts | High rate bins dominated by noise | Noise dominated (total time) | Noise dominated (detector-on time) | Marked lightcurve |
|---|---|---|---|---|---|---|---|
| A | 9045 | 7401 | 0 | 0 | 0.00% | 0.00% | 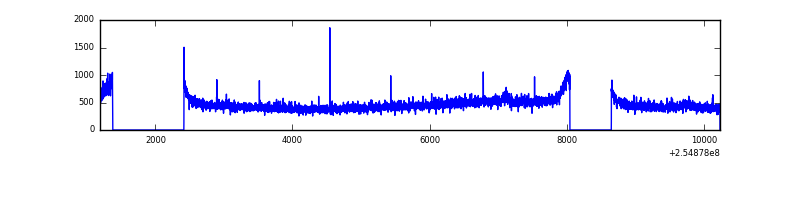 |
| B | 9045 | 7400 | 157 | 157 | 1.74% | 2.12% | 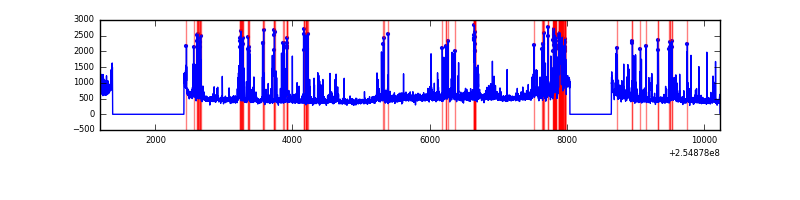 |
| C | 9045 | 7401 | 7 | 7 | 0.08% | 0.09% | 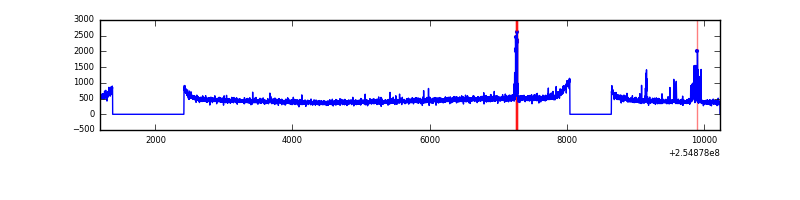 |
| D | 9045 | 7401 | 70 | 70 | 0.77% | 0.95% | 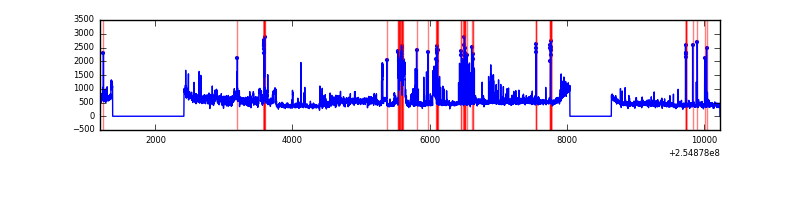 |
Top three noisy pixels from each quadrant. If the there are fewer than three noisy pixels in the level2.evt file, extra rows are filled as -1
| Pixel properties | Quadrant properties | ||||||
|---|---|---|---|---|---|---|---|
| Quadrant | DetID | PixID | Counts | Sigma | Mean | Median | Sigma |
| A | 8 | 15 | 87765 | 486.91 | 867 | 848 | 178.5 |
| A | 0 | 226 | 7745 | 38.64 | 867 | 848 | 178.5 |
| A | 12 | 194 | 6727 | 32.93 | 867 | 848 | 178.5 |
| B | 4 | 239 | 872260 | 5316.24 | 858 | 838 | 163.9 |
| B | 11 | 51 | 176631 | 1072.45 | 858 | 838 | 163.9 |
| B | 4 | 81 | 89708 | 542.16 | 858 | 838 | 163.9 |
| C | 15 | 208 | 88706 | 441.83 | 855 | 859 | 198.8 |
| C | 14 | 234 | 32227 | 157.77 | 855 | 859 | 198.8 |
| C | 13 | 61 | 6191 | 26.82 | 855 | 859 | 198.8 |
| D | 10 | 157 | 760552 | 3741.0 | 840 | 814 | 203.1 |
| D | 1 | 52 | 156465 | 766.43 | 840 | 814 | 203.1 |
| D | 8 | 195 | 89098 | 434.72 | 840 | 814 | 203.1 |
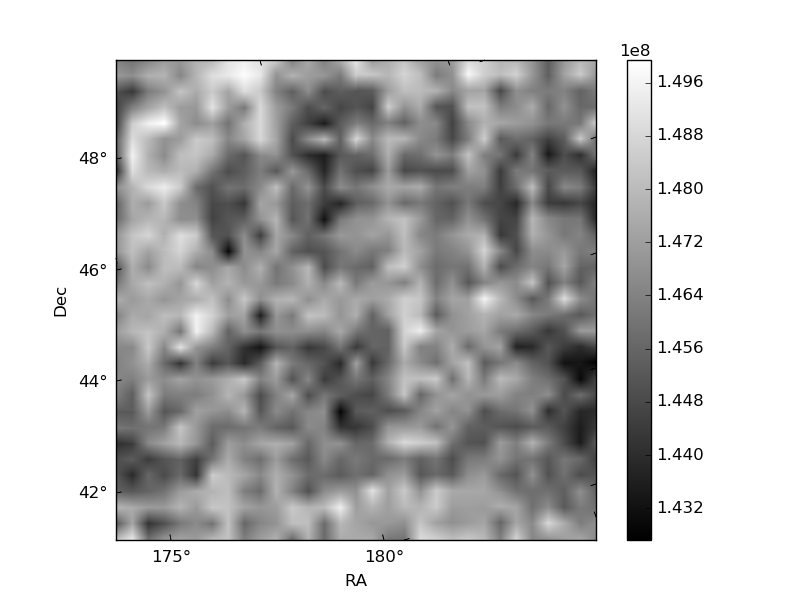
Histogram calculated using DETX and DETY for each event in the final _common_clean file
| Quadrant A | 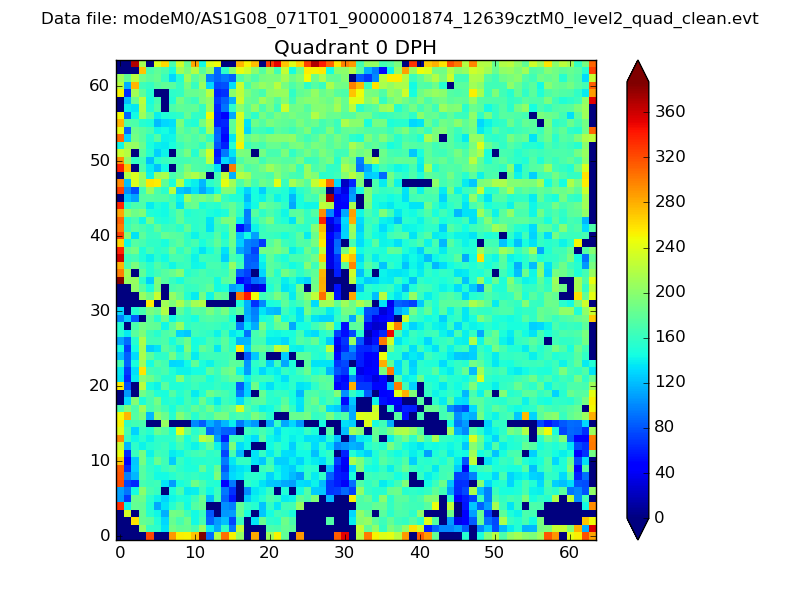 |
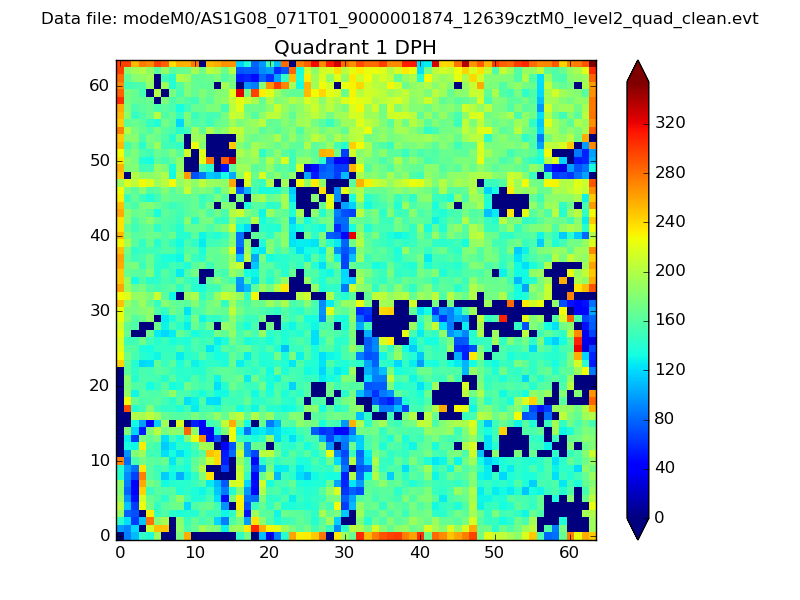 |
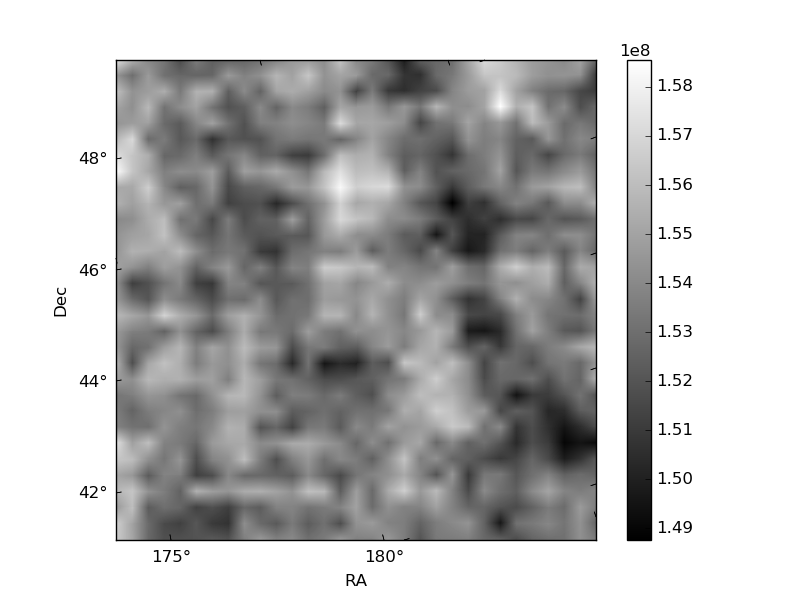
Quadrant B |
|---|---|---|---|
| Quadrant D | 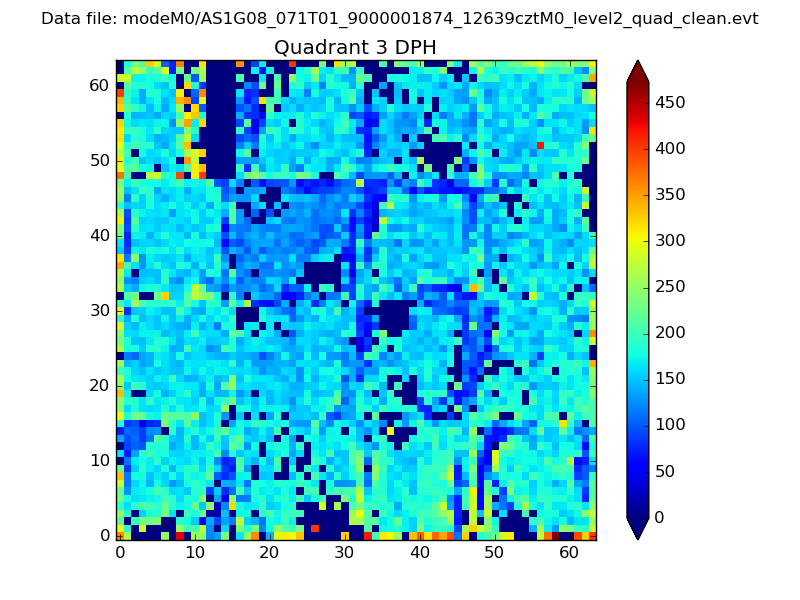 |
 |
Quadrant C |
| Plot type | Count rate plots | Images |
|---|---|---|
| Comparison with Poisson distribution Blue bars denote a histogram of data divided into 1 sec bins. Red curve is a Poisson curve with rate = median count rate of data. |
 |
 |
| Quadrant-wise count rates Data is divided into 100 sec bins |
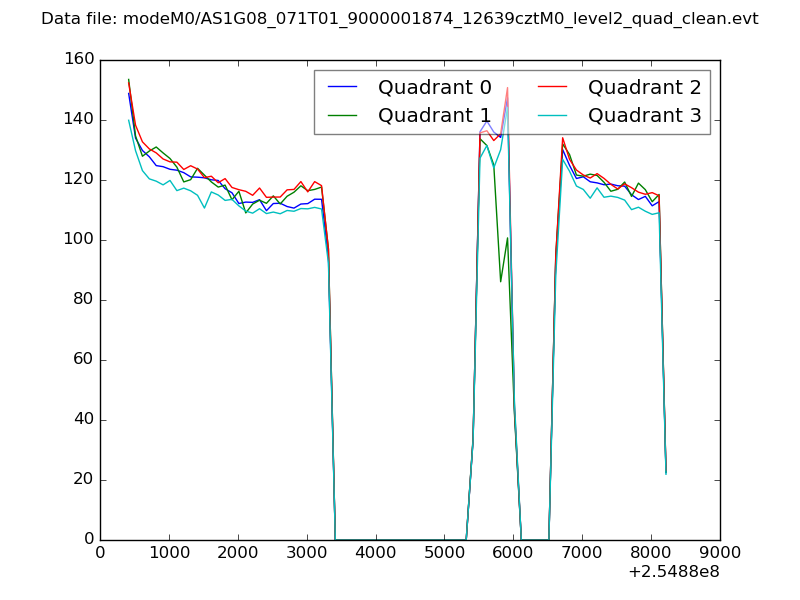 |
|
| Module-wise count rates for Quadrant A Data is divided into 100 sec bins |
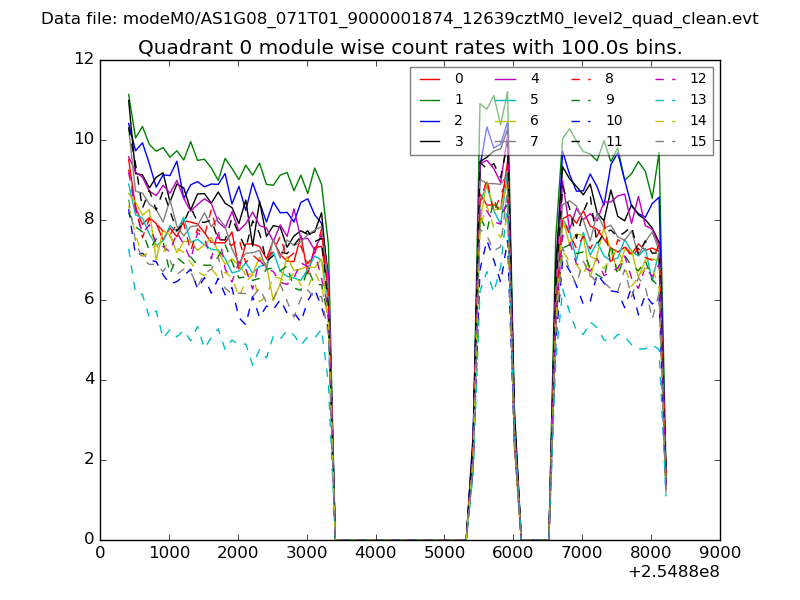 |
 |
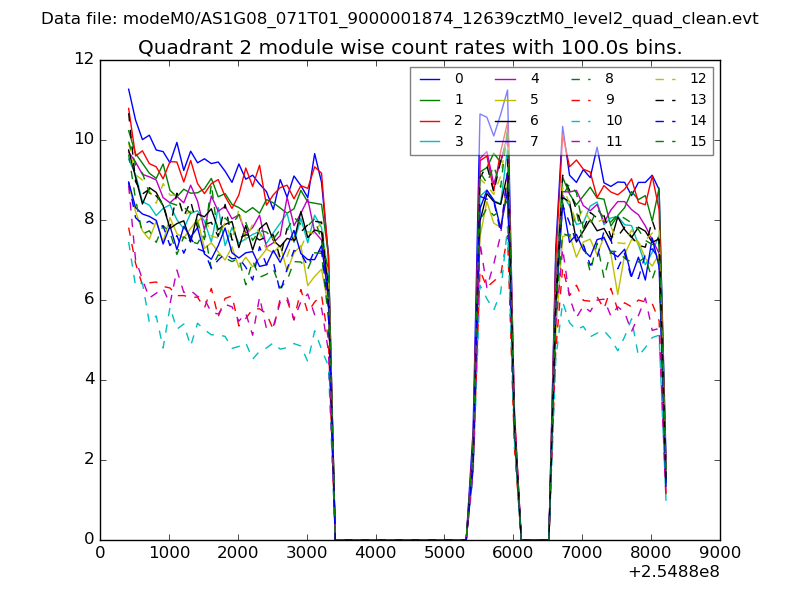
| Module-wise count rates for Quadrant B Data is divided into 100 sec bins |
 |
 |
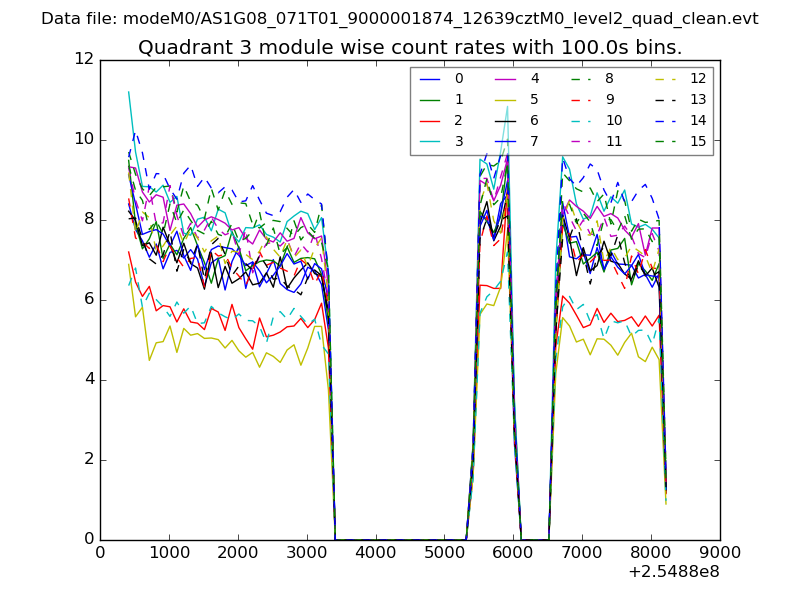
| Module-wise count rates for Quadrant C Data is divided into 100 sec bins |
 |
 |
| Module-wise count rates for Quadrant D Data is divided into 100 sec bins |
 |
 |
| Parameter | Plot |
|---|---|
| CZT HV Monitor | 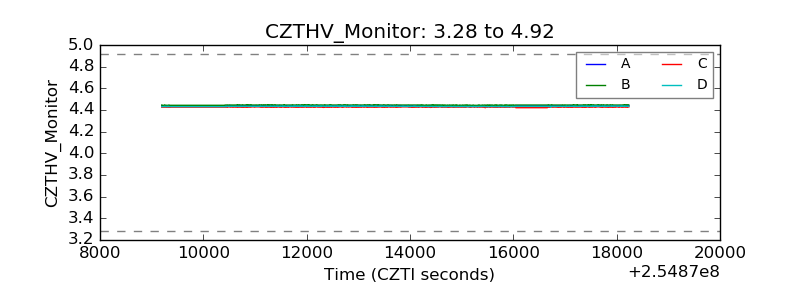 |
| D_VDD | 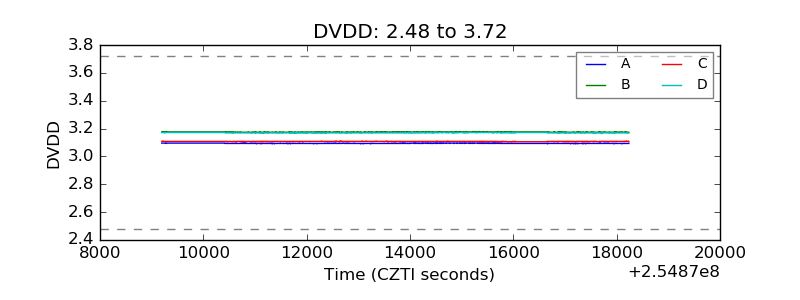 |
| Temperature 1 | 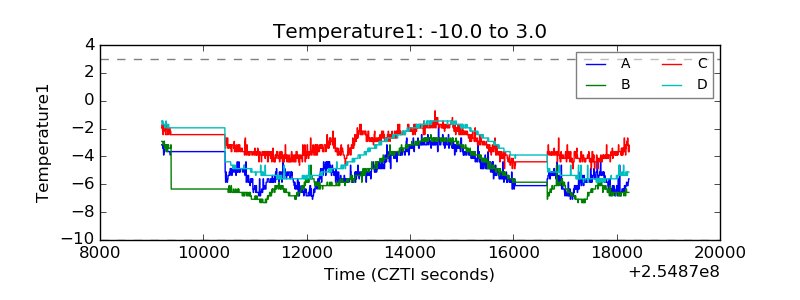 |
| Veto HV Monitor | 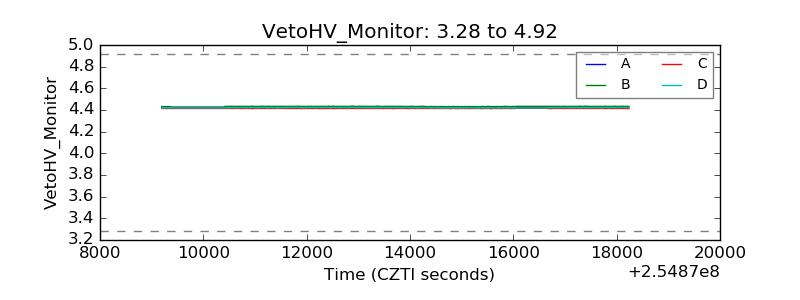 |
| Veto LLD | 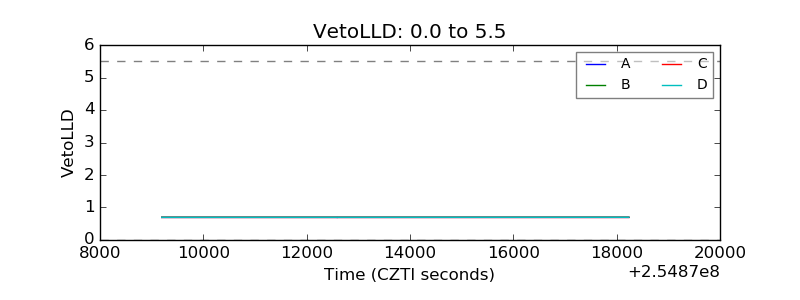 |
| Alpha Counter | 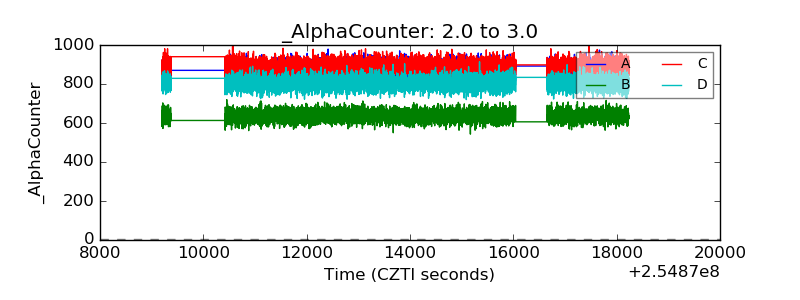 |
| _CPM_Rate | 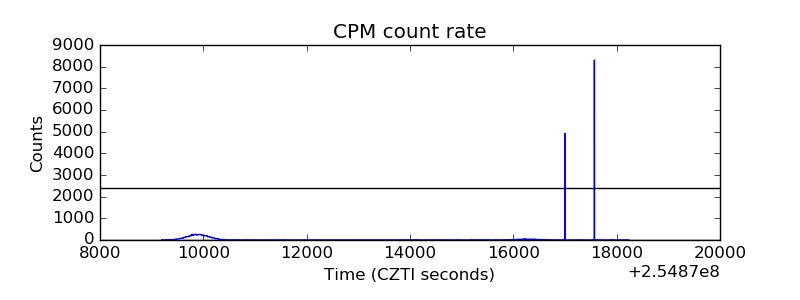 |
| CZT Counter | 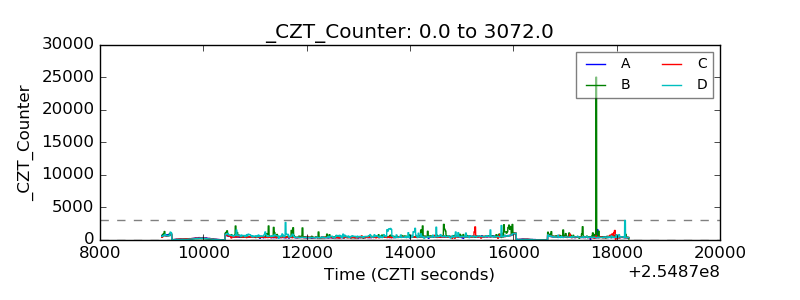 |
| +2.5 Volts monitor |  |
| +5 Volts monitor |  |
| _ROLL_ROT | 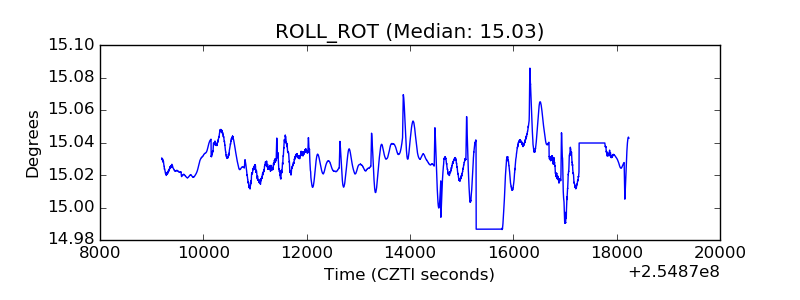 |
| _Roll_DEC | 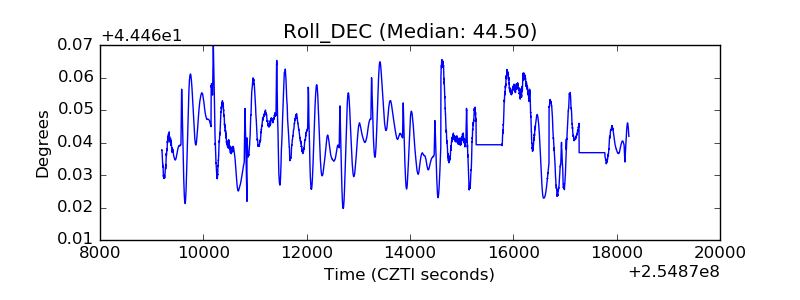 |
| _Roll_RA | 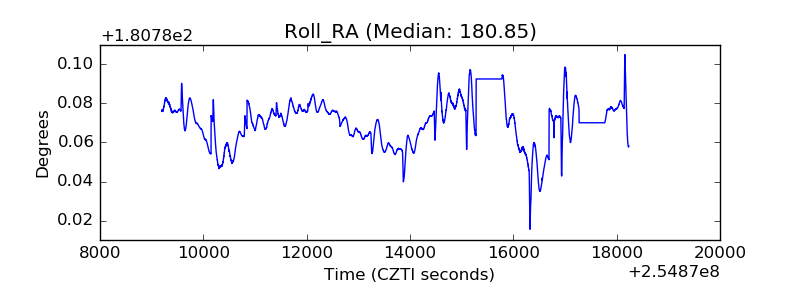 |
| Veto Counter |  |