| Param | Original file | Final file |
|---|---|---|
| Filename | modeM0/AS1G08_071T01_9000001874_12640cztM0_level2.evt | modeM0/AS1G08_071T01_9000001874_12640cztM0_level2_quad_clean.evt |
| Size (bytes) | 201,024,000 | 37,825,920 |
| Size | 191.7 MB | 36.1 MB |
| Events in quadrant A | 1,413,721 | 242,591 |
| Events in quadrant B | 1,613,784 | 230,738 |
| Events in quadrant C | 1,392,906 | 246,333 |
| Events in quadrant D | 1,485,663 | 236,333 |
| Mode SS | |||
|---|---|---|---|
| Quadrant | BADHDUFLAG | Total packets | Discarded packets |
| A | 0 | 152 | 94 |
| B | 0 | 152 | 100 |
| C | 0 | 151 | 89 |
| D | 0 | 152 | 92 |
| Mode M0 | |||
|---|---|---|---|
| Quadrant | BADHDUFLAG | Total packets | Discarded packets |
| A | 0 | 15262 | 9421 |
| B | 0 | 18030 | 11636 |
| C | 0 | 18329 | 12617 |
| D | 0 | 16052 | 9946 |
| Mode M9 | |||
|---|---|---|---|
| Quadrant | BADHDUFLAG | Total packets | Discarded packets |
| A | 0 | 8 | 5 |
| B | 0 | 8 | 4 |
| C | 0 | 8 | 4 |
| D | 0 | 7 | 2 |
| Quadrant | Total seconds | Saturated seconds | Saturation percentage |
|---|---|---|---|
| A | 2687 | 135 | 5.024191% |
| B | 2560 | 188 | 7.343750% |
| C | 2601 | 67 | 2.575932% |
| D | 2683 | 80 | 2.981737% |
Noise dominated data is calculated using 1-second bins in cleaned event files. If a bin has >2000 counts, and if more than 50% of those come from <1% of pixels, then it is considered to be noise-dominated and hence unusable.
| Quadrant | # 1 sec bins | Bins with >0 counts | Bins with >2000 counts | High rate bins dominated by noise | Noise dominated (total time) | Noise dominated (detector-on time) | Marked lightcurve |
|---|---|---|---|---|---|---|---|
| A | 7971 | 3210 | 0 | 0 | 0.00% | 0.00% | 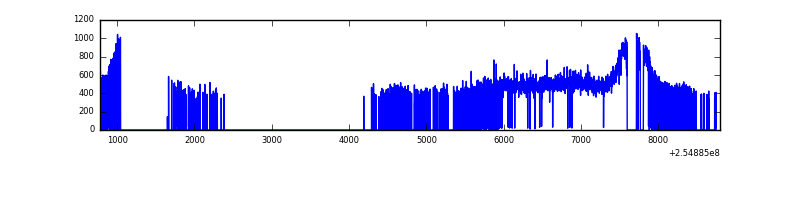 |
| B | 7880 | 2995 | 22 | 22 | 0.28% | 0.73% | 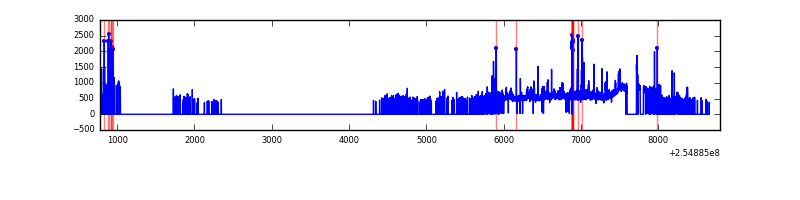 |
| C | 8018 | 3030 | 0 | 0 | 0.00% | 0.00% | 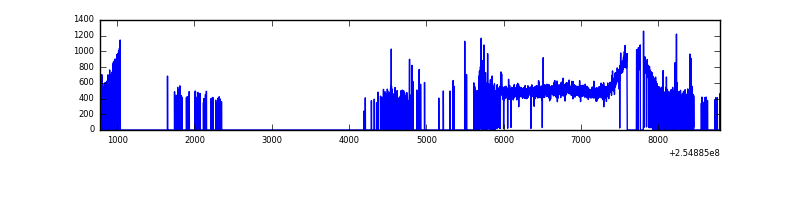 |
| D | 7975 | 3164 | 4 | 4 | 0.05% | 0.13% | 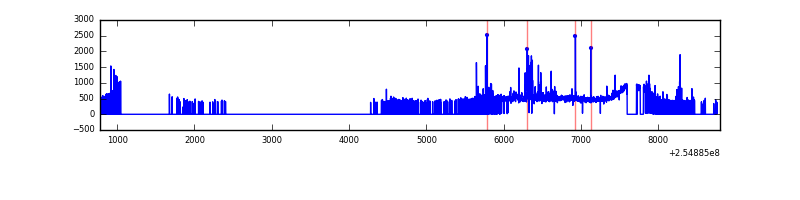 |
Top three noisy pixels from each quadrant. If the there are fewer than three noisy pixels in the level2.evt file, extra rows are filled as -1
| Pixel properties | Quadrant properties | ||||||
|---|---|---|---|---|---|---|---|
| Quadrant | DetID | PixID | Counts | Sigma | Mean | Median | Sigma |
| A | 8 | 15 | 17288 | 220.78 | 361 | 351 | 76.7 |
| A | 14 | 239 | 3461 | 40.53 | 361 | 351 | 76.7 |
| A | 0 | 226 | 3194 | 37.05 | 361 | 351 | 76.7 |
| B | 4 | 239 | 157999 | 2284.83 | 341 | 331 | 69.0 |
| B | 11 | 51 | 83748 | 1208.83 | 341 | 331 | 69.0 |
| B | 3 | 209 | 21392 | 305.2 | 341 | 331 | 69.0 |
| C | 15 | 208 | 31576 | 370.56 | 348 | 350 | 84.3 |
| C | 13 | 61 | 2499 | 25.5 | 348 | 350 | 84.3 |
| C | 8 | 128 | 1518 | 13.86 | 348 | 350 | 84.3 |
| D | 13 | 249 | 73006 | 834.28 | 354 | 342 | 87.1 |
| D | 10 | 157 | 26939 | 305.37 | 354 | 342 | 87.1 |
| D | 1 | 52 | 16096 | 180.88 | 354 | 342 | 87.1 |
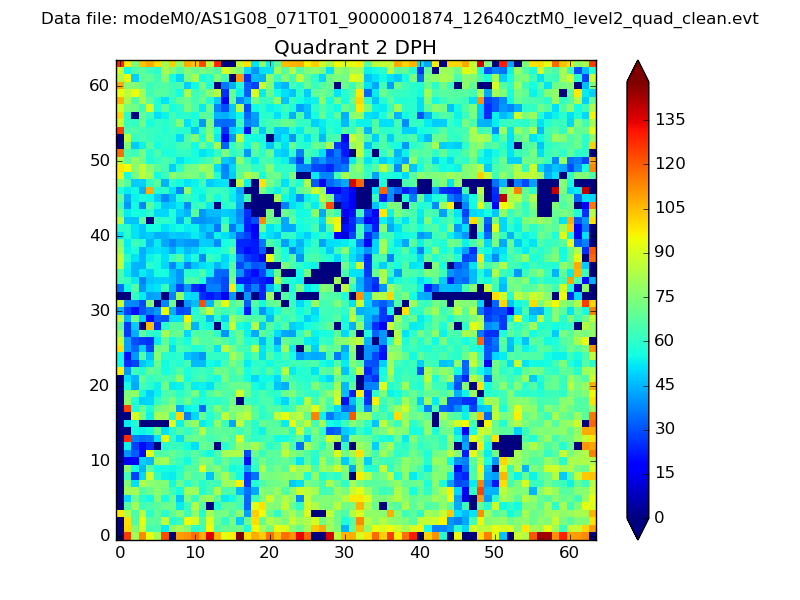
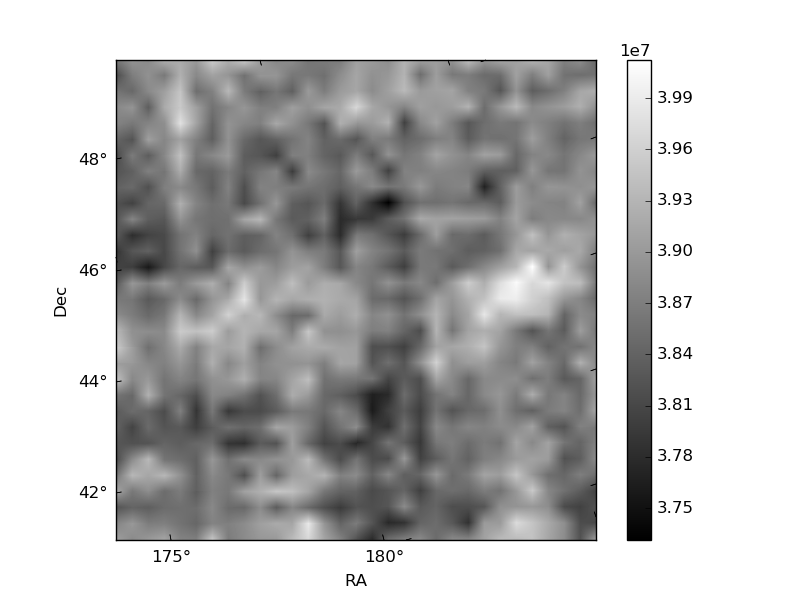
Histogram calculated using DETX and DETY for each event in the final _common_clean file
| Quadrant A | 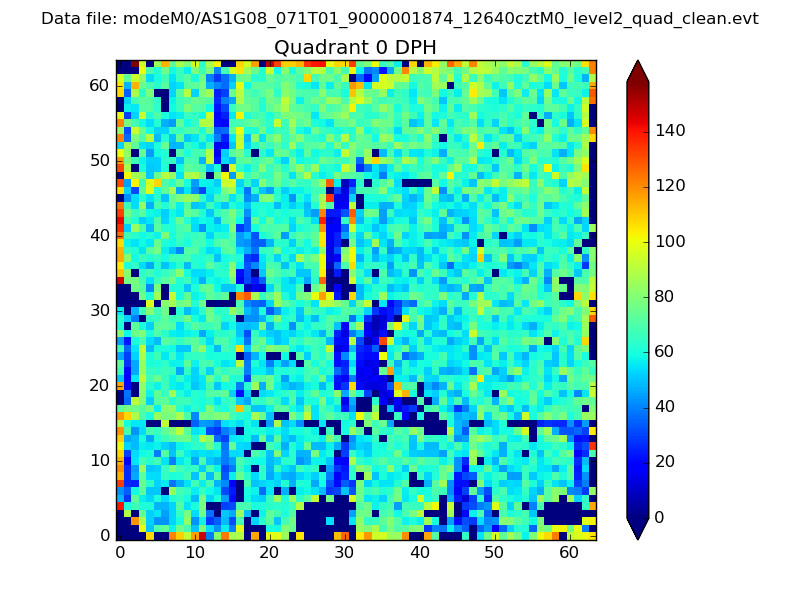 |
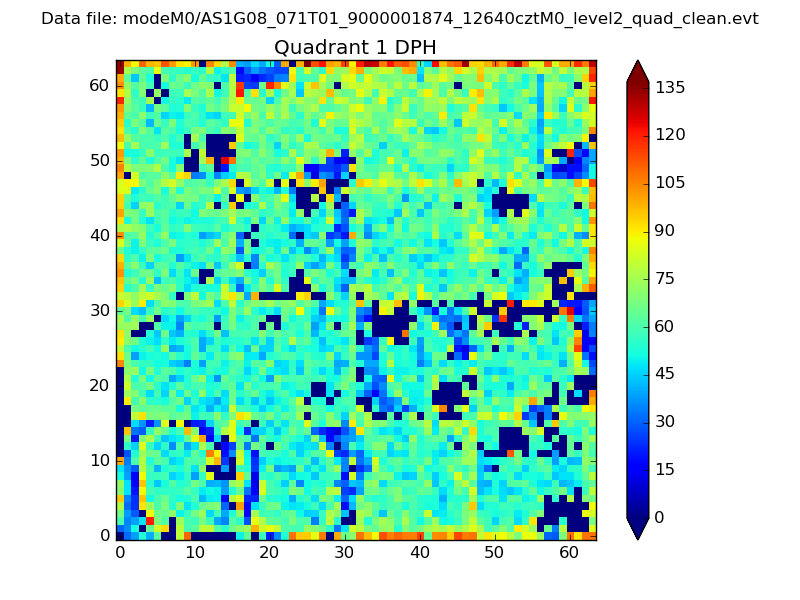 |
Quadrant B |
|---|---|---|---|
| Quadrant D | 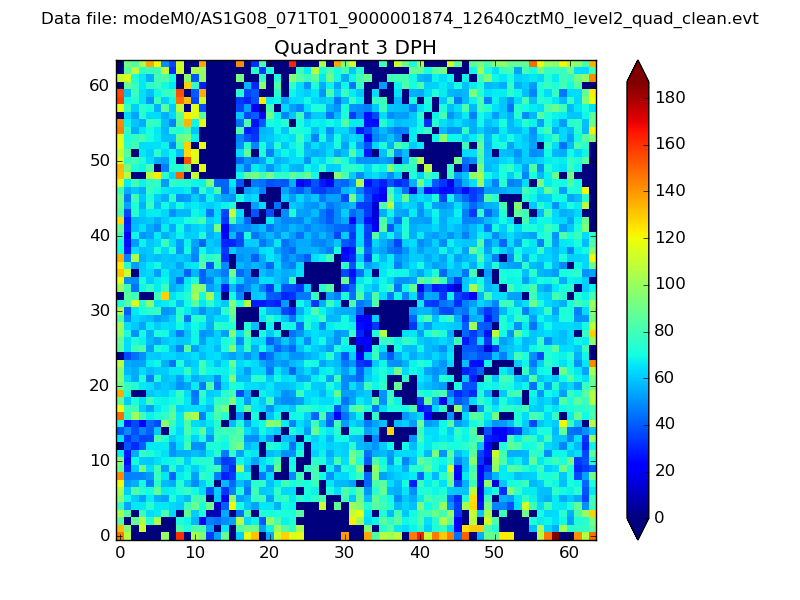 |
 |
Quadrant C |
| Plot type | Count rate plots | Images |
|---|---|---|
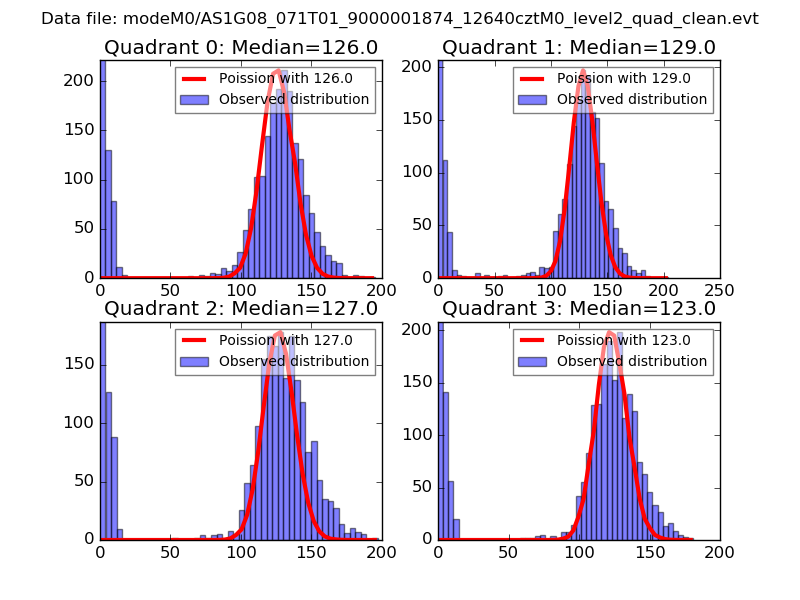
| Comparison with Poisson distribution Blue bars denote a histogram of data divided into 1 sec bins. Red curve is a Poisson curve with rate = median count rate of data. |
 |
 |
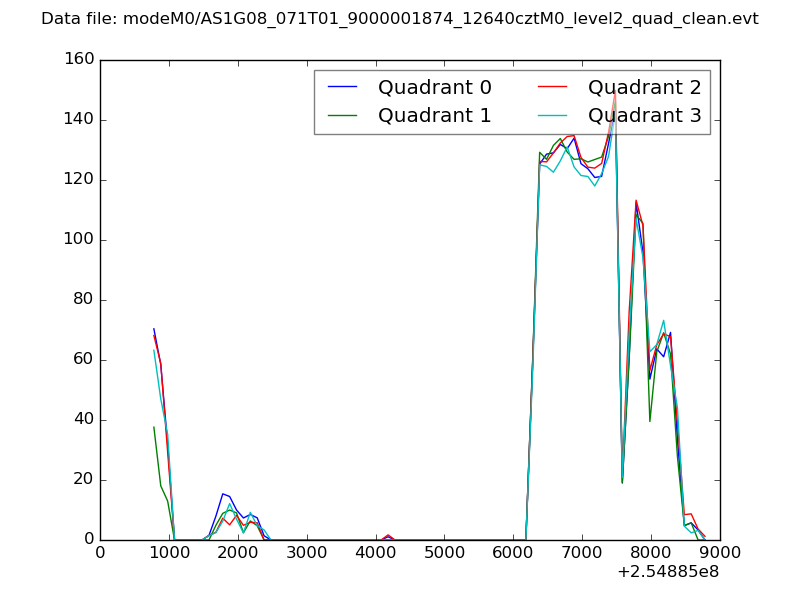
| Quadrant-wise count rates Data is divided into 100 sec bins |
 |
|
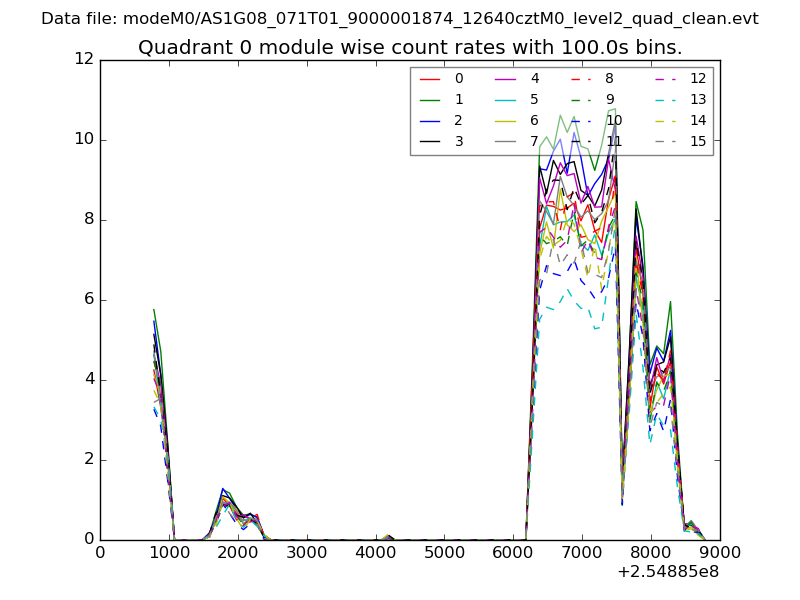
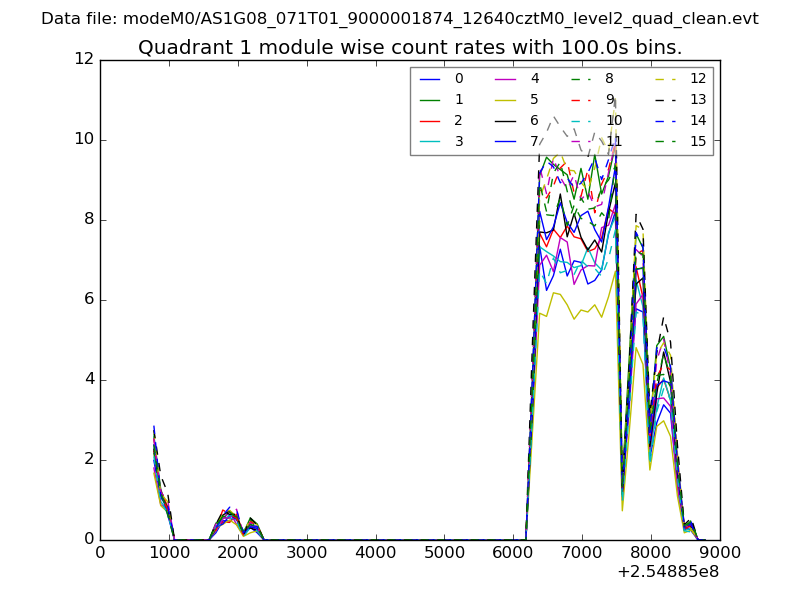
| Module-wise count rates for Quadrant A Data is divided into 100 sec bins |
 |
 |
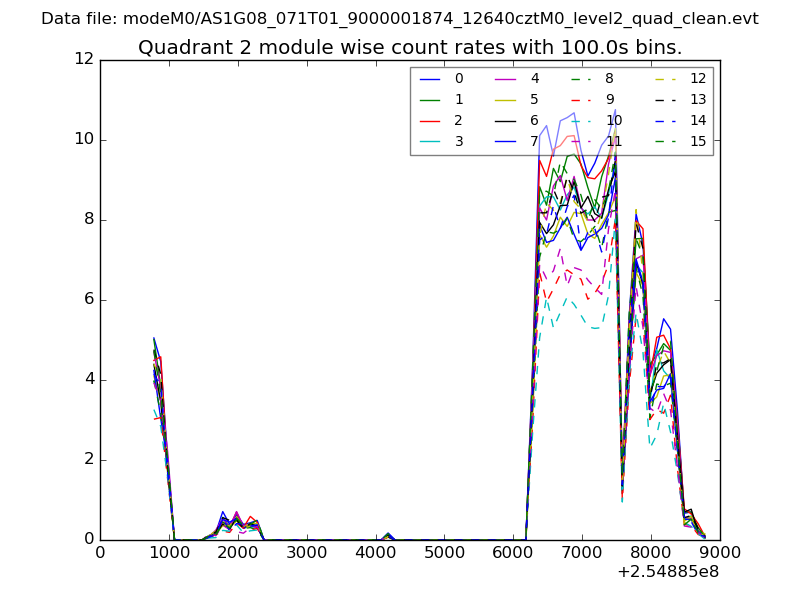
| Module-wise count rates for Quadrant B Data is divided into 100 sec bins |
 |
 |
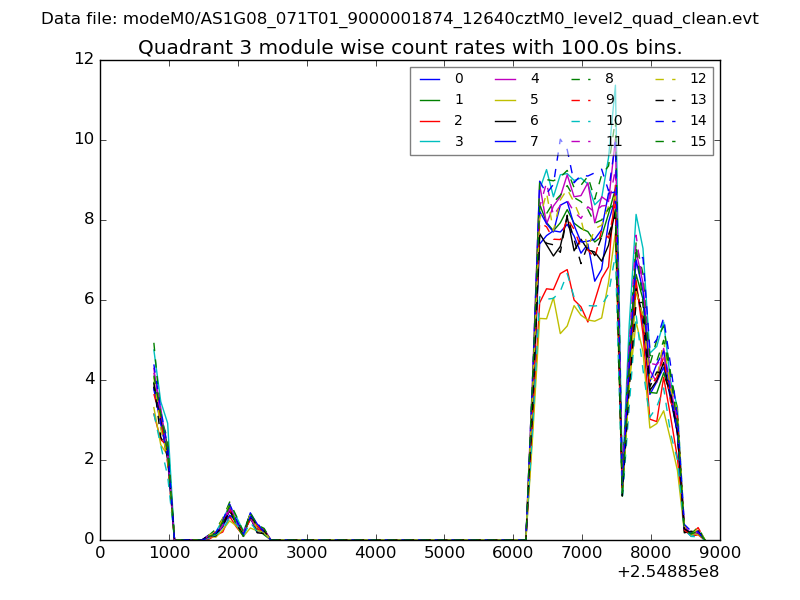
| Module-wise count rates for Quadrant C Data is divided into 100 sec bins |
 |
 |
| Module-wise count rates for Quadrant D Data is divided into 100 sec bins |
 |
 |
| Parameter | Plot |
|---|---|
| CZT HV Monitor | 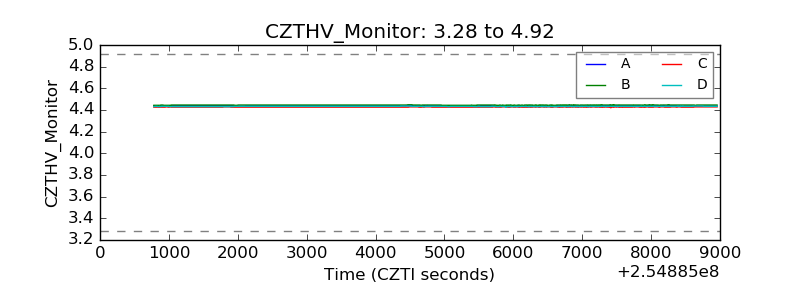 |
| D_VDD | 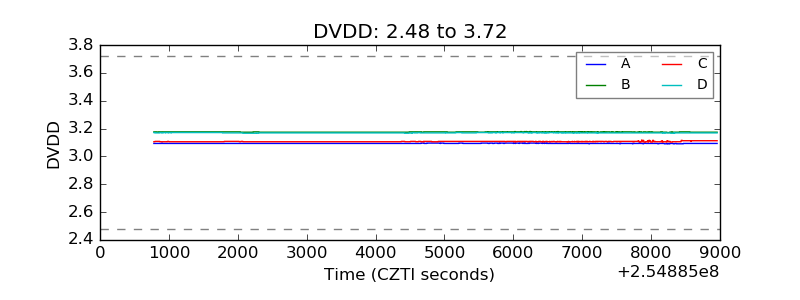 |
| Temperature 1 | 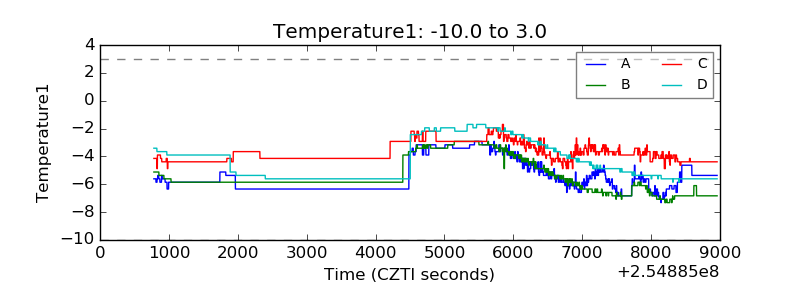 |
| Veto HV Monitor | 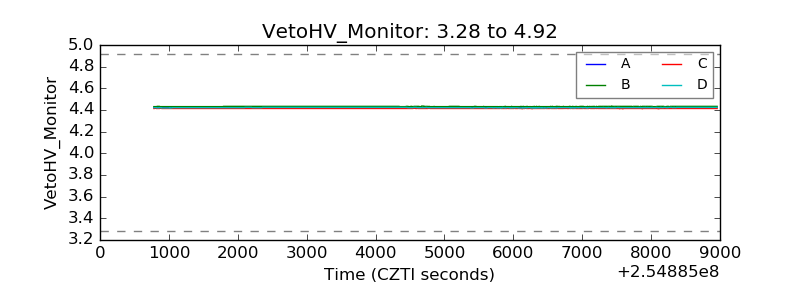 |
| Veto LLD | 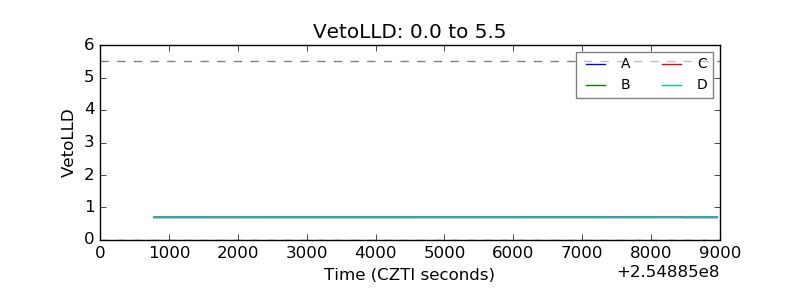 |
| Alpha Counter | 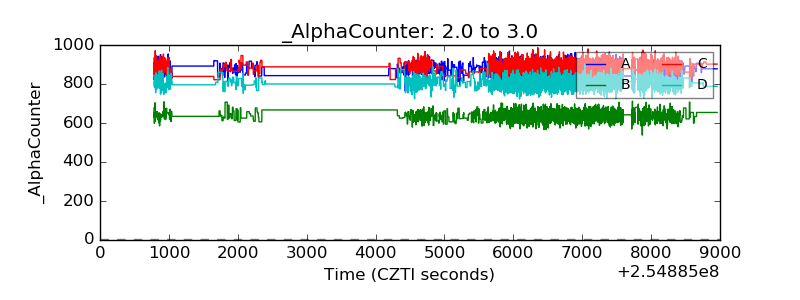 |
| _CPM_Rate | 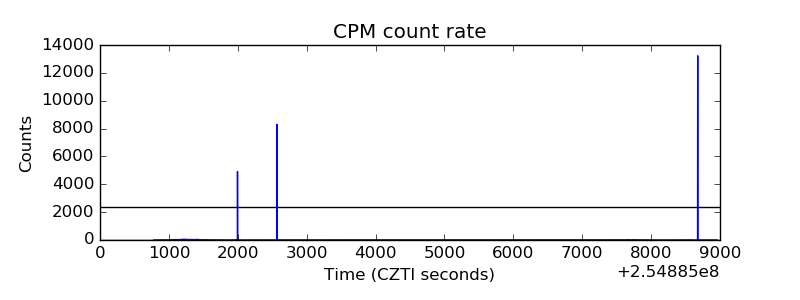 |
| CZT Counter | 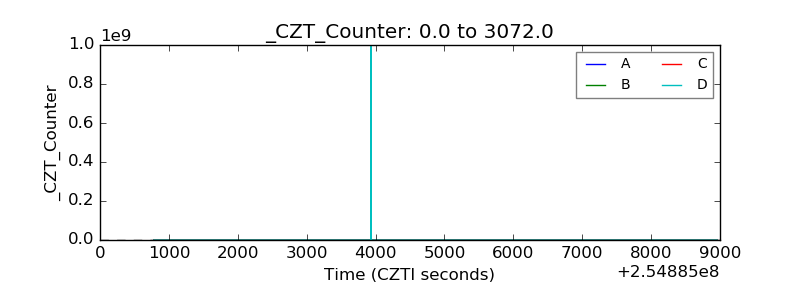 |
| +2.5 Volts monitor |  |
| +5 Volts monitor |  |
| _ROLL_ROT | 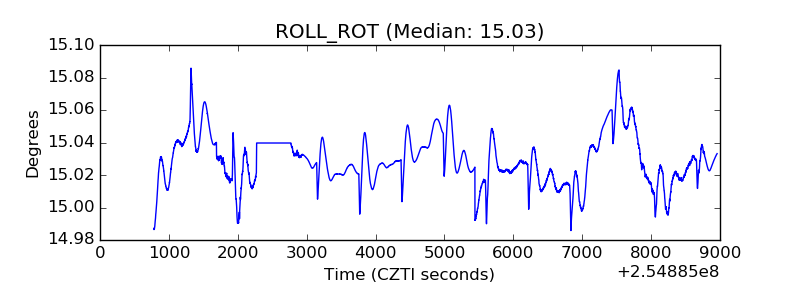 |
| _Roll_DEC | 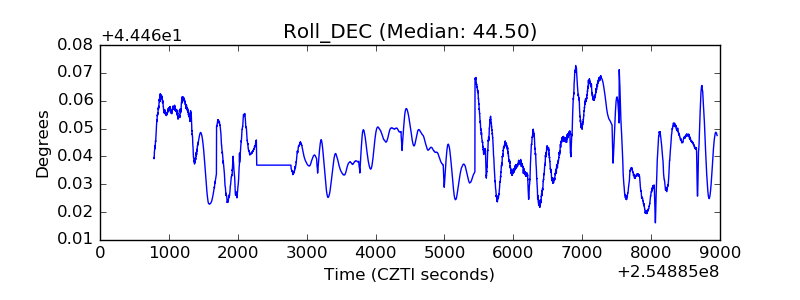 |
| _Roll_RA | 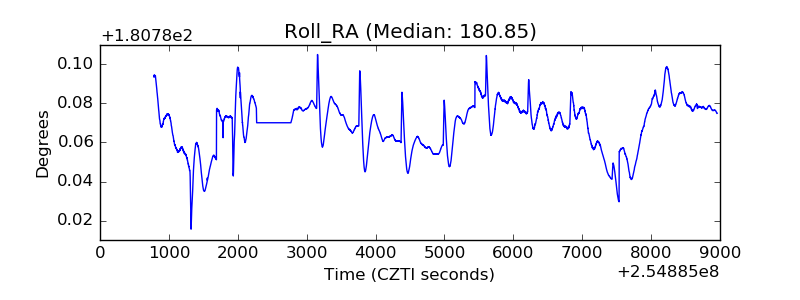 |
| Veto Counter | 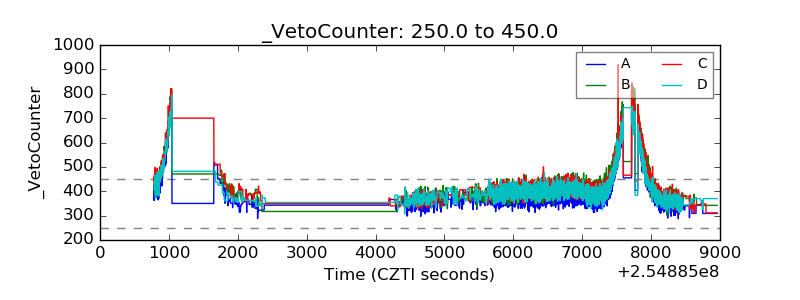 |