| Param | Original file | Final file |
|---|---|---|
| Filename | modeM0/AS1G08_071T01_9000001874_12641cztM0_level2.evt | modeM0/AS1G08_071T01_9000001874_12641cztM0_level2_quad_clean.evt |
| Size (bytes) | 879,998,400 | 162,887,040 |
| Size | 839.2 MB | 155.3 MB |
| Events in quadrant A | 5,731,118 | 1,008,719 |
| Events in quadrant B | 7,097,836 | 1,029,371 |
| Events in quadrant C | 6,777,944 | 1,034,098 |
| Events in quadrant D | 6,185,584 | 984,851 |
| Mode SS | |||
|---|---|---|---|
| Quadrant | BADHDUFLAG | Total packets | Discarded packets |
| A | 0 | 260 | 0 |
| B | 0 | 260 | 0 |
| C | 0 | 260 | 0 |
| D | 0 | 260 | 0 |
| Mode M0 | |||
|---|---|---|---|
| Quadrant | BADHDUFLAG | Total packets | Discarded packets |
| A | 0 | 26004 | 3 |
| B | 0 | 29460 | 2 |
| C | 0 | 29185 | 2 |
| D | 0 | 27405 | 2 |
| Mode M9 | |||
|---|---|---|---|
| Quadrant | BADHDUFLAG | Total packets | Discarded packets |
| A | 0 | 4 | 0 |
| B | 0 | 4 | 0 |
| C | 0 | 4 | 0 |
| D | 0 | 4 | 0 |
| Quadrant | Total seconds | Saturated seconds | Saturation percentage |
|---|---|---|---|
| A | 12671 | 212 | 1.673112% |
| B | 12671 | 373 | 2.943730% |
| C | 12671 | 417 | 3.290979% |
| D | 12671 | 204 | 1.609976% |
Noise dominated data is calculated using 1-second bins in cleaned event files. If a bin has >2000 counts, and if more than 50% of those come from <1% of pixels, then it is considered to be noise-dominated and hence unusable.
| Quadrant | # 1 sec bins | Bins with >0 counts | Bins with >2000 counts | High rate bins dominated by noise | Noise dominated (total time) | Noise dominated (detector-on time) | Marked lightcurve |
|---|---|---|---|---|---|---|---|
| A | 13057 | 12672 | 0 | 0 | 0.00% | 0.00% |  |
| B | 13057 | 12673 | 77 | 77 | 0.59% | 0.61% |  |
| C | 13057 | 12674 | 290 | 290 | 2.22% | 2.29% |  |
| D | 13057 | 12674 | 75 | 75 | 0.57% | 0.59% |  |
Top three noisy pixels from each quadrant. If the there are fewer than three noisy pixels in the level2.evt file, extra rows are filled as -1
| Pixel properties | Quadrant properties | ||||||
|---|---|---|---|---|---|---|---|
| Quadrant | DetID | PixID | Counts | Sigma | Mean | Median | Sigma |
| A | 8 | 15 | 33955 | 107.94 | 1477 | 1442 | 301.2 |
| A | 0 | 226 | 13154 | 38.88 | 1477 | 1442 | 301.2 |
| A | 12 | 194 | 11137 | 32.19 | 1477 | 1442 | 301.2 |
| B | 4 | 239 | 844048 | 2984.45 | 1476 | 1440 | 282.3 |
| B | 11 | 51 | 294968 | 1039.65 | 1476 | 1440 | 282.3 |
| B | 3 | 64 | 94437 | 329.39 | 1476 | 1440 | 282.3 |
| C | 15 | 208 | 1190337 | 3599.98 | 1427 | 1433 | 330.3 |
| C | 8 | 128 | 14214 | 38.7 | 1427 | 1433 | 330.3 |
| C | 13 | 61 | 10368 | 27.06 | 1427 | 1433 | 330.3 |
| D | 10 | 157 | 251948 | 727.66 | 1429 | 1385 | 344.3 |
| D | 10 | 199 | 199199 | 574.47 | 1429 | 1385 | 344.3 |
| D | 13 | 249 | 188410 | 543.14 | 1429 | 1385 | 344.3 |
Histogram calculated using DETX and DETY for each event in the final _common_clean file
| Quadrant A | 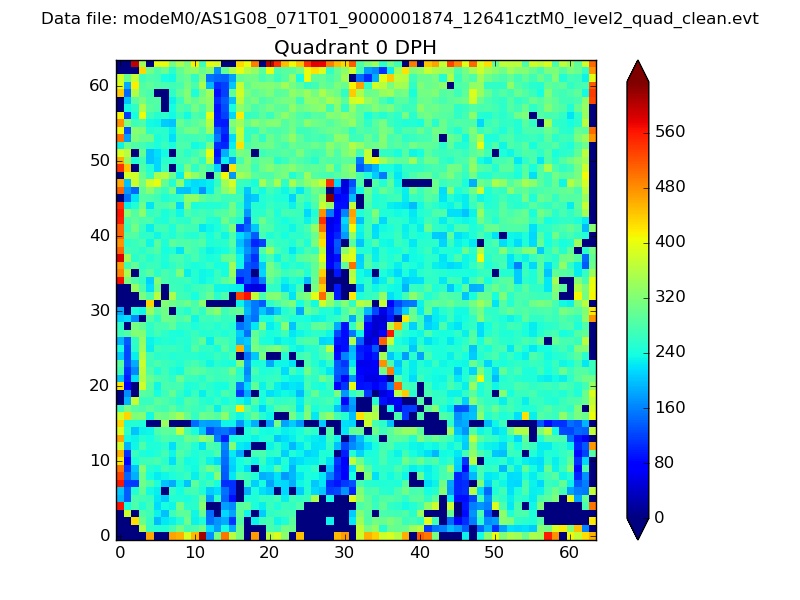 |
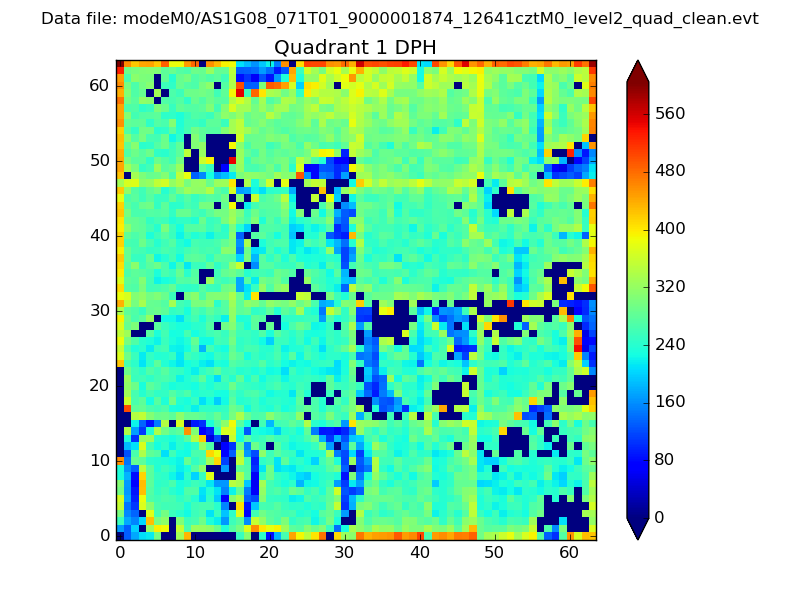 |
Quadrant B |
|---|---|---|---|
| Quadrant D | 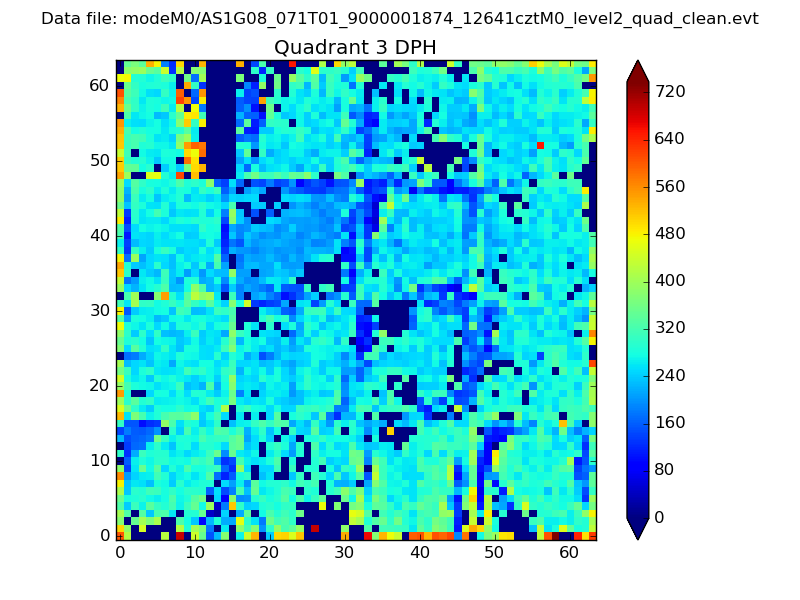 |
 |
Quadrant C |
| Plot type | Count rate plots | Images |
|---|---|---|
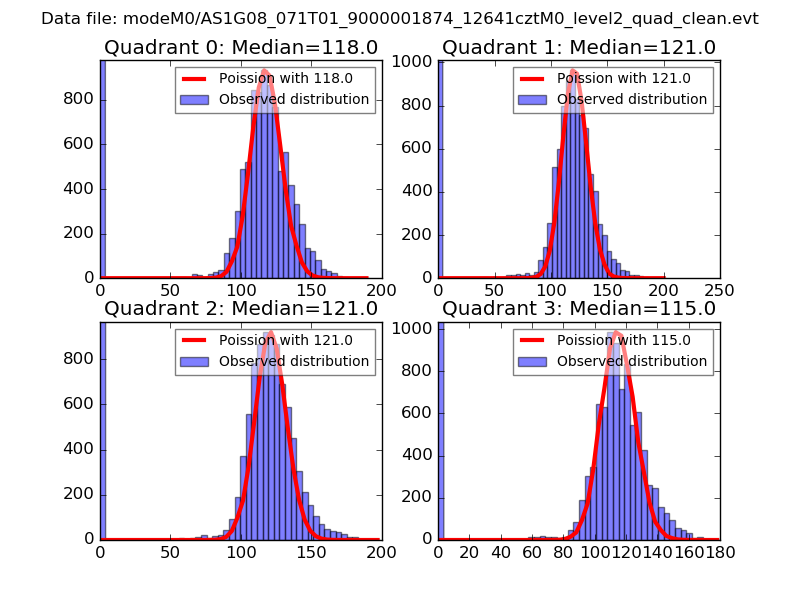
| Comparison with Poisson distribution Blue bars denote a histogram of data divided into 1 sec bins. Red curve is a Poisson curve with rate = median count rate of data. |
 |
 |
| Quadrant-wise count rates Data is divided into 100 sec bins |
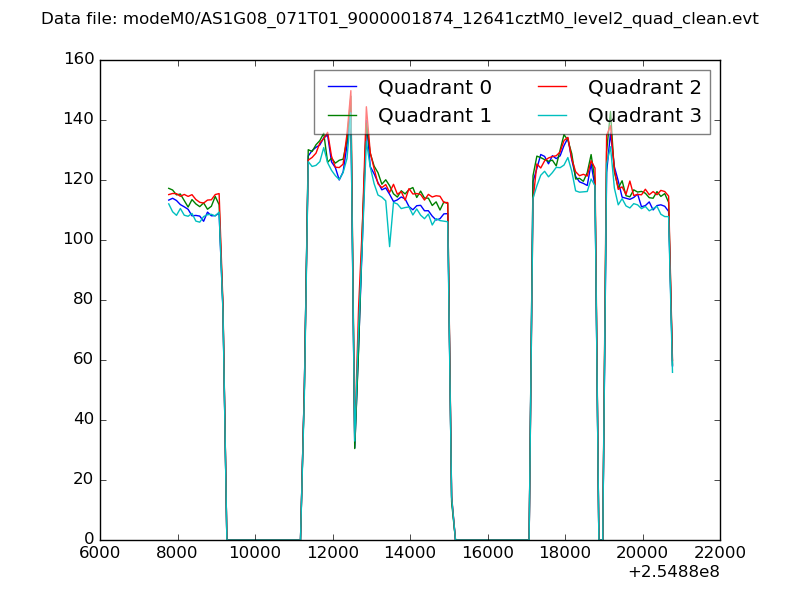 |
|
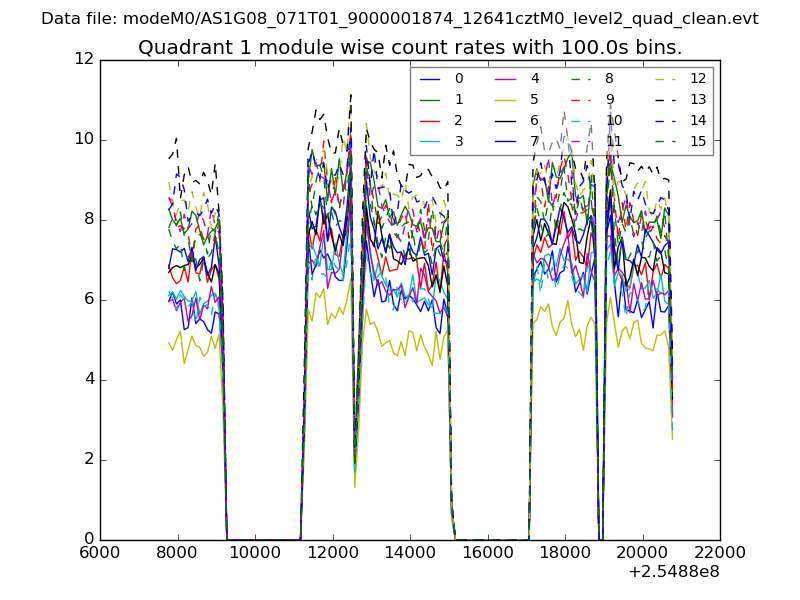
| Module-wise count rates for Quadrant A Data is divided into 100 sec bins |
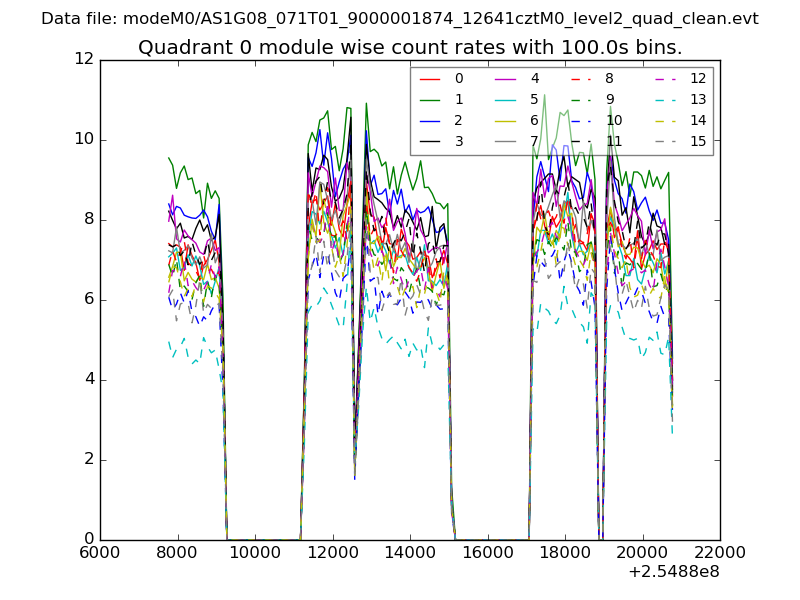 |
 |
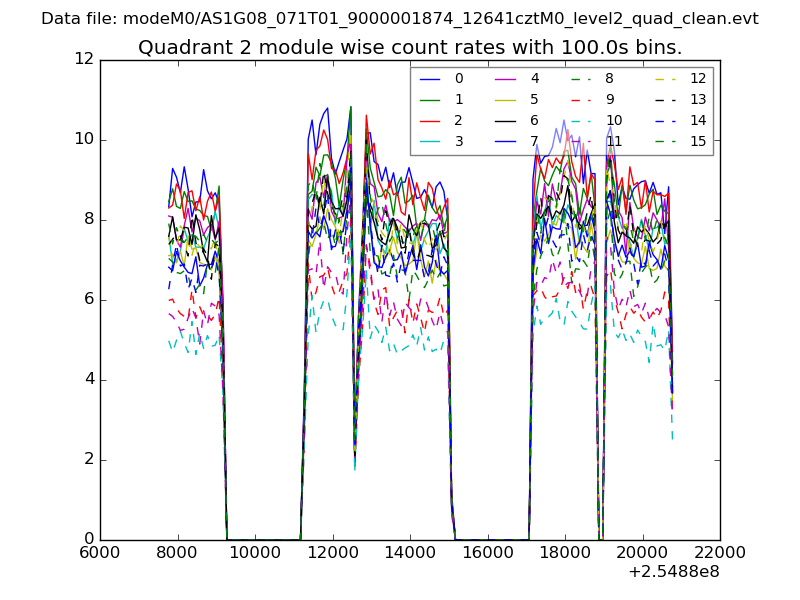
| Module-wise count rates for Quadrant B Data is divided into 100 sec bins |
 |
 |
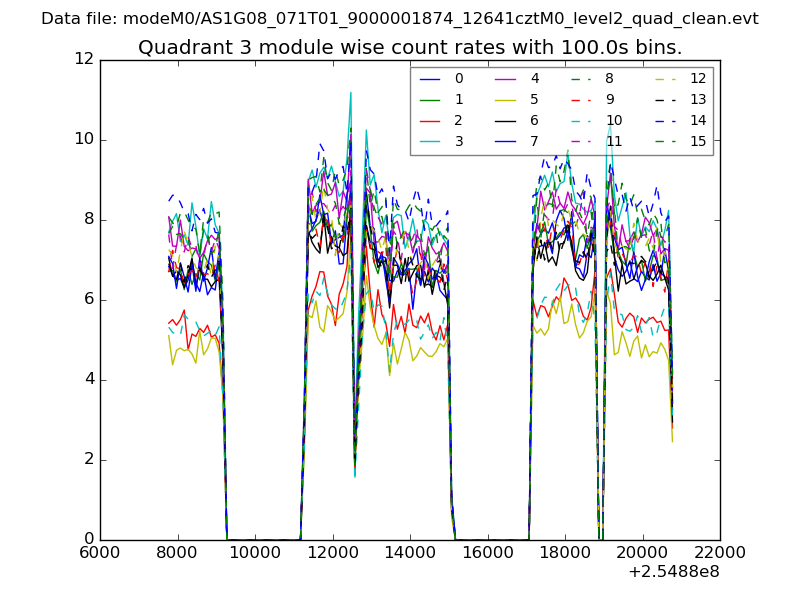
| Module-wise count rates for Quadrant C Data is divided into 100 sec bins |
 |
 |
| Module-wise count rates for Quadrant D Data is divided into 100 sec bins |
 |
 |
| Parameter | Plot |
|---|---|
| CZT HV Monitor | 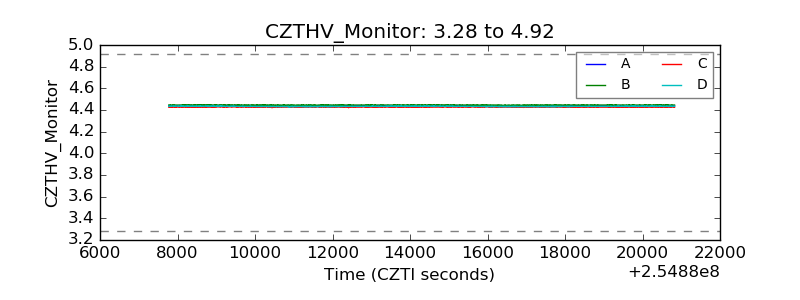 |
| D_VDD | 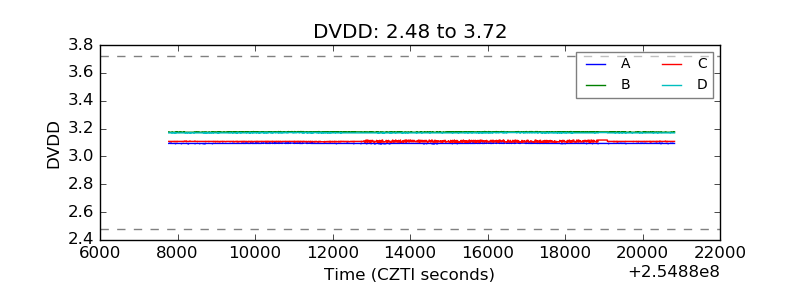 |
| Temperature 1 | 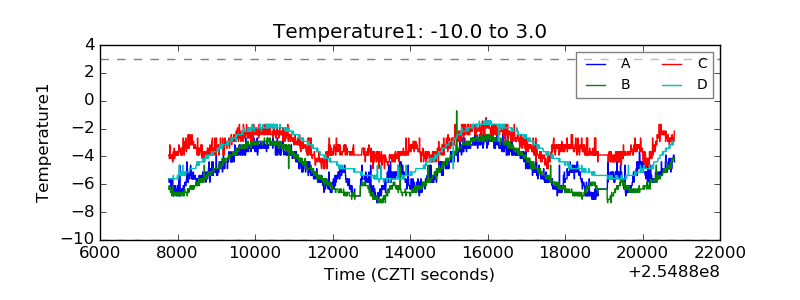 |
| Veto HV Monitor | 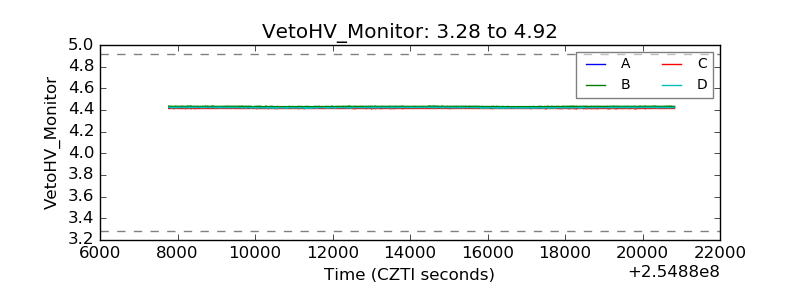 |
| Veto LLD | 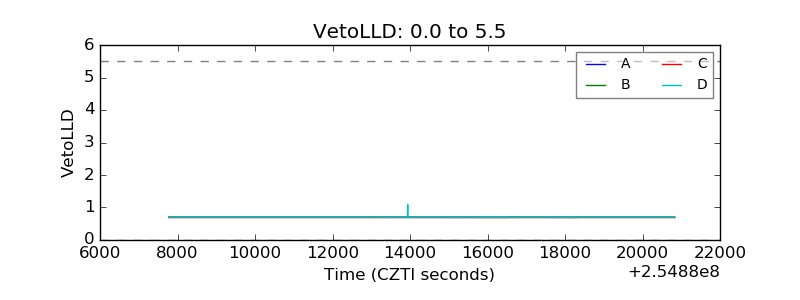 |
| Alpha Counter | 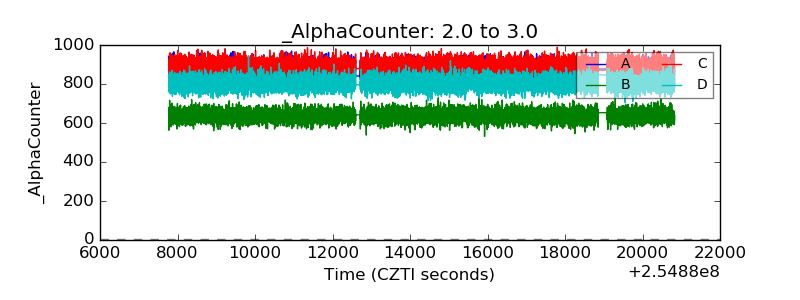 |
| _CPM_Rate | 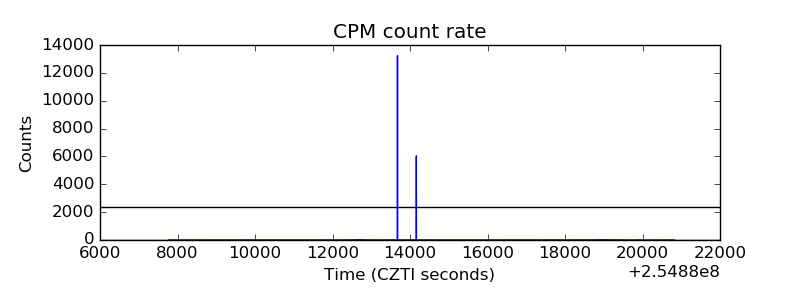 |
| CZT Counter |  |
| +2.5 Volts monitor |  |
| +5 Volts monitor |  |
| _ROLL_ROT | 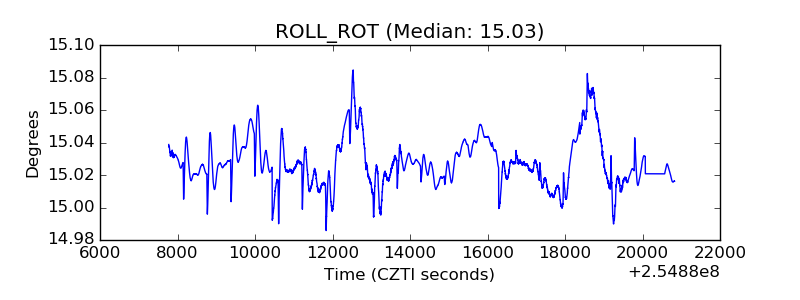 |
| _Roll_DEC | 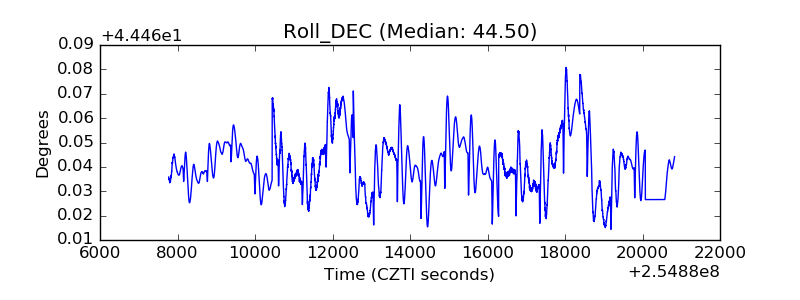 |
| _Roll_RA | 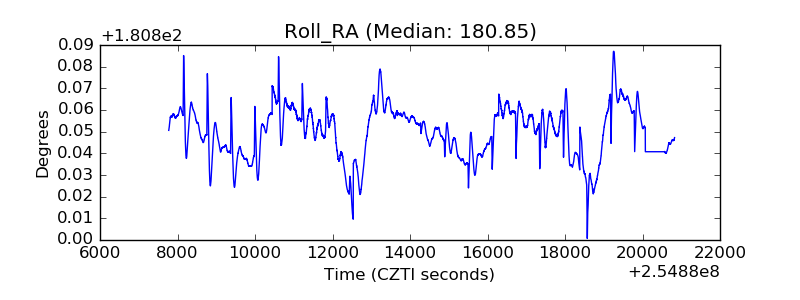 |
| Veto Counter | 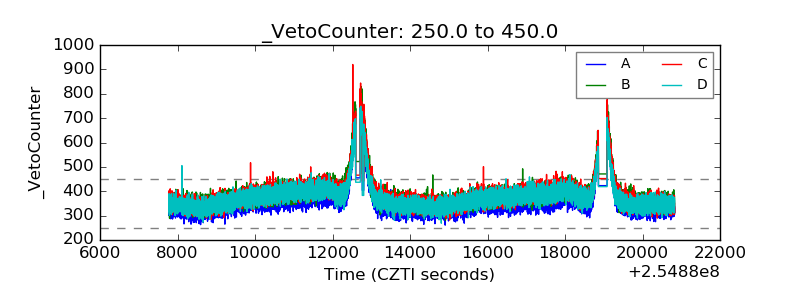 |