| Param | Original file | Final file |
|---|---|---|
| Filename | modeM0/AS1G08_071T01_9000001874_12644cztM0_level2.evt | modeM0/AS1G08_071T01_9000001874_12644cztM0_level2_quad_clean.evt |
| Size (bytes) | 1,311,215,040 | 214,925,760 |
| Size | 1.2 GB | 205.0 MB |
| Events in quadrant A | 8,375,290 | 1,320,410 |
| Events in quadrant B | 11,686,811 | 1,317,556 |
| Events in quadrant C | 8,343,176 | 1,334,300 |
| Events in quadrant D | 10,062,848 | 1,270,750 |
| Mode SS | |||
|---|---|---|---|
| Quadrant | BADHDUFLAG | Total packets | Discarded packets |
| A | 0 | 374 | 0 |
| B | 0 | 374 | 0 |
| C | 0 | 374 | 0 |
| D | 0 | 374 | 0 |
| Mode M0 | |||
|---|---|---|---|
| Quadrant | BADHDUFLAG | Total packets | Discarded packets |
| A | 0 | 37407 | 4 |
| B | 0 | 46559 | 3 |
| C | 0 | 37776 | 3 |
| D | 0 | 42919 | 3 |
| Mode M9 | |||
|---|---|---|---|
| Quadrant | BADHDUFLAG | Total packets | Discarded packets |
| A | 0 | 17 | 0 |
| B | 0 | 17 | 0 |
| C | 0 | 17 | 0 |
| D | 0 | 17 | 0 |
| Quadrant | Total seconds | Saturated seconds | Saturation percentage |
|---|---|---|---|
| A | 18371 | 210 | 1.143106% |
| B | 18371 | 986 | 5.367155% |
| C | 18371 | 167 | 0.909041% |
| D | 18371 | 382 | 2.079364% |
Noise dominated data is calculated using 1-second bins in cleaned event files. If a bin has >2000 counts, and if more than 50% of those come from <1% of pixels, then it is considered to be noise-dominated and hence unusable.
| Quadrant | # 1 sec bins | Bins with >0 counts | Bins with >2000 counts | High rate bins dominated by noise | Noise dominated (total time) | Noise dominated (detector-on time) | Marked lightcurve |
|---|---|---|---|---|---|---|---|
| A | 20102 | 18372 | 0 | 0 | 0.00% | 0.00% | 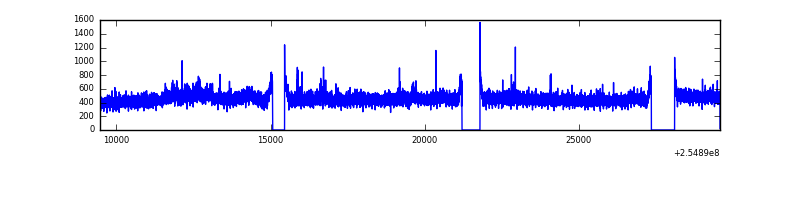 |
| B | 20102 | 18372 | 591 | 591 | 2.94% | 3.22% | 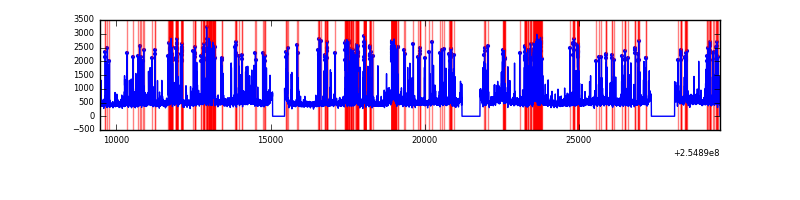 |
| C | 20102 | 18372 | 34 | 34 | 0.17% | 0.19% | 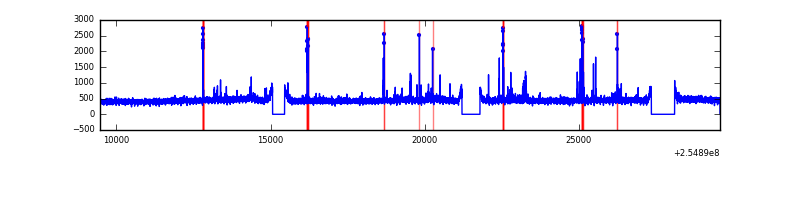 |
| D | 20102 | 18372 | 226 | 226 | 1.12% | 1.23% | 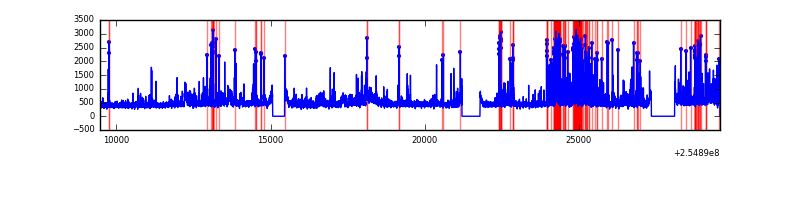 |
Top three noisy pixels from each quadrant. If the there are fewer than three noisy pixels in the level2.evt file, extra rows are filled as -1
| Pixel properties | Quadrant properties | ||||||
|---|---|---|---|---|---|---|---|
| Quadrant | DetID | PixID | Counts | Sigma | Mean | Median | Sigma |
| A | 8 | 15 | 156369 | 355.8 | 2127 | 2077 | 433.6 |
| A | 12 | 189 | 38026 | 82.9 | 2127 | 2077 | 433.6 |
| A | 0 | 226 | 19172 | 39.42 | 2127 | 2077 | 433.6 |
| B | 4 | 239 | 2706529 | 6768.72 | 2094 | 2041 | 399.6 |
| B | 3 | 64 | 355772 | 885.31 | 2094 | 2041 | 399.6 |
| B | 11 | 51 | 254960 | 633.0 | 2094 | 2041 | 399.6 |
| C | 15 | 208 | 207772 | 430.01 | 2068 | 2076 | 478.4 |
| C | 14 | 234 | 45182 | 90.11 | 2068 | 2076 | 478.4 |
| C | 7 | 239 | 15942 | 28.99 | 2068 | 2076 | 478.4 |
| D | 1 | 52 | 1234151 | 2488.65 | 2053 | 1992 | 495.1 |
| D | 10 | 157 | 678227 | 1365.82 | 2053 | 1992 | 495.1 |
| D | 13 | 249 | 119135 | 236.6 | 2053 | 1992 | 495.1 |
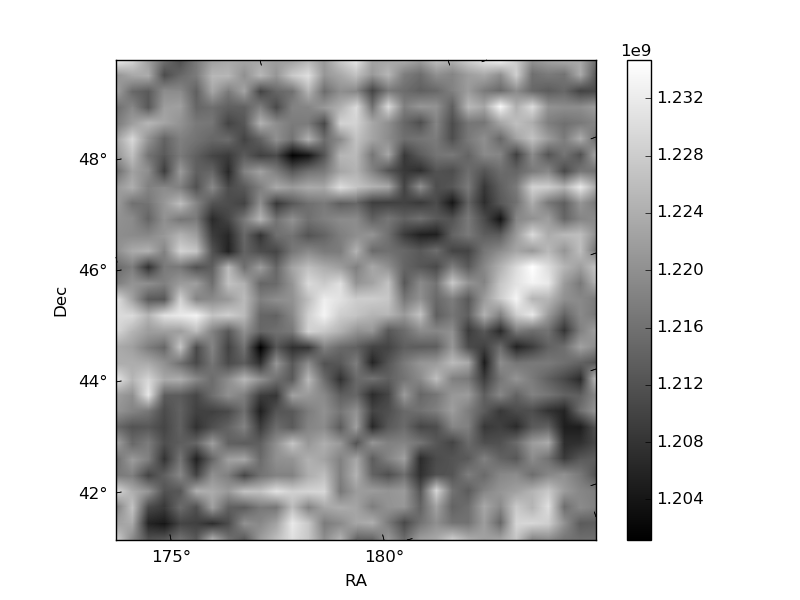
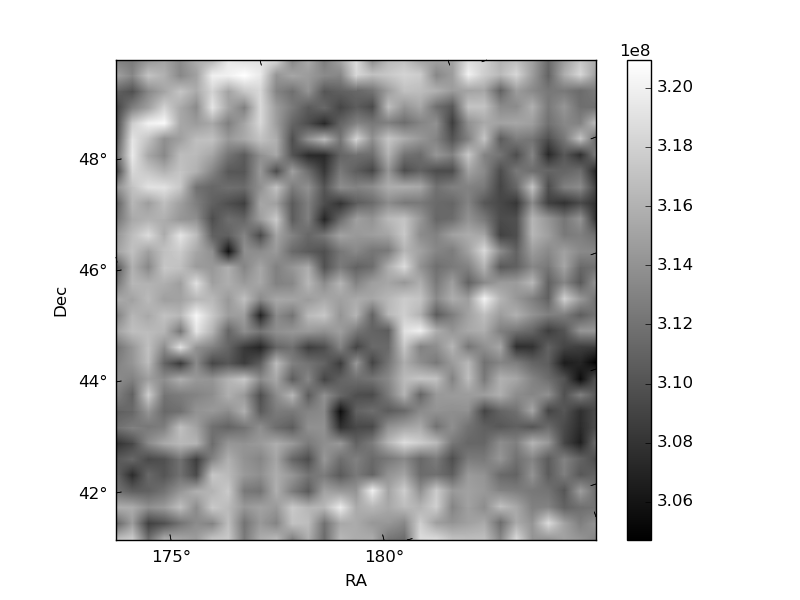
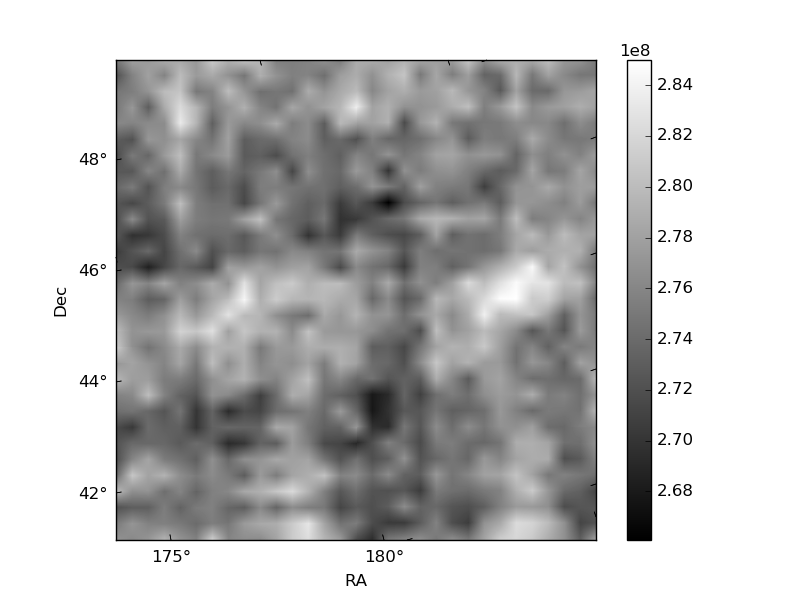
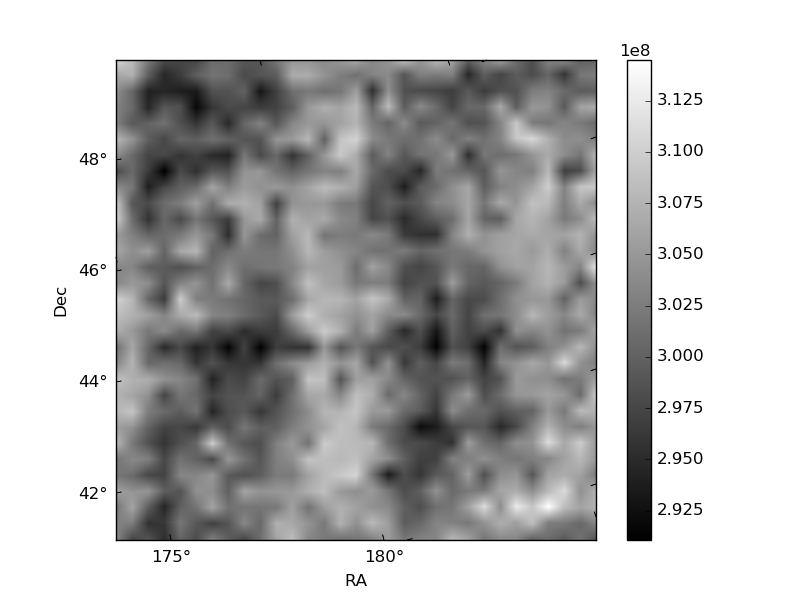
Histogram calculated using DETX and DETY for each event in the final _common_clean file
| Quadrant A | 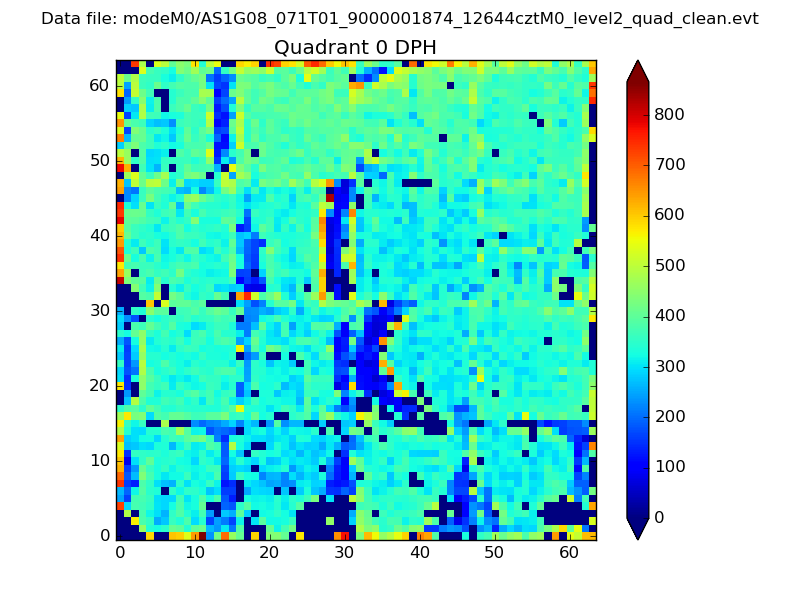 |
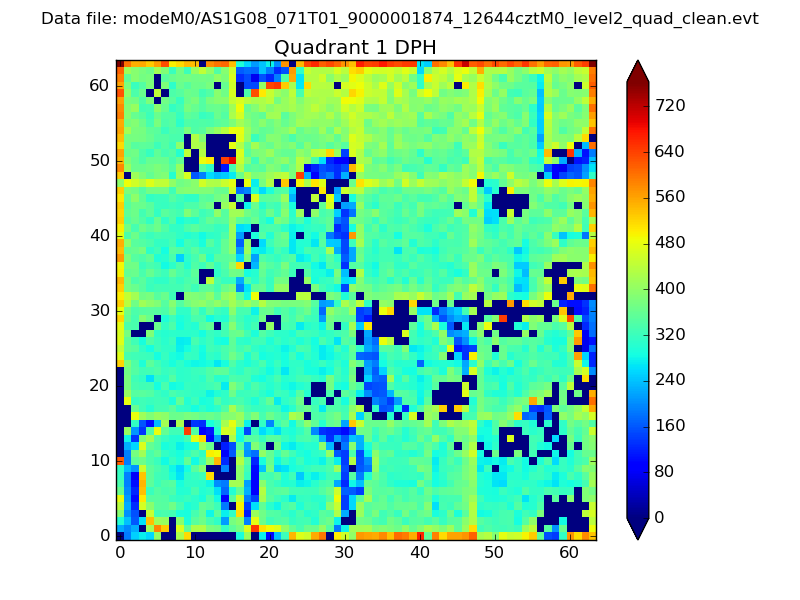 |
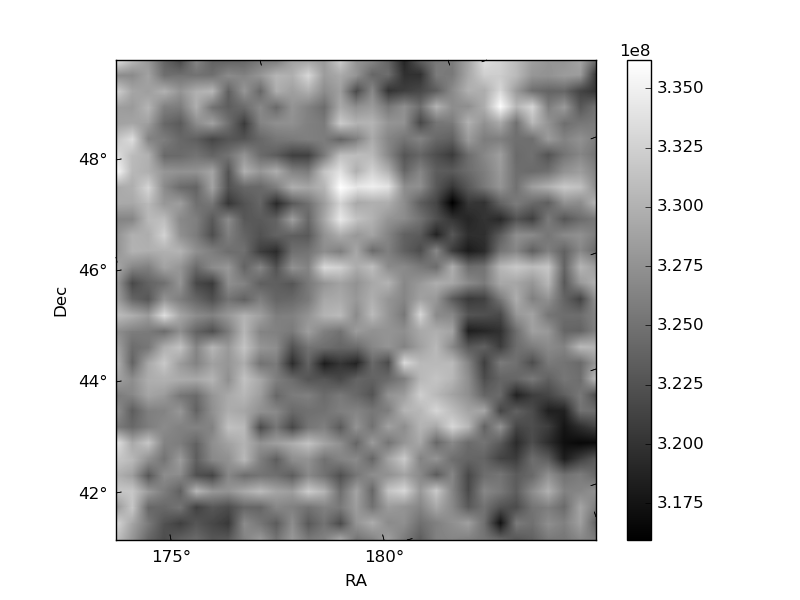
Quadrant B |
|---|---|---|---|
| Quadrant D | 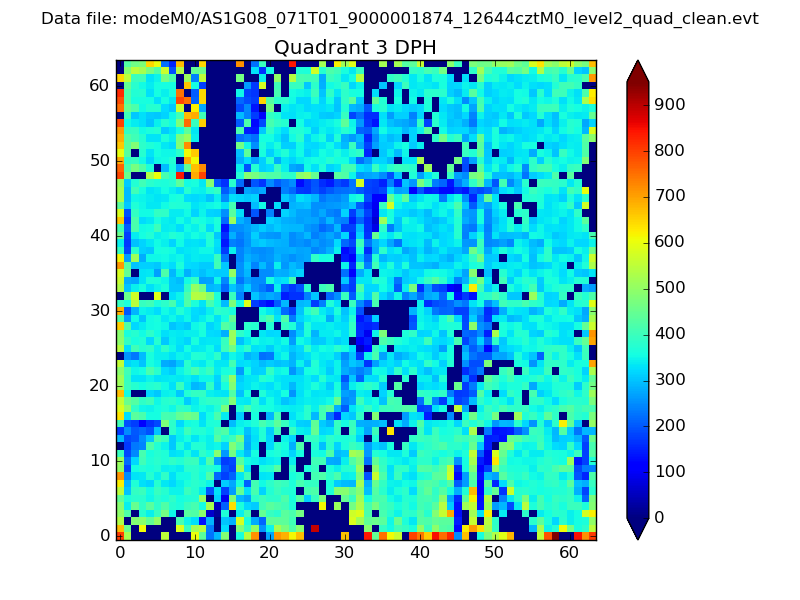 |
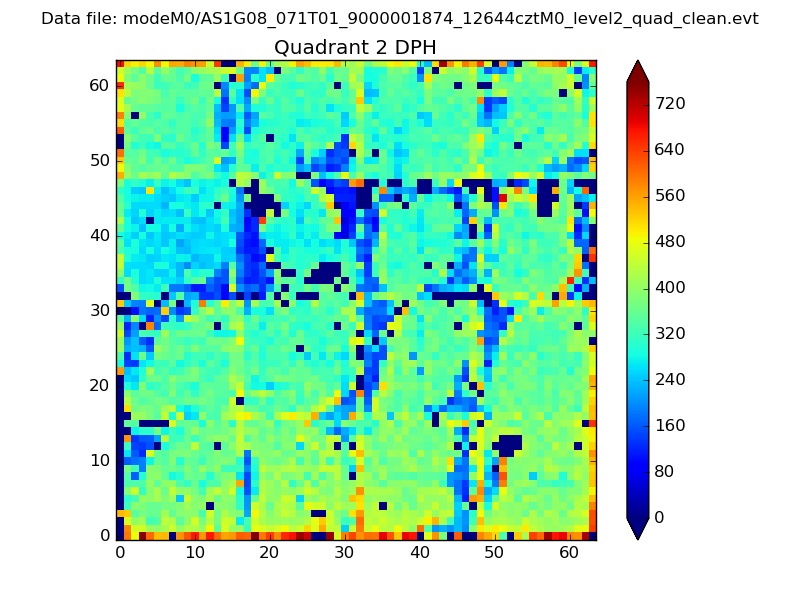 |
Quadrant C |
| Plot type | Count rate plots | Images |
|---|---|---|
| Comparison with Poisson distribution Blue bars denote a histogram of data divided into 1 sec bins. Red curve is a Poisson curve with rate = median count rate of data. |
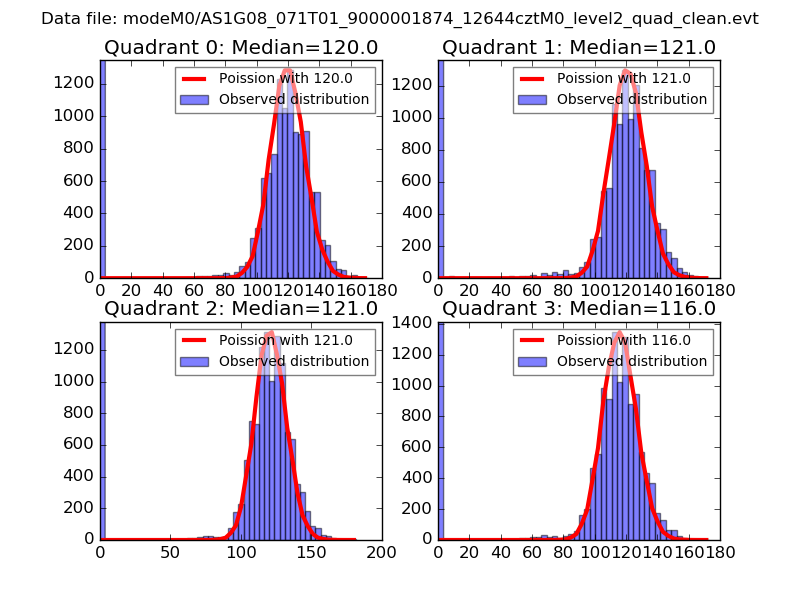 |
 |
| Quadrant-wise count rates Data is divided into 100 sec bins |
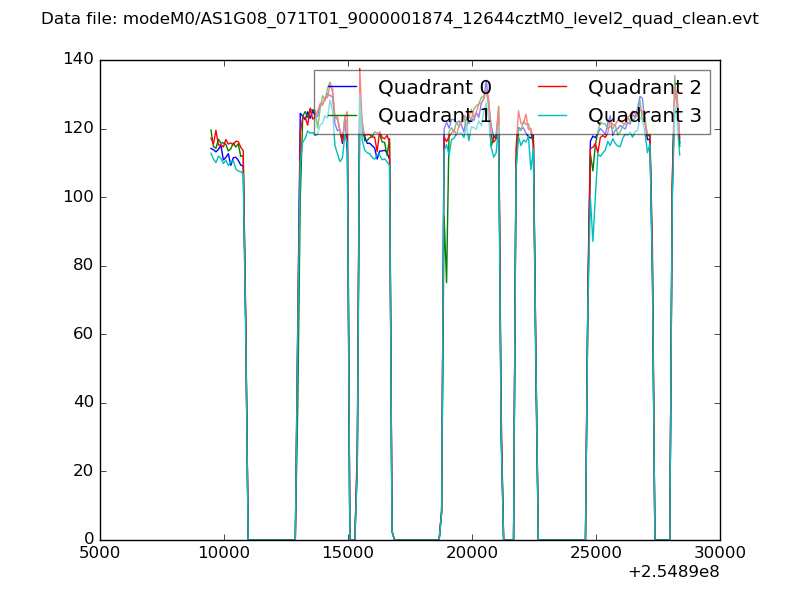 |
|
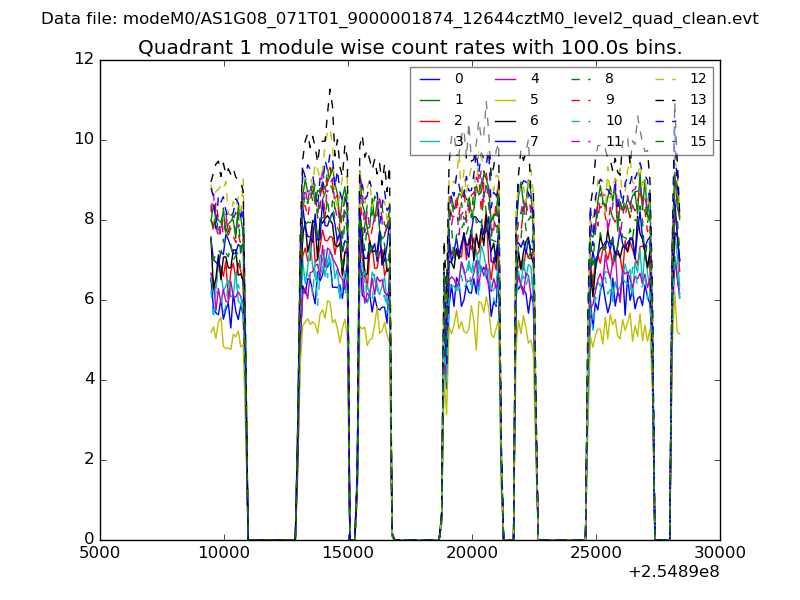
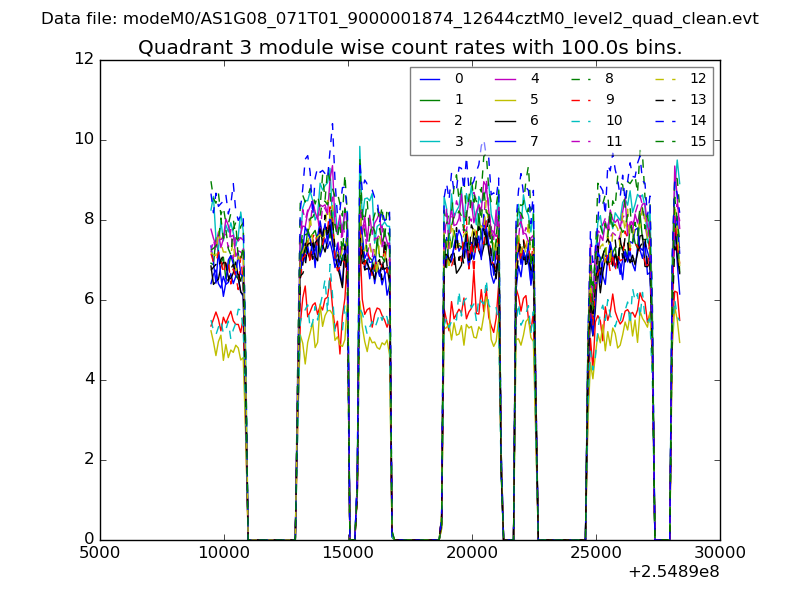
| Module-wise count rates for Quadrant A Data is divided into 100 sec bins |
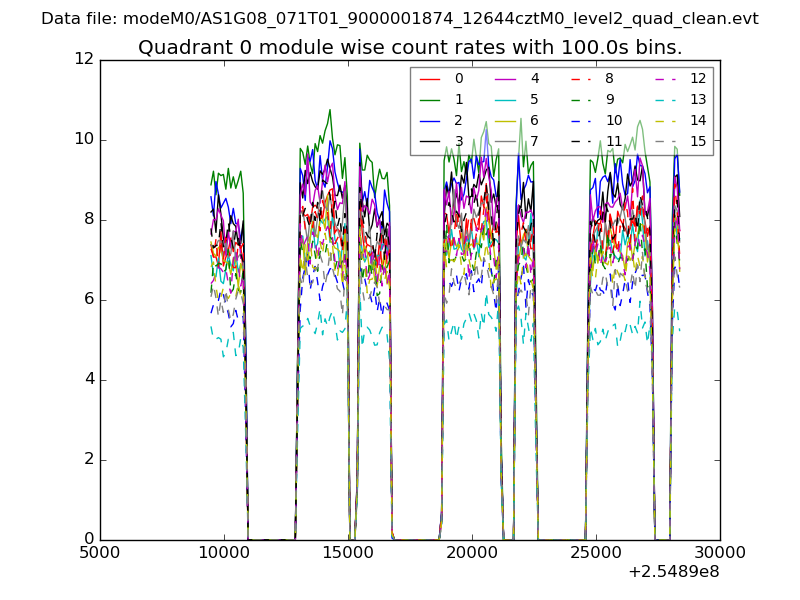 |
 |
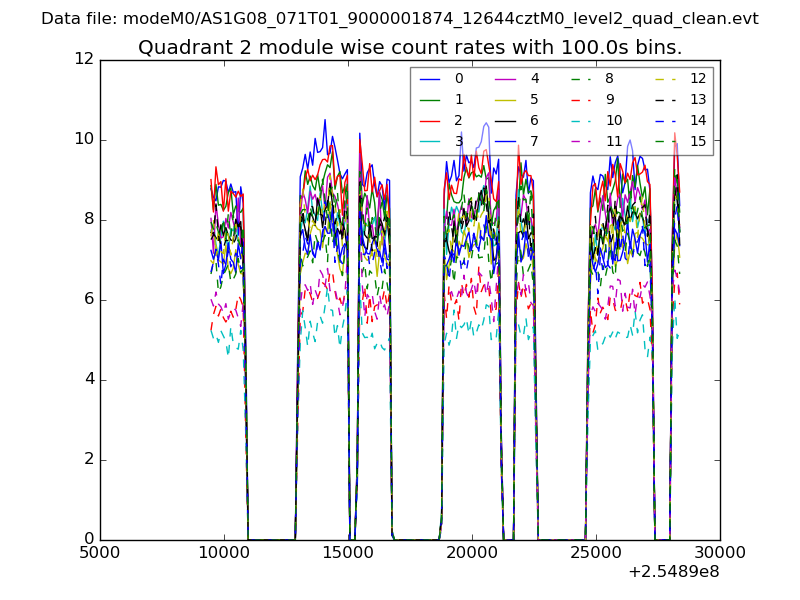
| Module-wise count rates for Quadrant B Data is divided into 100 sec bins |
 |
 |
| Module-wise count rates for Quadrant C Data is divided into 100 sec bins |
 |
 |
| Module-wise count rates for Quadrant D Data is divided into 100 sec bins |
 |
 |
| Parameter | Plot |
|---|---|
| CZT HV Monitor | 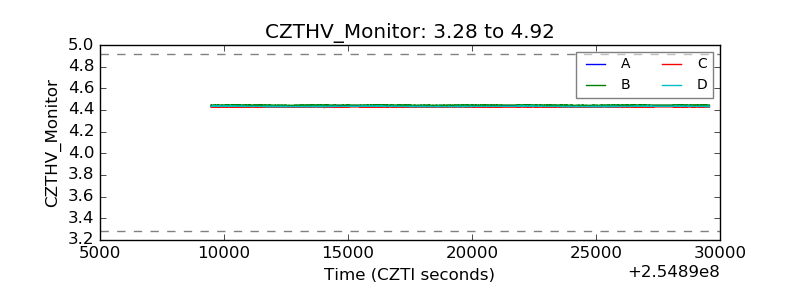 |
| D_VDD | 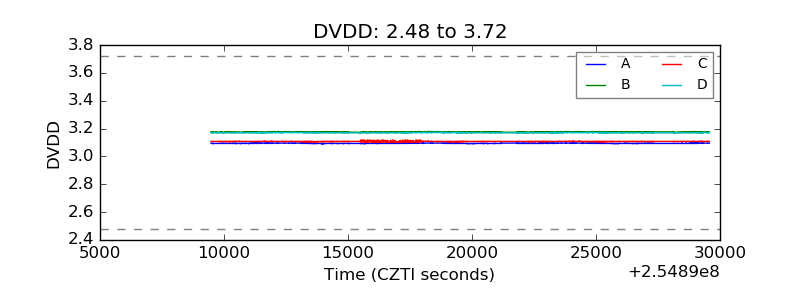 |
| Temperature 1 | 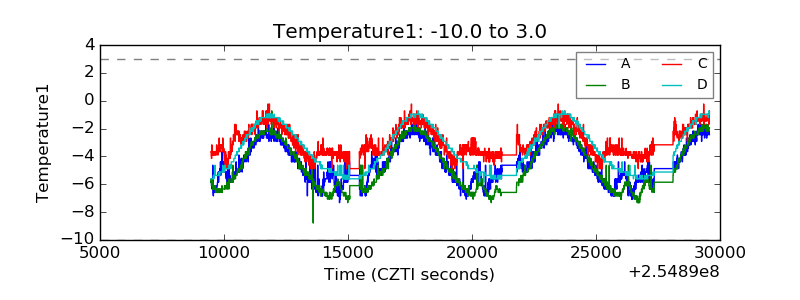 |
| Veto HV Monitor | 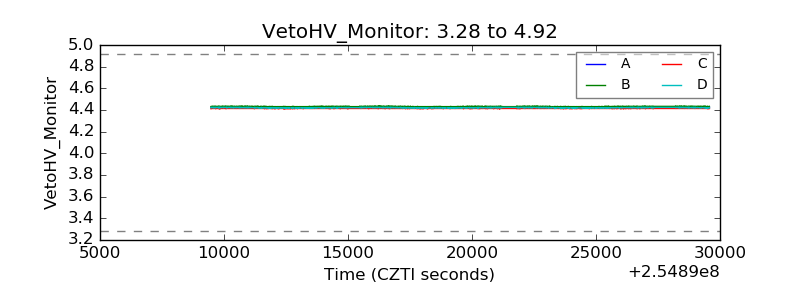 |
| Veto LLD | 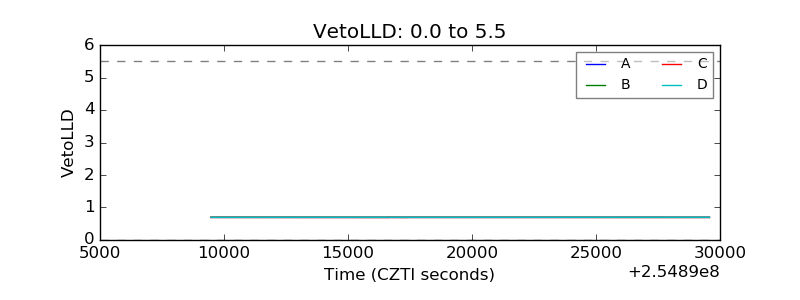 |
| Alpha Counter | 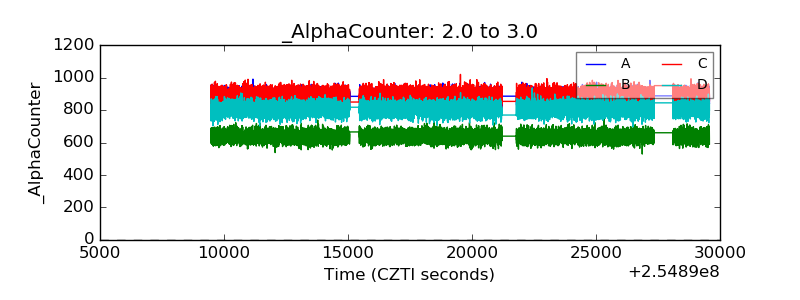 |
| _CPM_Rate | 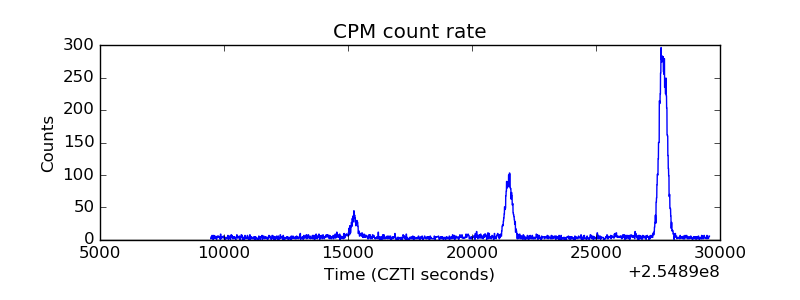 |
| CZT Counter | 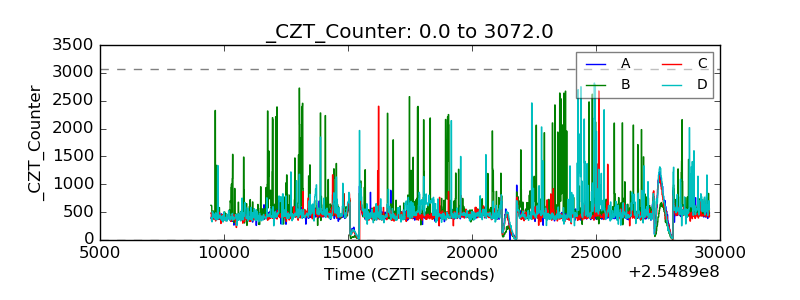 |
| +2.5 Volts monitor |  |
| +5 Volts monitor |  |
| _ROLL_ROT | 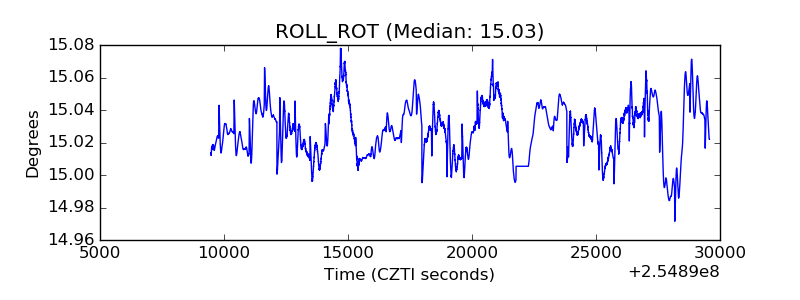 |
| _Roll_DEC | 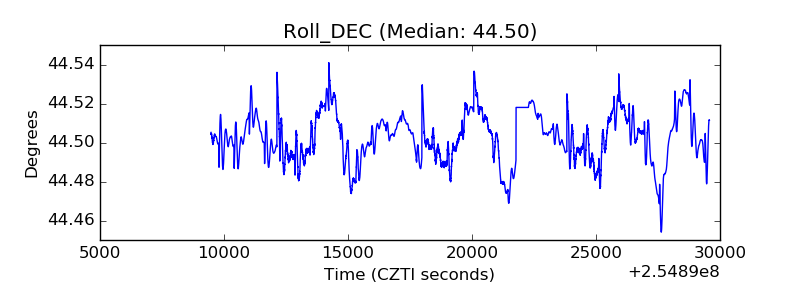 |
| _Roll_RA | 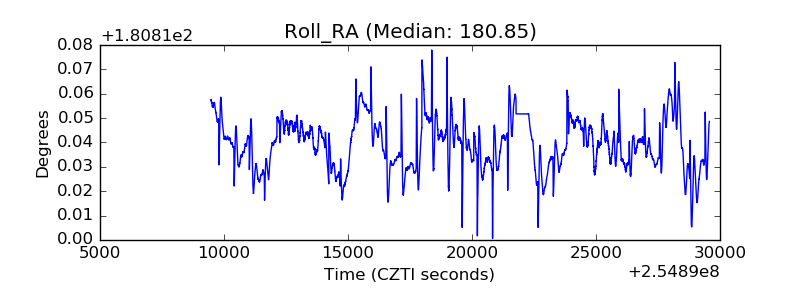 |
| Veto Counter | 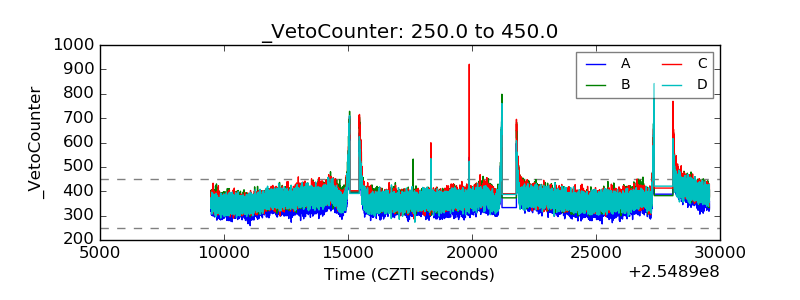 |