| Param | Original file | Final file |
|---|---|---|
| Filename | modeM0/AS1G08_071T01_9000001874_12645cztM0_level2.evt | modeM0/AS1G08_071T01_9000001874_12645cztM0_level2_quad_clean.evt |
| Size (bytes) | 555,220,800 | 66,945,600 |
| Size | 529.5 MB | 63.8 MB |
| Events in quadrant A | 3,126,388 | 396,970 |
| Events in quadrant B | 4,435,993 | 394,733 |
| Events in quadrant C | 3,146,599 | 399,360 |
| Events in quadrant D | 5,649,425 | 366,475 |
| Mode SS | |||
|---|---|---|---|
| Quadrant | BADHDUFLAG | Total packets | Discarded packets |
| A | 0 | 136 | 0 |
| B | 0 | 136 | 0 |
| C | 0 | 136 | 0 |
| D | 0 | 136 | 0 |
| Mode M0 | |||
|---|---|---|---|
| Quadrant | BADHDUFLAG | Total packets | Discarded packets |
| A | 0 | 13754 | 3 |
| B | 0 | 17539 | 2 |
| C | 0 | 13894 | 2 |
| D | 0 | 21520 | 2 |
| Mode M9 | |||
|---|---|---|---|
| Quadrant | BADHDUFLAG | Total packets | Discarded packets |
| A | 0 | 12 | 0 |
| B | 0 | 12 | 0 |
| C | 0 | 12 | 0 |
| D | 0 | 13 | 0 |
| Quadrant | Total seconds | Saturated seconds | Saturation percentage |
|---|---|---|---|
| A | 6734 | 58 | 0.861301% |
| B | 6734 | 343 | 5.093555% |
| C | 6734 | 44 | 0.653401% |
| D | 6734 | 612 | 9.088209% |
Noise dominated data is calculated using 1-second bins in cleaned event files. If a bin has >2000 counts, and if more than 50% of those come from <1% of pixels, then it is considered to be noise-dominated and hence unusable.
| Quadrant | # 1 sec bins | Bins with >0 counts | Bins with >2000 counts | High rate bins dominated by noise | Noise dominated (total time) | Noise dominated (detector-on time) | Marked lightcurve |
|---|---|---|---|---|---|---|---|
| A | 7655 | 6735 | 0 | 0 | 0.00% | 0.00% | 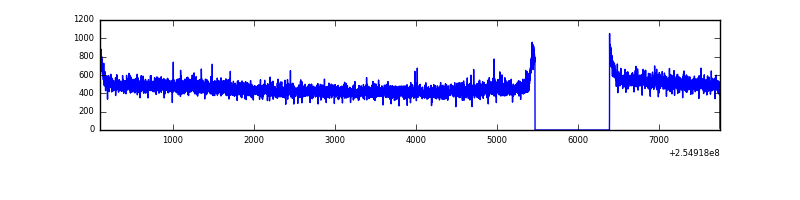 |
| B | 7655 | 6735 | 195 | 195 | 2.55% | 2.90% | 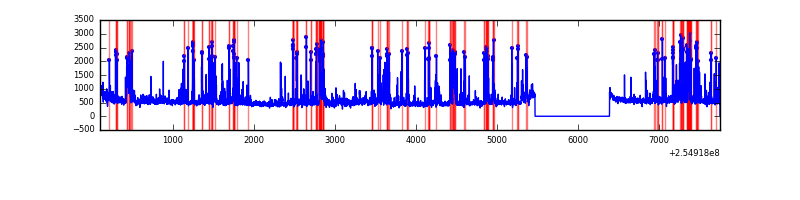 |
| C | 7655 | 6735 | 1 | 1 | 0.01% | 0.01% | 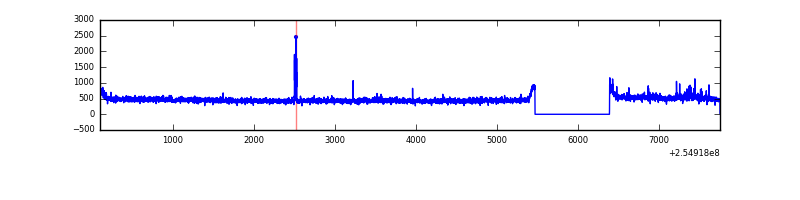 |
| D | 7655 | 6735 | 535 | 535 | 6.99% | 7.94% | 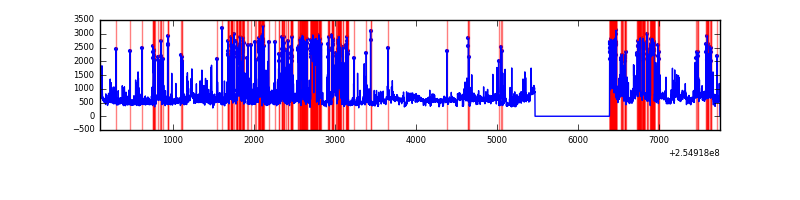 |
Top three noisy pixels from each quadrant. If the there are fewer than three noisy pixels in the level2.evt file, extra rows are filled as -1
| Pixel properties | Quadrant properties | ||||||
|---|---|---|---|---|---|---|---|
| Quadrant | DetID | PixID | Counts | Sigma | Mean | Median | Sigma |
| A | 12 | 189 | 9218 | 51.31 | 810 | 792 | 164.2 |
| A | 0 | 226 | 7263 | 39.4 | 810 | 792 | 164.2 |
| A | 12 | 194 | 6354 | 33.87 | 810 | 792 | 164.2 |
| B | 4 | 239 | 987191 | 6393.14 | 799 | 780 | 154.3 |
| B | 11 | 51 | 133704 | 861.51 | 799 | 780 | 154.3 |
| B | 3 | 64 | 96079 | 617.65 | 799 | 780 | 154.3 |
| C | 15 | 208 | 51271 | 276.15 | 789 | 794 | 182.8 |
| C | 14 | 234 | 17736 | 92.69 | 789 | 794 | 182.8 |
| C | 13 | 61 | 5629 | 26.45 | 789 | 794 | 182.8 |
| D | 1 | 52 | 1584484 | 8770.91 | 748 | 726 | 180.6 |
| D | 10 | 157 | 595215 | 3292.3 | 748 | 726 | 180.6 |
| D | 11 | 176 | 490467 | 2712.21 | 748 | 726 | 180.6 |
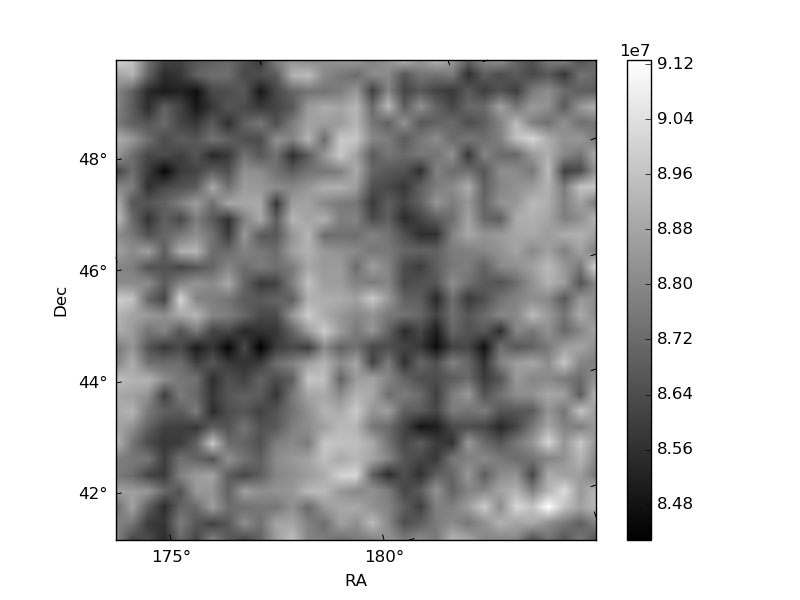
Histogram calculated using DETX and DETY for each event in the final _common_clean file
| Quadrant A |  |
 |
Quadrant B |
|---|---|---|---|
| Quadrant D |  |
 |
Quadrant C |
| Plot type | Count rate plots | Images |
|---|---|---|
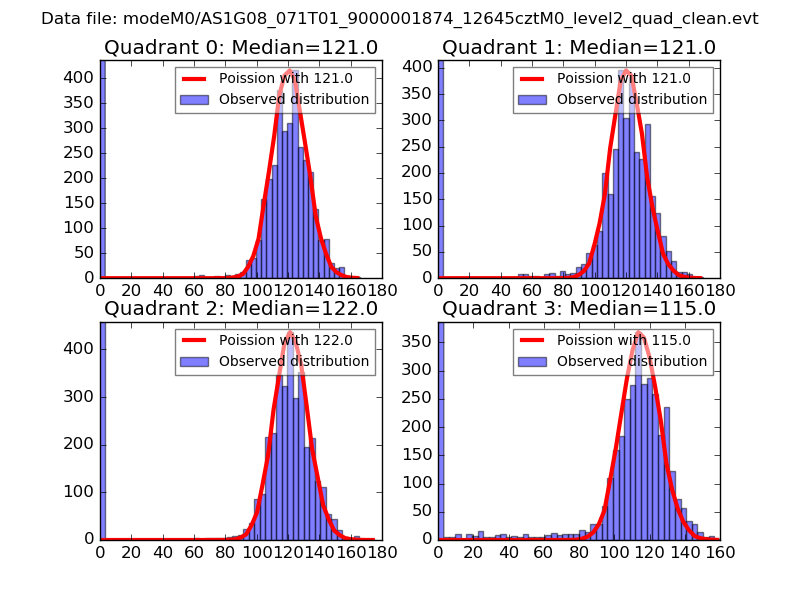
| Comparison with Poisson distribution Blue bars denote a histogram of data divided into 1 sec bins. Red curve is a Poisson curve with rate = median count rate of data. |
 |
 |
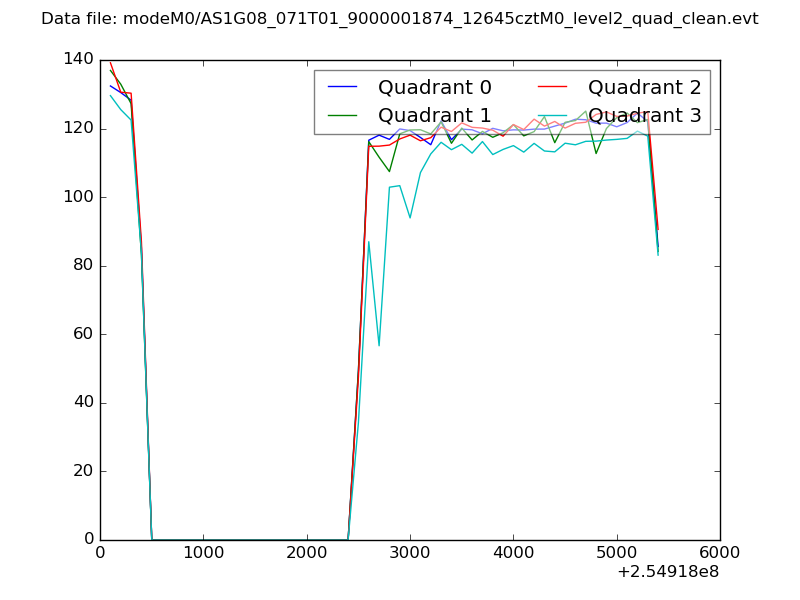
| Quadrant-wise count rates Data is divided into 100 sec bins |
 |
|
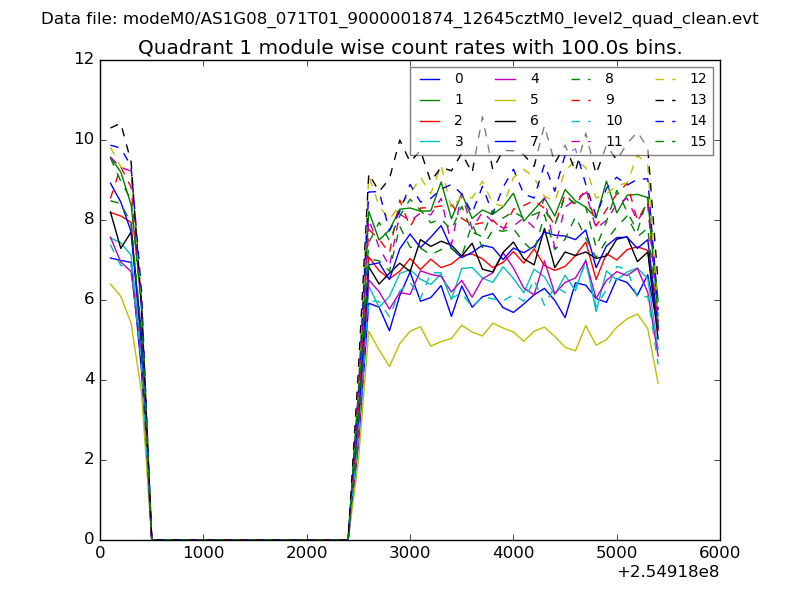
| Module-wise count rates for Quadrant A Data is divided into 100 sec bins |
 |
 |
| Module-wise count rates for Quadrant B Data is divided into 100 sec bins |
 |
 |
| Module-wise count rates for Quadrant C Data is divided into 100 sec bins |
 |
 |
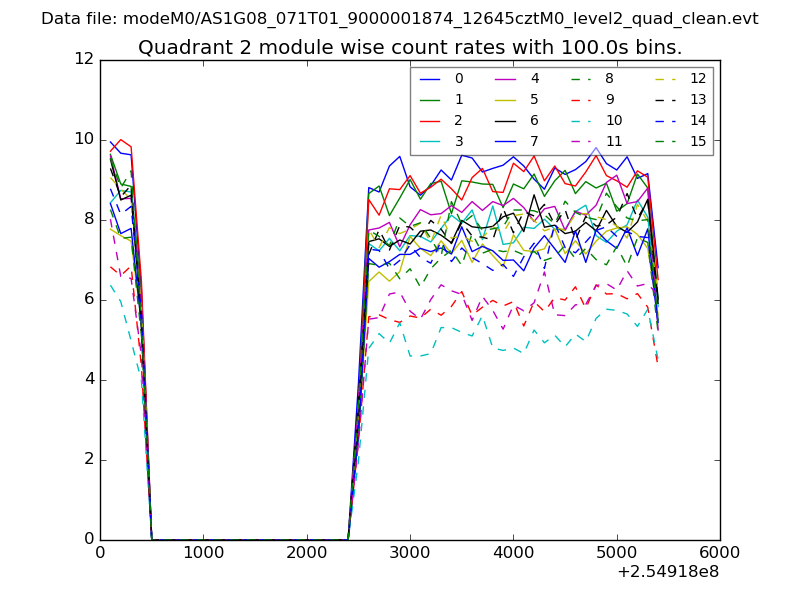
| Module-wise count rates for Quadrant D Data is divided into 100 sec bins |
 |
 |
| Parameter | Plot |
|---|---|
| CZT HV Monitor | 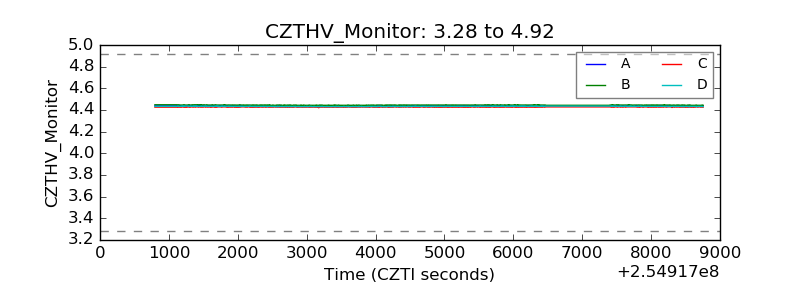 |
| D_VDD |  |
| Temperature 1 |  |
| Veto HV Monitor |  |
| Veto LLD |  |
| Alpha Counter | 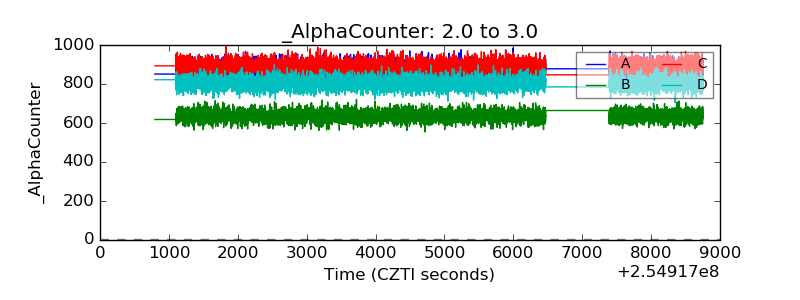 |
| _CPM_Rate | 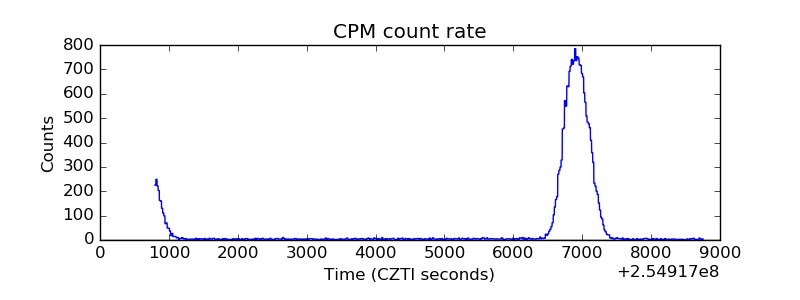 |
| CZT Counter |  |
| +2.5 Volts monitor |  |
| +5 Volts monitor |  |
| _ROLL_ROT |  |
| _Roll_DEC |  |
| _Roll_RA |  |
| Veto Counter |  |