| Param | Original file | Final file |
|---|---|---|
| Filename | modeM0/AS1G08_071T01_9000001874_12647cztM0_level2.evt | modeM0/AS1G08_071T01_9000001874_12647cztM0_level2_quad_clean.evt |
| Size (bytes) | 307,834,560 | 35,268,480 |
| Size | 293.6 MB | 33.6 MB |
| Events in quadrant A | 1,724,541 | 206,820 |
| Events in quadrant B | 2,403,180 | 201,537 |
| Events in quadrant C | 1,790,241 | 204,509 |
| Events in quadrant D | 3,150,504 | 190,995 |
| Mode SS | |||
|---|---|---|---|
| Quadrant | BADHDUFLAG | Total packets | Discarded packets |
| A | 0 | 76 | 0 |
| B | 0 | 76 | 0 |
| C | 0 | 76 | 0 |
| D | 0 | 76 | 0 |
| Mode M0 | |||
|---|---|---|---|
| Quadrant | BADHDUFLAG | Total packets | Discarded packets |
| A | 0 | 7588 | 1 |
| B | 0 | 9548 | 1 |
| C | 0 | 7812 | 1 |
| D | 0 | 11944 | 1 |
| Mode M9 | |||
|---|---|---|---|
| Quadrant | BADHDUFLAG | Total packets | Discarded packets |
| A | 0 | 1 | 0 |
| B | 0 | 1 | 0 |
| C | 0 | 1 | 0 |
| D | 0 | 2 | 0 |
| Quadrant | Total seconds | Saturated seconds | Saturation percentage |
|---|---|---|---|
| A | 3720 | 15 | 0.403226% |
| B | 3720 | 171 | 4.596774% |
| C | 3720 | 10 | 0.268817% |
| D | 3720 | 327 | 8.790323% |
Noise dominated data is calculated using 1-second bins in cleaned event files. If a bin has >2000 counts, and if more than 50% of those come from <1% of pixels, then it is considered to be noise-dominated and hence unusable.
| Quadrant | # 1 sec bins | Bins with >0 counts | Bins with >2000 counts | High rate bins dominated by noise | Noise dominated (total time) | Noise dominated (detector-on time) | Marked lightcurve |
|---|---|---|---|---|---|---|---|
| A | 3722 | 3722 | 0 | 0 | 0.00% | 0.00% |  |
| B | 3722 | 3722 | 113 | 113 | 3.04% | 3.04% | 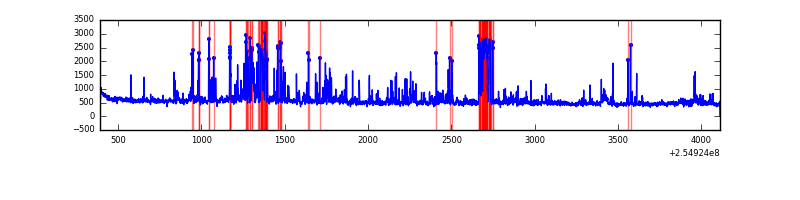 |
| C | 3722 | 3722 | 2 | 2 | 0.05% | 0.05% |  |
| D | 3722 | 3722 | 327 | 327 | 8.79% | 8.79% | 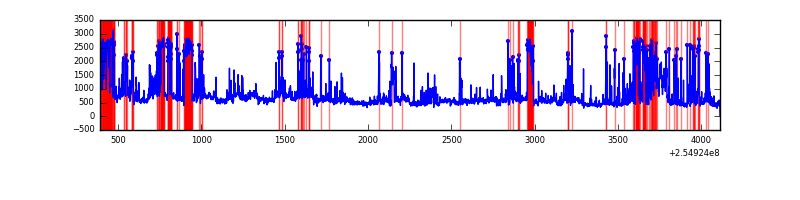 |
Top three noisy pixels from each quadrant. If the there are fewer than three noisy pixels in the level2.evt file, extra rows are filled as -1
| Pixel properties | Quadrant properties | ||||||
|---|---|---|---|---|---|---|---|
| Quadrant | DetID | PixID | Counts | Sigma | Mean | Median | Sigma |
| A | 12 | 189 | 9812 | 102.26 | 445 | 436 | 91.7 |
| A | 0 | 226 | 4034 | 39.24 | 445 | 436 | 91.7 |
| A | 12 | 194 | 3533 | 33.78 | 445 | 436 | 91.7 |
| B | 4 | 239 | 444556 | 5303.42 | 437 | 427 | 83.7 |
| B | 0 | 197 | 99373 | 1181.53 | 437 | 427 | 83.7 |
| B | 11 | 51 | 96155 | 1143.11 | 437 | 427 | 83.7 |
| C | 15 | 208 | 85575 | 839.1 | 435 | 438 | 101.5 |
| C | 14 | 234 | 5682 | 51.68 | 435 | 438 | 101.5 |
| C | 13 | 61 | 3208 | 27.3 | 435 | 438 | 101.5 |
| D | 1 | 52 | 1291203 | 12824.81 | 410 | 398 | 100.6 |
| D | 10 | 157 | 243071 | 2411.08 | 410 | 398 | 100.6 |
| D | 13 | 104 | 26830 | 262.62 | 410 | 398 | 100.6 |
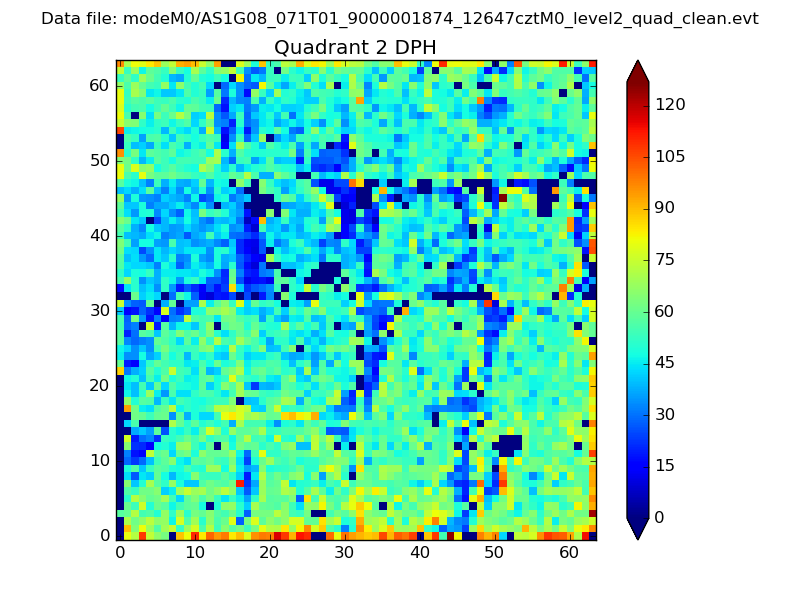
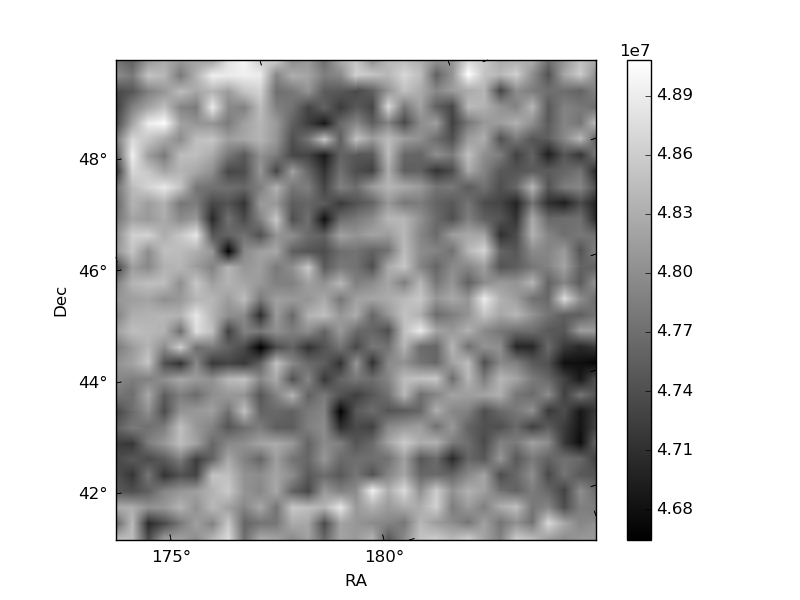
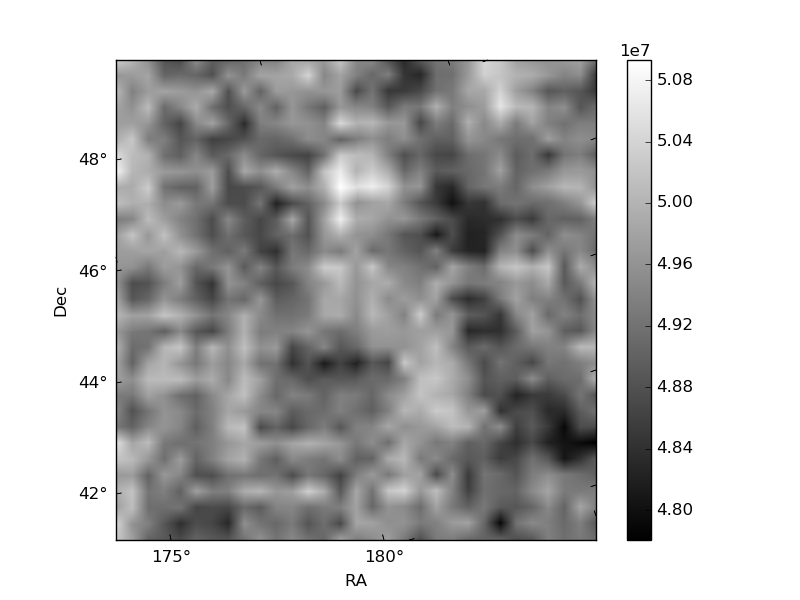
Histogram calculated using DETX and DETY for each event in the final _common_clean file
| Quadrant A | 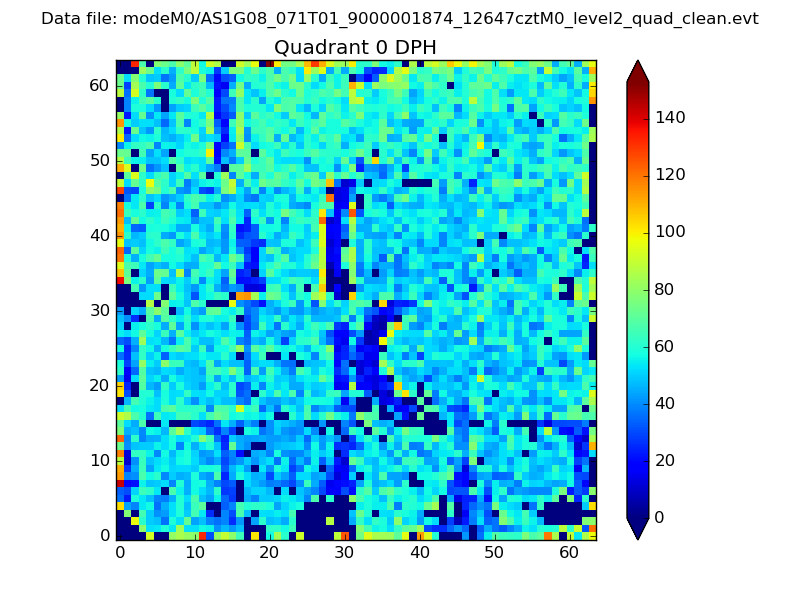 |
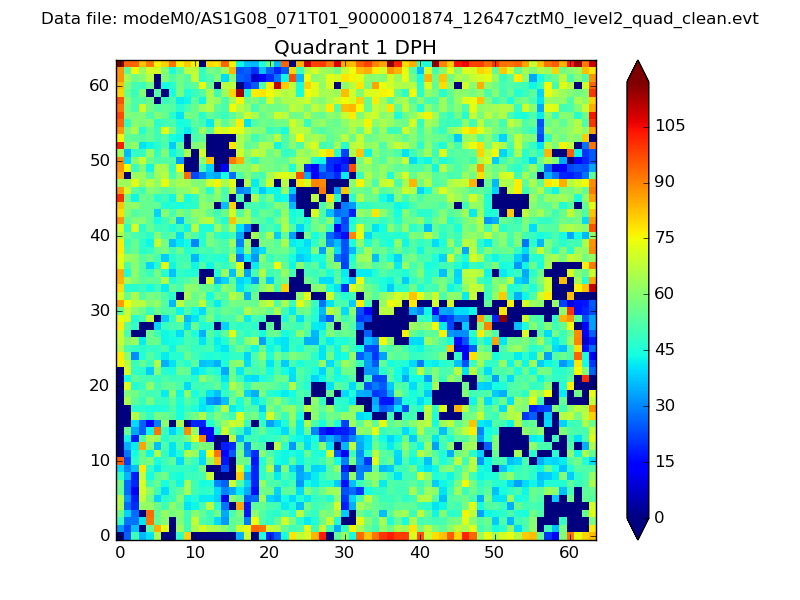 |
Quadrant B |
|---|---|---|---|
| Quadrant D | 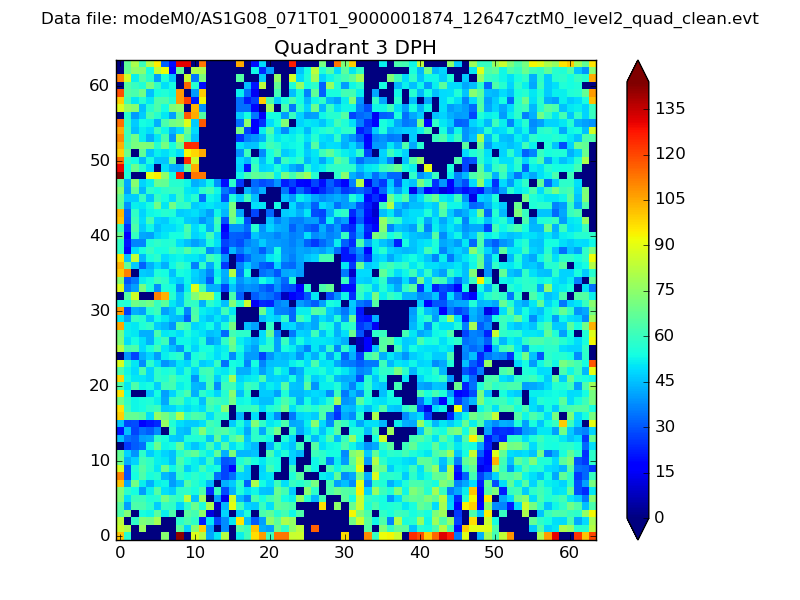 |
 |
Quadrant C |
| Plot type | Count rate plots | Images |
|---|---|---|
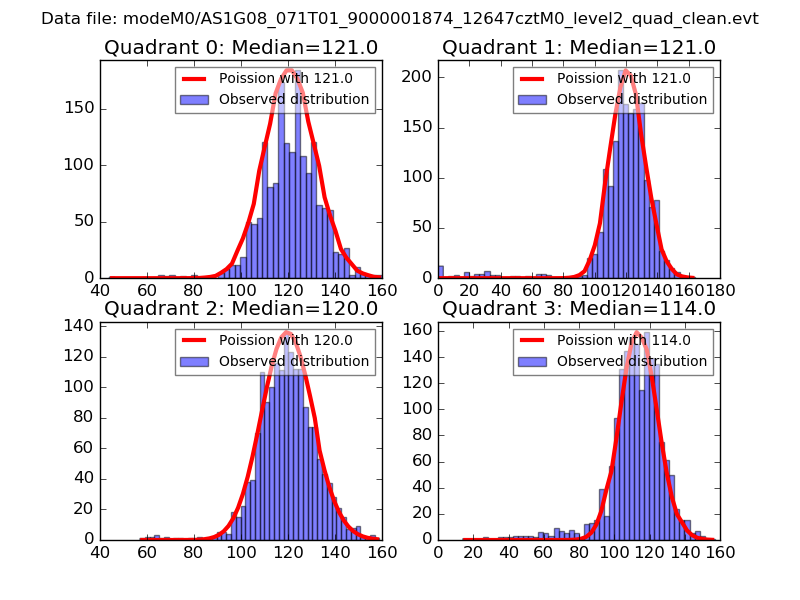
| Comparison with Poisson distribution Blue bars denote a histogram of data divided into 1 sec bins. Red curve is a Poisson curve with rate = median count rate of data. |
 |
 |
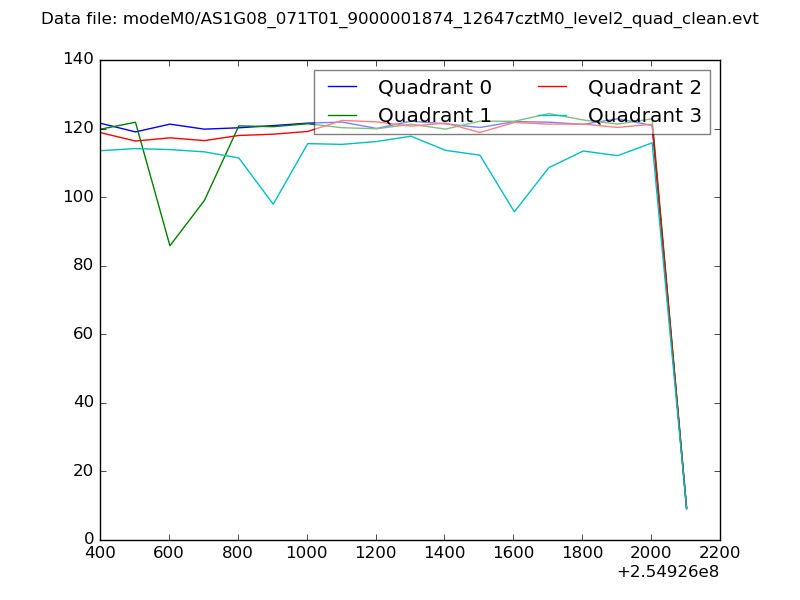
| Quadrant-wise count rates Data is divided into 100 sec bins |
 |
|
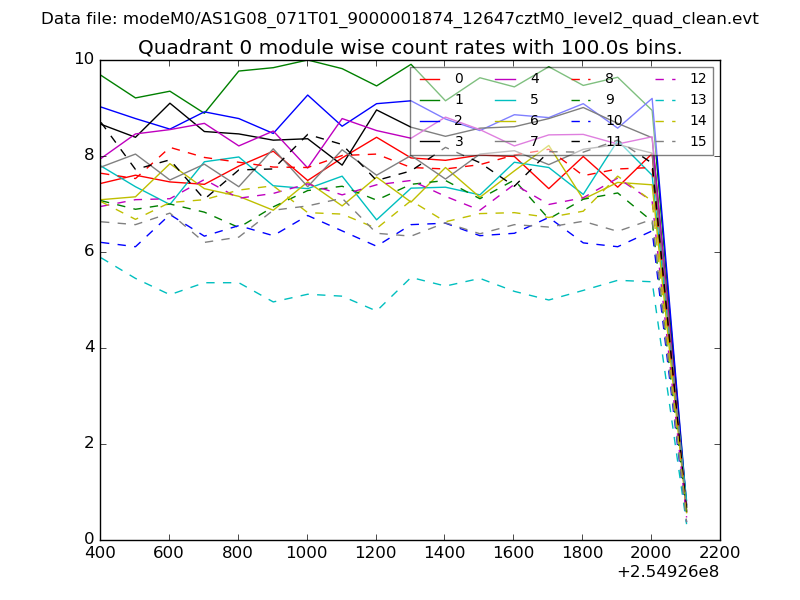
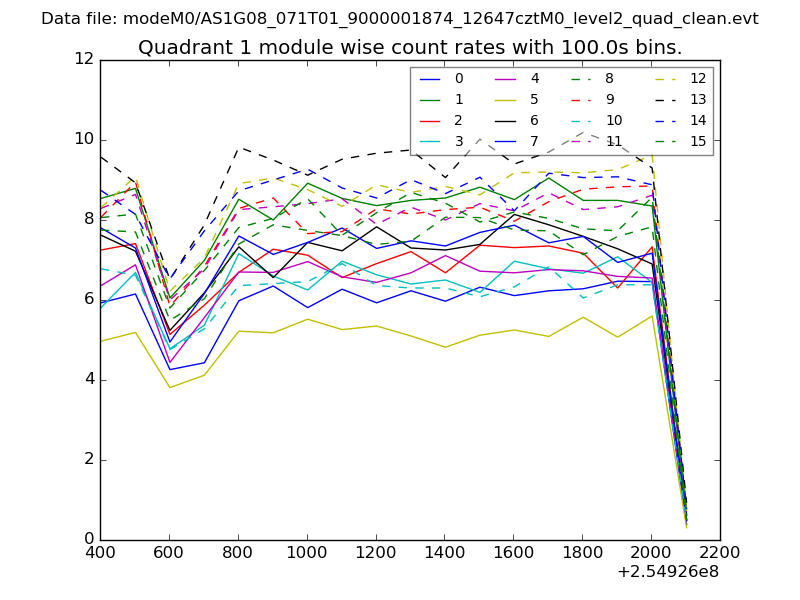
| Module-wise count rates for Quadrant A Data is divided into 100 sec bins |
 |
 |
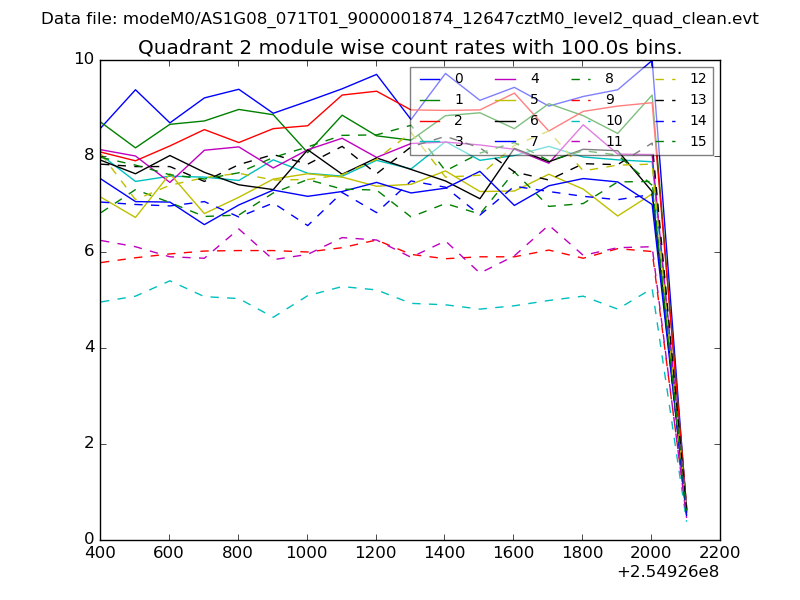
| Module-wise count rates for Quadrant B Data is divided into 100 sec bins |
 |
 |
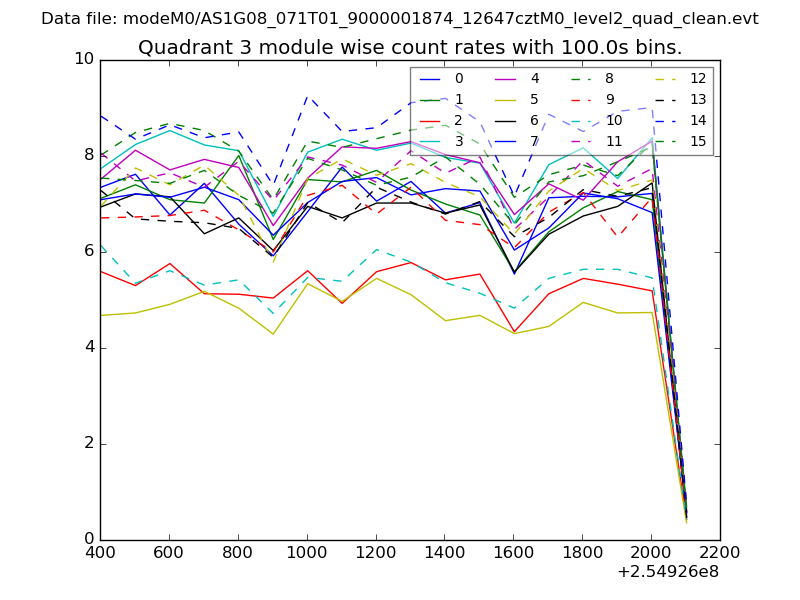
| Module-wise count rates for Quadrant C Data is divided into 100 sec bins |
 |
 |
| Module-wise count rates for Quadrant D Data is divided into 100 sec bins |
 |
 |
| Parameter | Plot |
|---|---|
| CZT HV Monitor | 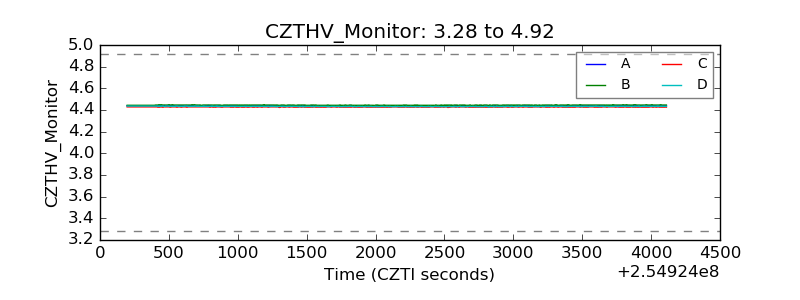 |
| D_VDD |  |
| Temperature 1 | 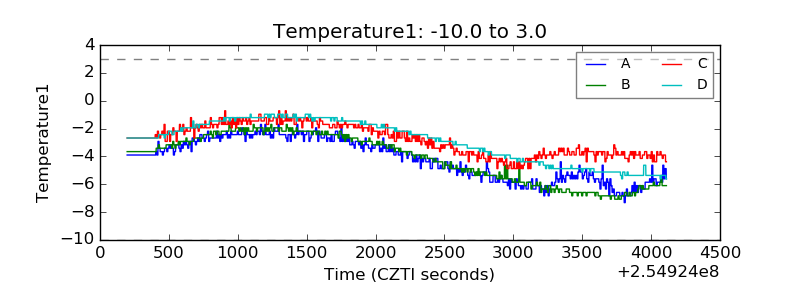 |
| Veto HV Monitor | 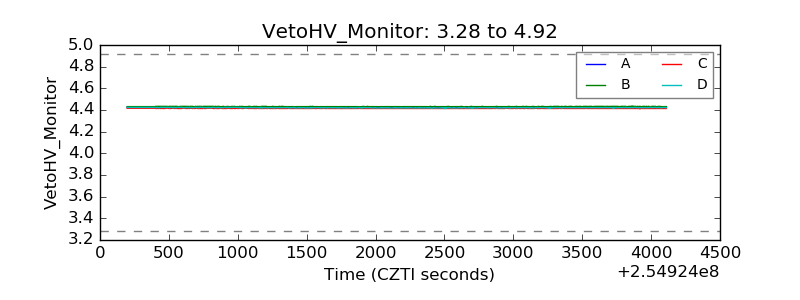 |
| Veto LLD | 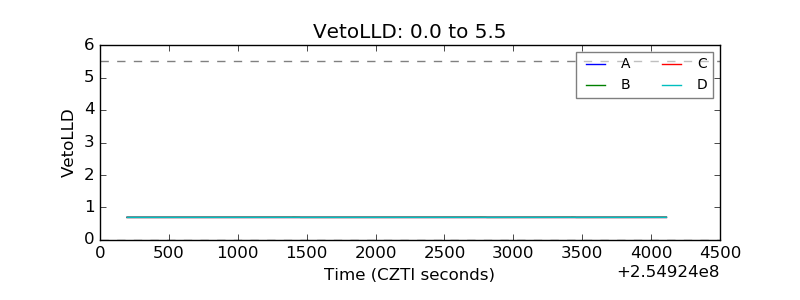 |
| Alpha Counter | 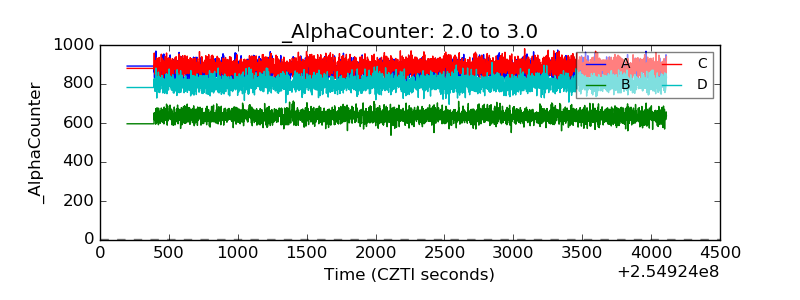 |
| _CPM_Rate | 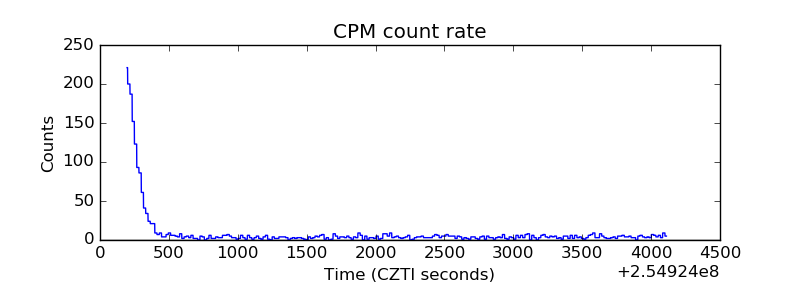 |
| CZT Counter | 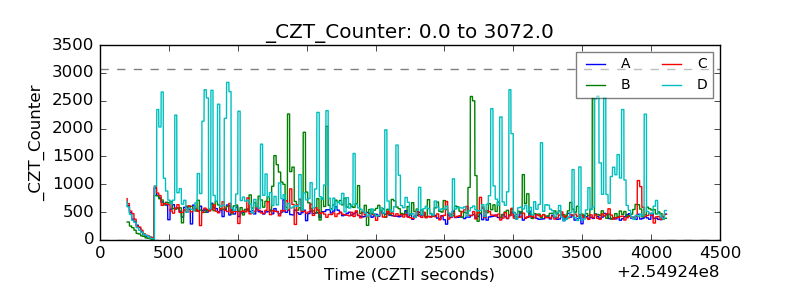 |
| +2.5 Volts monitor |  |
| +5 Volts monitor | 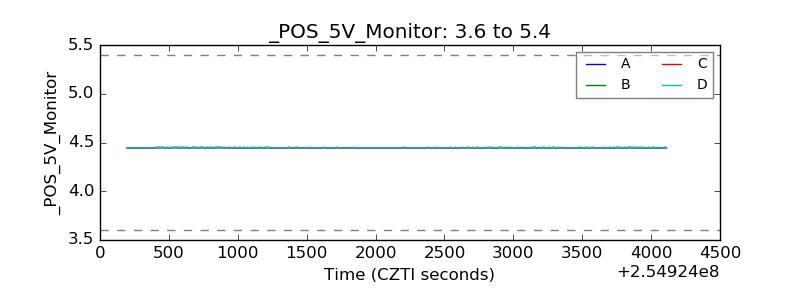 |
| _ROLL_ROT | 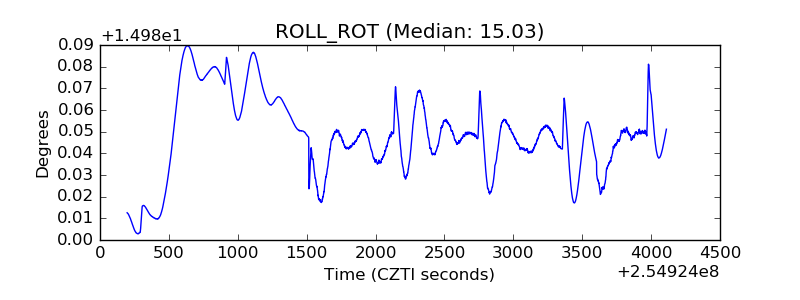 |
| _Roll_DEC | 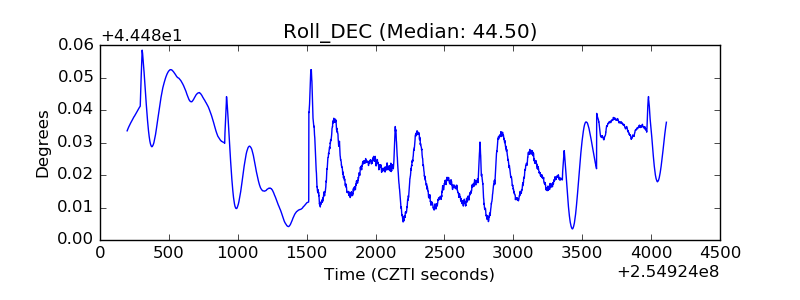 |
| _Roll_RA | 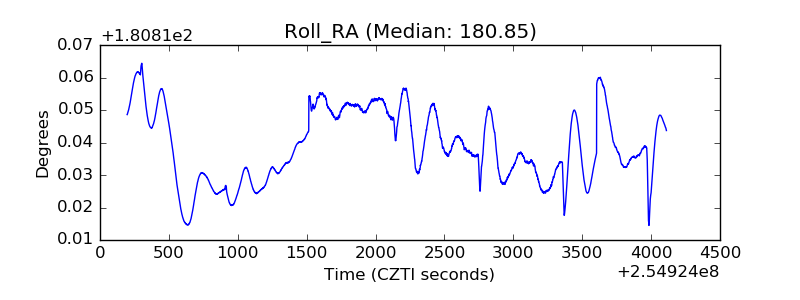 |
| Veto Counter | 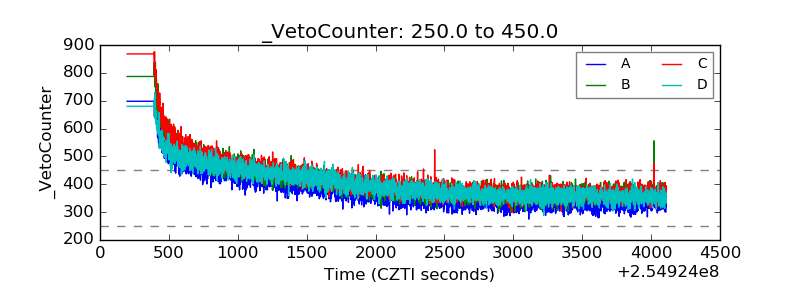 |