| Param | Original file | Final file |
|---|---|---|
| Filename | modeM0/AS1A04_174T01_9000001876cztM0_level2.fits | modeM0/AS1A04_174T01_9000001876cztM0_level2_quad_clean.evt |
| Size (bytes) | 3,577,731,840 | 3,634,387,200 |
| Size | 3.3 GB | 3.4 GB |
| Events in quadrant A | 22,120,440 | 22,850,232 |
| Events in quadrant B | 19,701,134 | 19,541,399 |
| Events in quadrant C | 21,690,988 | 21,894,946 |
| Events in quadrant D | 18,761,318 | 19,733,202 |
| Mode M9 | |||
|---|---|---|---|
| Quadrant | BADHDUFLAG | Total packets | Discarded packets |
| A | 0 | 629 | 0 |
| B | 0 | 629 | 0 |
| C | 0 | 629 | 0 |
| D | 0 | 629 | 0 |
| Mode M0 | |||
|---|---|---|---|
| Quadrant | BADHDUFLAG | Total packets | Discarded packets |
| A | 0 | 817258 | 0 |
| B | 0 | 1136968 | 0 |
| C | 0 | 800887 | 0 |
| D | 0 | 931480 | 0 |
| Mode SS | |||
|---|---|---|---|
| Quadrant | BADHDUFLAG | Total packets | Discarded packets |
| A | 0 | 7746 | 0 |
| B | 0 | 7746 | 0 |
| C | 0 | 7746 | 0 |
| D | 0 | 7746 | 0 |
| Quadrant | Total seconds | Saturated seconds | Saturation percentage |
|---|---|---|---|
| A | 380478 | 6019 | 1.581957% |
| B | 380478 | 46594 | 12.246175% |
| C | 380478 | 3566 | 0.937242% |
| D | 380478 | 12791 | 3.361824% |
Noise dominated data is calculated using 1-second bins in cleaned event files. If a bin has >2000 counts, and if more than 50% of those come from <1% of pixels, then it is considered to be noise-dominated and hence unusable.
| Quadrant | # 1 sec bins | Bins with >0 counts | Bins with >2000 counts | High rate bins dominated by noise | Noise dominated (total time) | Noise dominated (detector-on time) | Marked lightcurve |
|---|---|---|---|---|---|---|---|
| A | 443119 | 380402 | 0 | 0 | 0.00% | 0.00% |  |
| B | 443119 | 374500 | 0 | 0 | 0.00% | 0.00% | 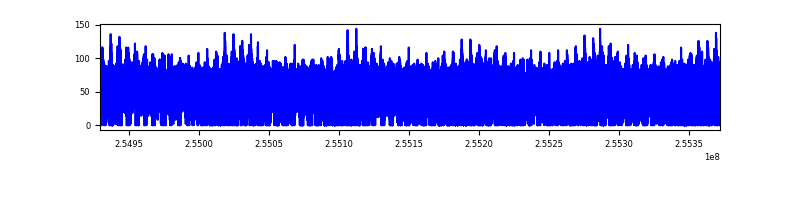 |
| C | 443119 | 380432 | 0 | 0 | 0.00% | 0.00% | 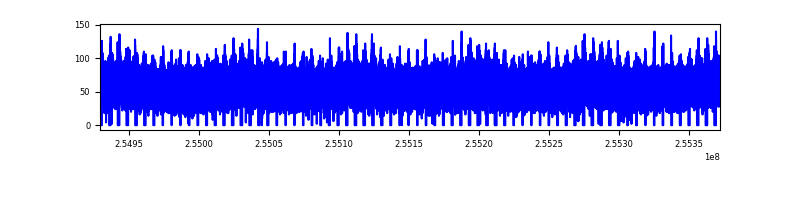 |
| D | 443119 | 380223 | 0 | 0 | 0.00% | 0.00% | 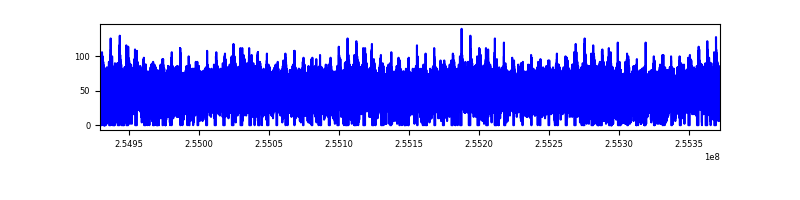 |
Top three noisy pixels from each quadrant. If the there are fewer than three noisy pixels in the level2.evt file, extra rows are filled as -1
| Pixel properties | Quadrant properties | ||||||
|---|---|---|---|---|---|---|---|
| Quadrant | DetID | PixID | Counts | Sigma | Mean | Median | Sigma |
| A | 14 | 188 | 23480 | 12.73 | 5749 | 5381 | 1421.4 |
| A | 0 | 29 | 21941 | 11.65 | 5749 | 5381 | 1421.4 |
| A | 14 | 204 | 19157 | 9.69 | 5749 | 5381 | 1421.4 |
| B | 2 | 9 | 17226 | 11.91 | 5198 | 4951 | 1030.8 |
| B | 3 | 17 | 13363 | 8.16 | 5198 | 4951 | 1030.8 |
| B | 12 | 226 | 13118 | 7.92 | 5198 | 4951 | 1030.8 |
| C | 12 | 241 | 15111 | 6.55 | 5732 | 5323 | 1494.1 |
| C | 2 | 191 | 14655 | 6.25 | 5732 | 5323 | 1494.1 |
| C | 3 | 126 | 14578 | 6.19 | 5732 | 5323 | 1494.1 |
| D | 6 | 231 | 13693 | 6.18 | 5345 | 4856 | 1429.2 |
| D | 3 | 14 | 13538 | 6.07 | 5345 | 4856 | 1429.2 |
| D | 6 | 38 | 13162 | 5.81 | 5345 | 4856 | 1429.2 |
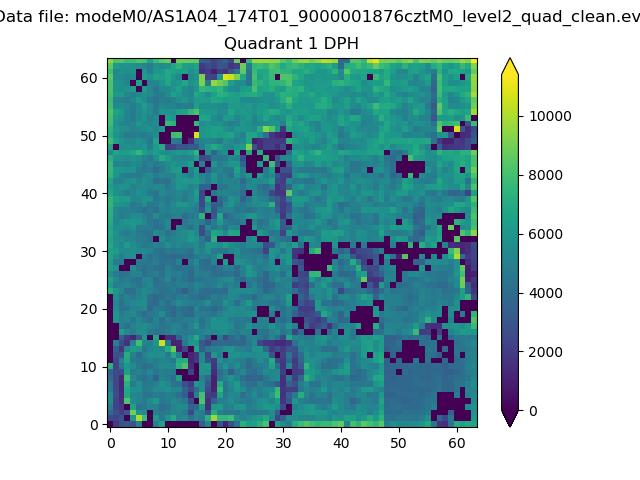
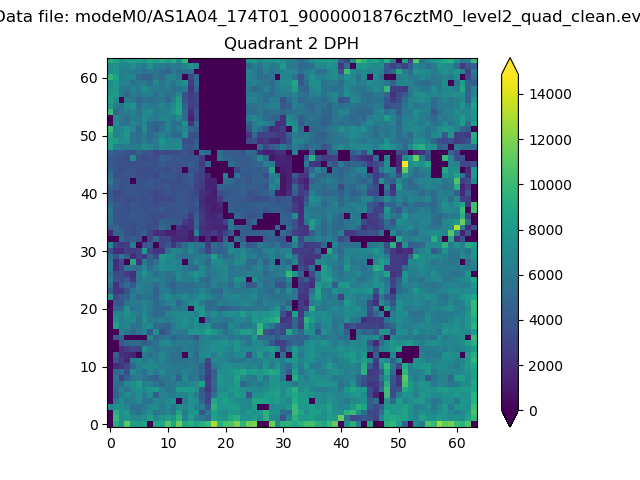
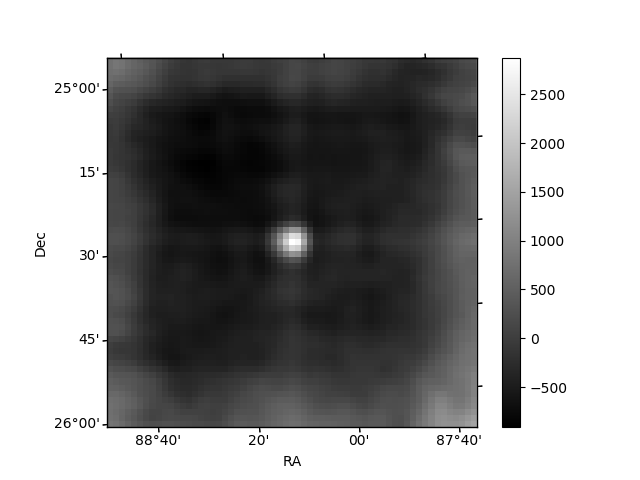
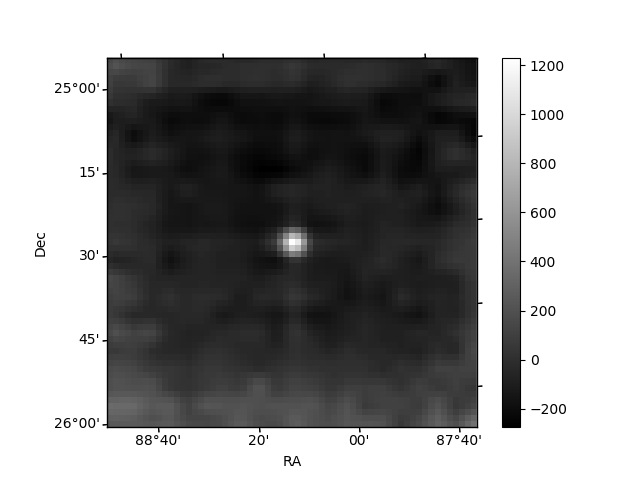
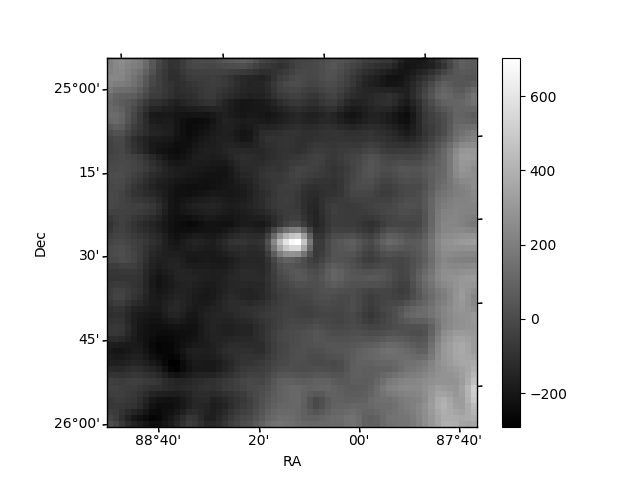
Histogram calculated using DETX and DETY for each event in the final _common_clean file
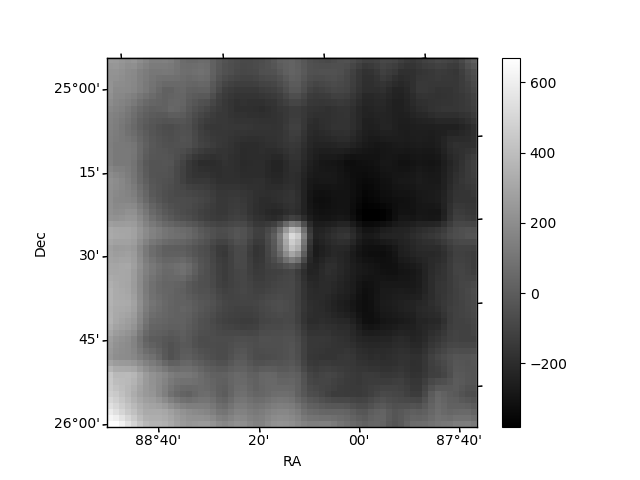
| Quadrant A | 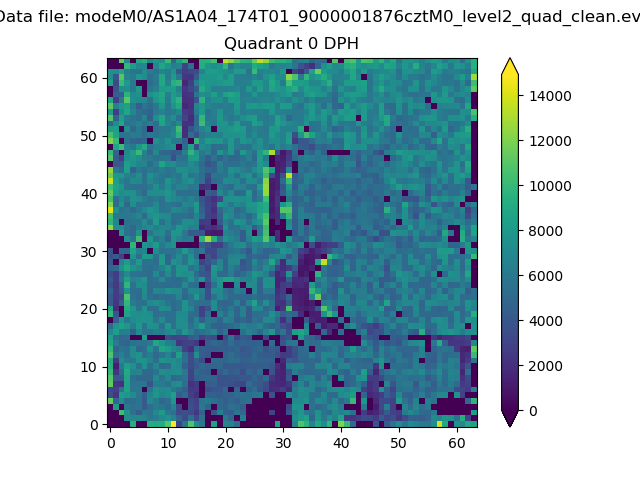 |
 |
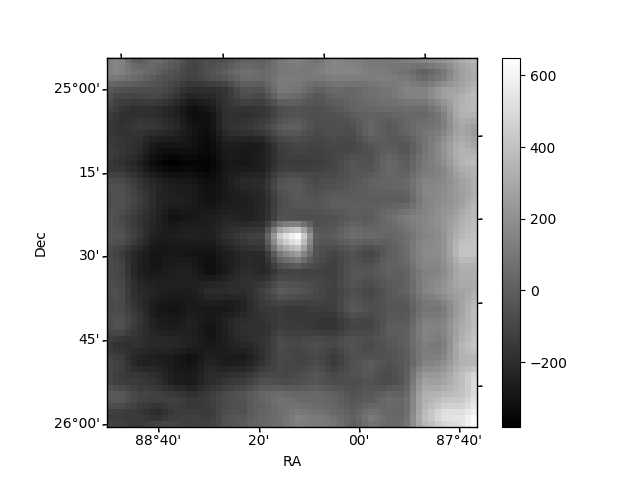
Quadrant B |
|---|---|---|---|
| Quadrant D | 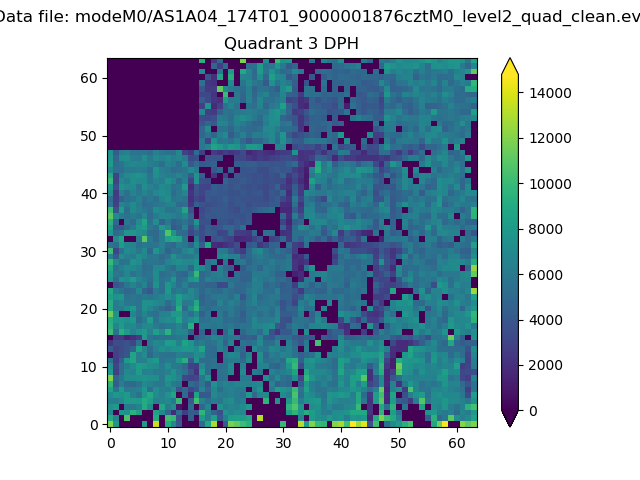 |
 |
Quadrant C |
| Plot type | Count rate plots | Images |
|---|---|---|
| Comparison with Poisson distribution Blue bars denote a histogram of data divided into 1 sec bins. Red curve is a Poisson curve with rate = median count rate of data. |
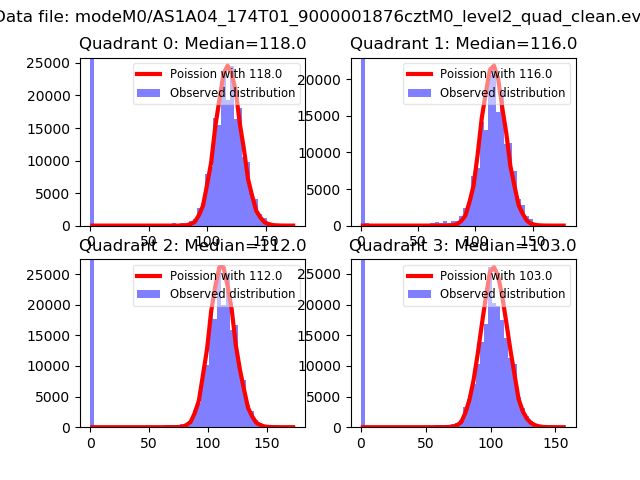 |
 |
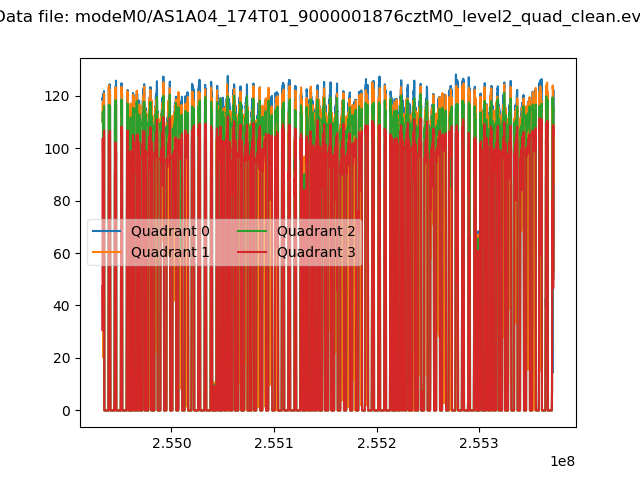
| Quadrant-wise count rates Data is divided into 100 sec bins |
 |
|
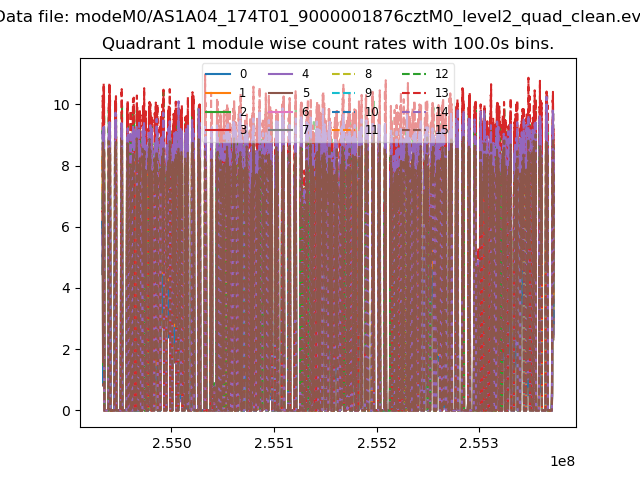
| Module-wise count rates for Quadrant A Data is divided into 100 sec bins |
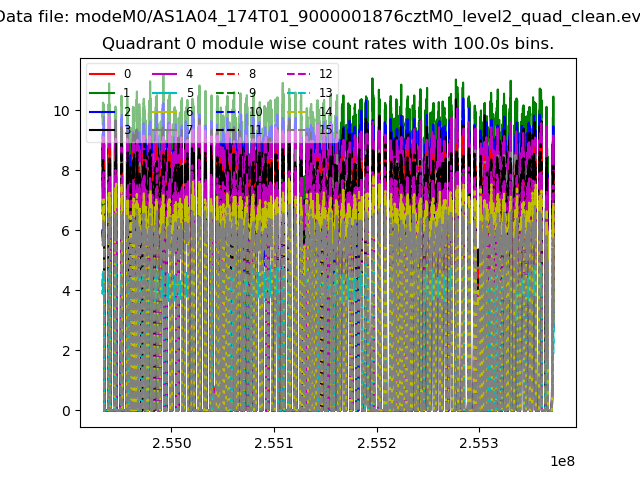 |
 |
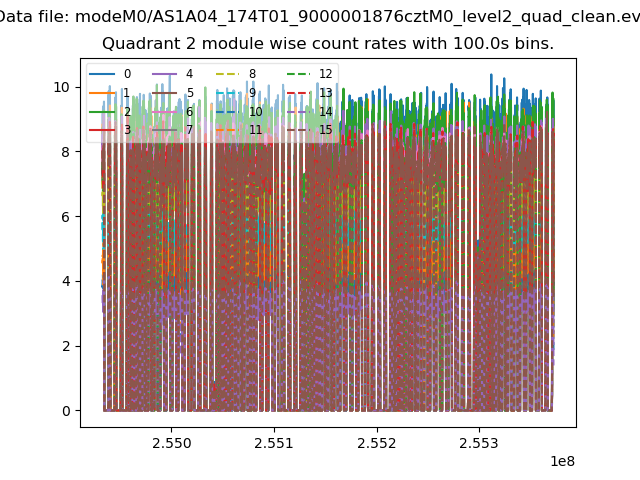
| Module-wise count rates for Quadrant B Data is divided into 100 sec bins |
 |
 |
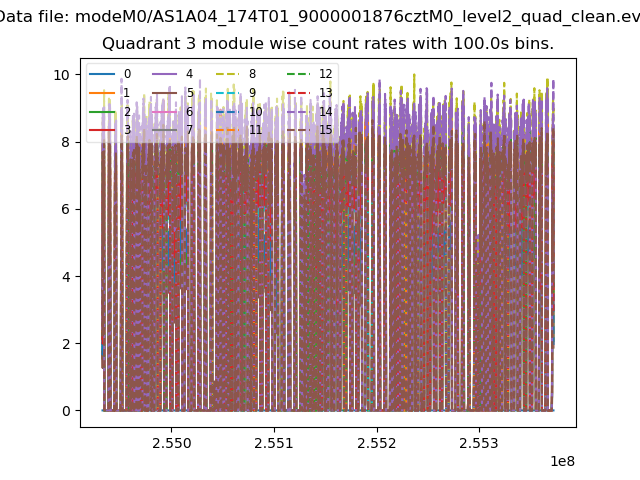
| Module-wise count rates for Quadrant C Data is divided into 100 sec bins |
 |
 |
| Module-wise count rates for Quadrant D Data is divided into 100 sec bins |
 |
 |
| Parameter | Plot |
|---|---|
| CZT HV Monitor | 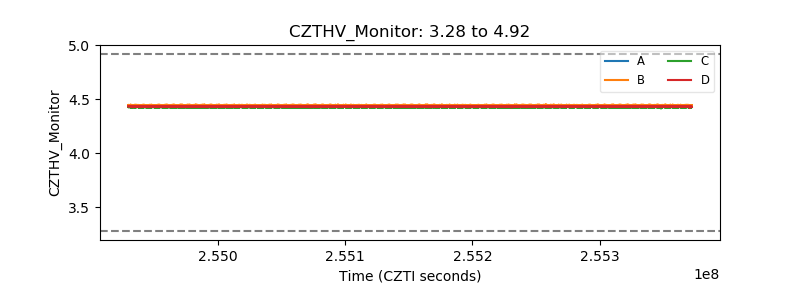 |
| D_VDD | 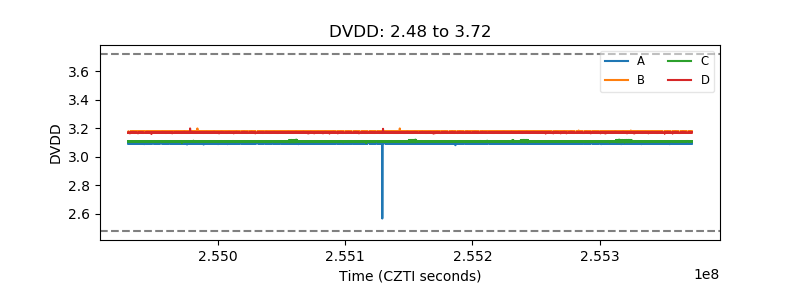 |
| Temperature 1 | 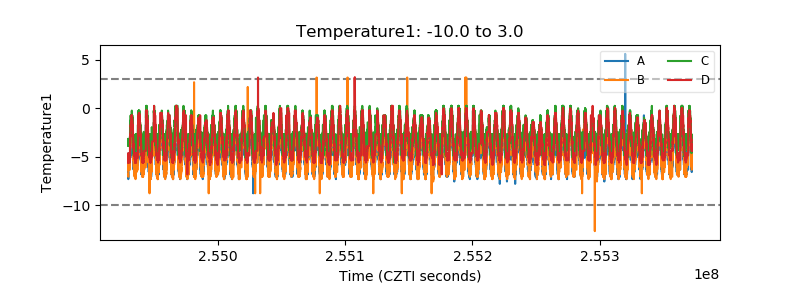 |
| Veto HV Monitor | 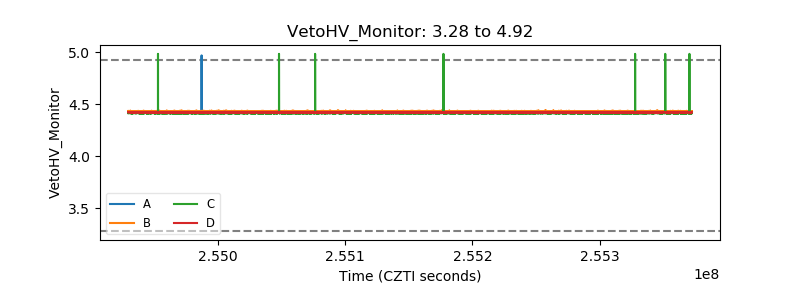 |
| Veto LLD | 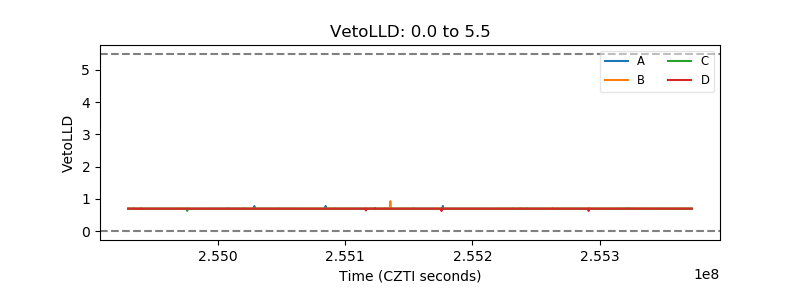 |
| Alpha Counter | 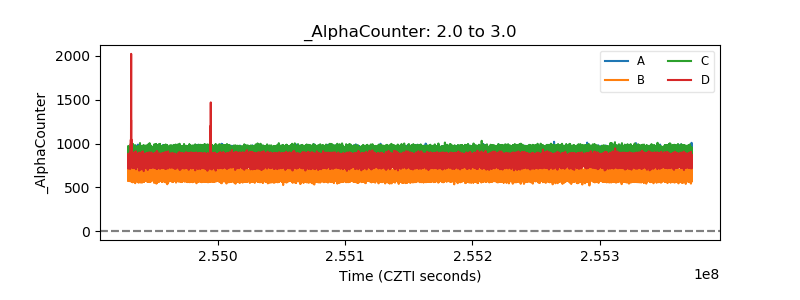 |
| _CPM_Rate | 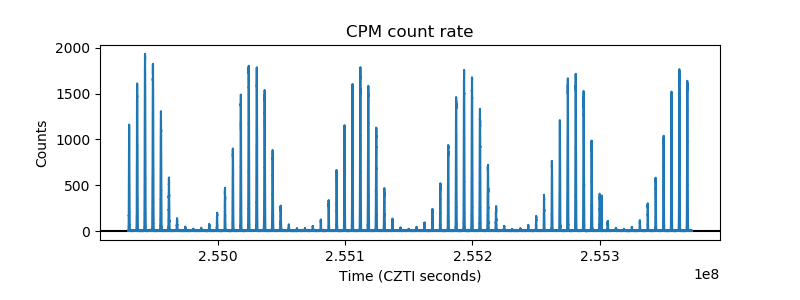 |
| CZT Counter | 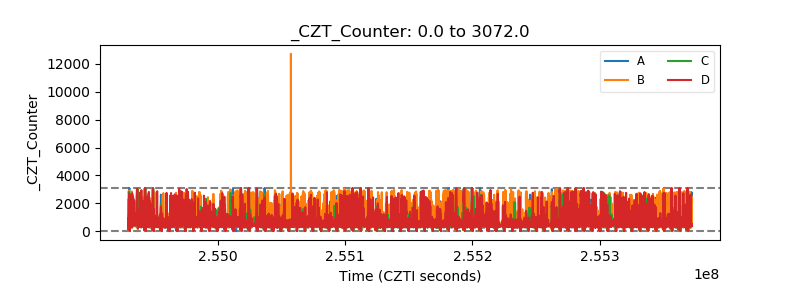 |
| +2.5 Volts monitor | 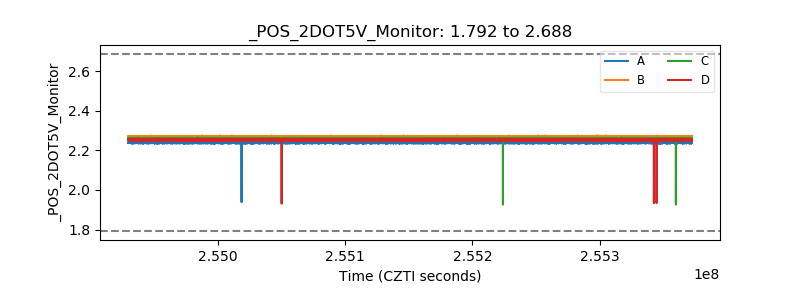 |
| +5 Volts monitor | 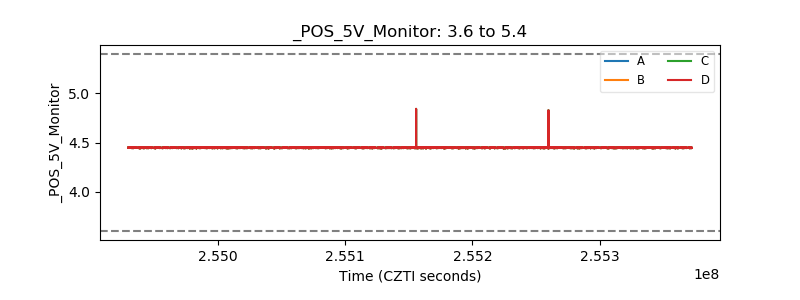 |
| _ROLL_ROT | 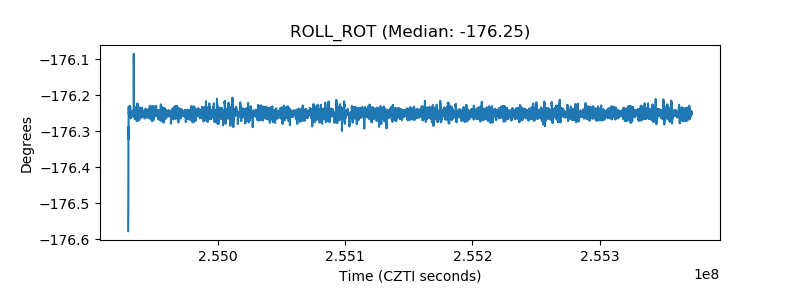 |
| _Roll_DEC | 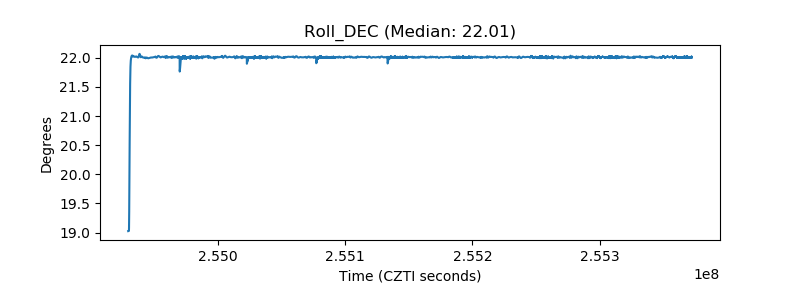 |
| _Roll_RA | 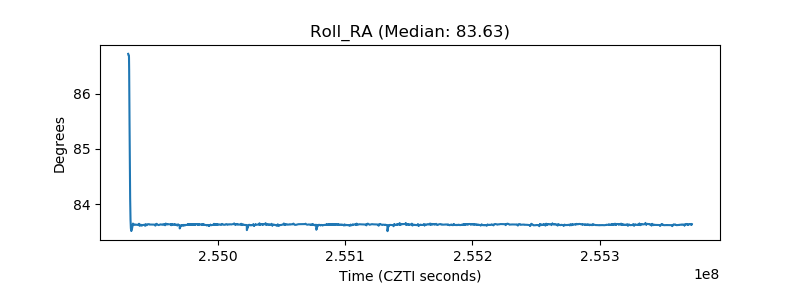 |
| Veto Counter | 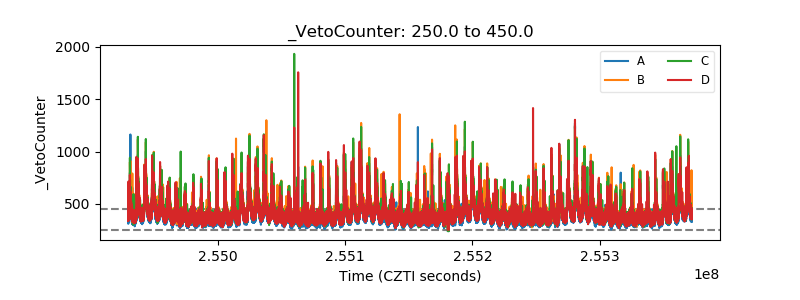 |