| Param | Original file | Final file |
|---|---|---|
| Filename | modeM0/AS1A04_174T01_9000001876_12647cztM0_level2.evt | modeM0/AS1A04_174T01_9000001876_12647cztM0_level2_quad_clean.evt |
| Size (bytes) | 147,522,240 | 29,007,360 |
| Size | 140.7 MB | 27.7 MB |
| Events in quadrant A | 900,712 | 194,116 |
| Events in quadrant B | 1,118,151 | 194,474 |
| Events in quadrant C | 935,657 | 193,116 |
| Events in quadrant D | 1,400,910 | 177,138 |
| Mode M9 | |||
|---|---|---|---|
| Quadrant | BADHDUFLAG | Total packets | Discarded packets |
| A | 0 | 10 | 0 |
| B | 0 | 10 | 0 |
| C | 0 | 10 | 0 |
| D | 0 | 10 | 0 |
| Mode M0 | |||
|---|---|---|---|
| Quadrant | BADHDUFLAG | Total packets | Discarded packets |
| A | 0 | 3707 | 2 |
| B | 0 | 4507 | 1 |
| C | 0 | 3782 | 1 |
| D | 0 | 5327 | 1 |
| Mode SS | |||
|---|---|---|---|
| Quadrant | BADHDUFLAG | Total packets | Discarded packets |
| A | 0 | 36 | 0 |
| B | 0 | 36 | 0 |
| C | 0 | 36 | 0 |
| D | 0 | 36 | 0 |
| Quadrant | Total seconds | Saturated seconds | Saturation percentage |
|---|---|---|---|
| A | 1611 | 44 | 2.731223% |
| B | 1611 | 76 | 4.717567% |
| C | 1611 | 31 | 1.924271% |
| D | 1611 | 126 | 7.821229% |
Noise dominated data is calculated using 1-second bins in cleaned event files. If a bin has >2000 counts, and if more than 50% of those come from <1% of pixels, then it is considered to be noise-dominated and hence unusable.
| Quadrant | # 1 sec bins | Bins with >0 counts | Bins with >2000 counts | High rate bins dominated by noise | Noise dominated (total time) | Noise dominated (detector-on time) | Marked lightcurve |
|---|---|---|---|---|---|---|---|
| A | 2692 | 1612 | 0 | 0 | 0.00% | 0.00% | 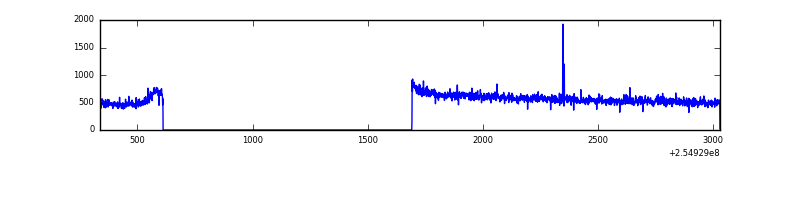 |
| B | 2692 | 1612 | 25 | 25 | 0.93% | 1.55% | 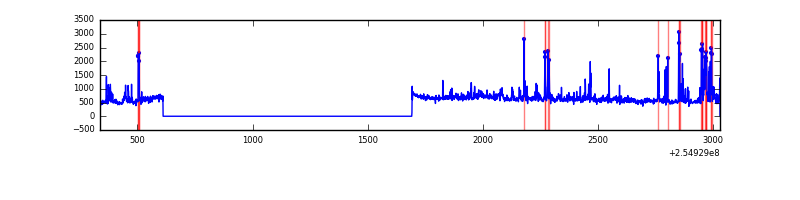 |
| C | 2692 | 1612 | 1 | 1 | 0.04% | 0.06% |  |
| D | 2691 | 1611 | 73 | 73 | 2.71% | 4.53% | 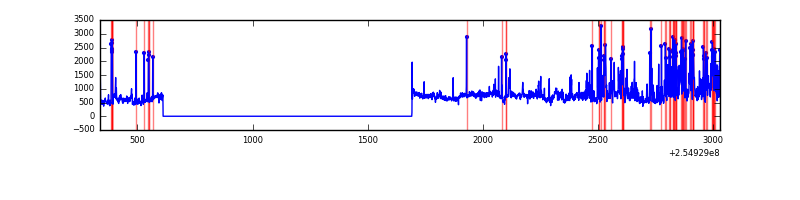 |
Top three noisy pixels from each quadrant. If the there are fewer than three noisy pixels in the level2.evt file, extra rows are filled as -1
| Pixel properties | Quadrant properties | ||||||
|---|---|---|---|---|---|---|---|
| Quadrant | DetID | PixID | Counts | Sigma | Mean | Median | Sigma |
| A | 12 | 189 | 3318 | 63.37 | 232 | 229 | 48.7 |
| A | 13 | 248 | 2370 | 43.92 | 232 | 229 | 48.7 |
| A | 0 | 226 | 2002 | 36.37 | 232 | 229 | 48.7 |
| B | 4 | 239 | 146810 | 3231.88 | 227 | 222 | 45.4 |
| B | 11 | 51 | 44874 | 984.46 | 227 | 222 | 45.4 |
| B | 3 | 64 | 18978 | 413.52 | 227 | 222 | 45.4 |
| C | 15 | 208 | 67601 | 1269.78 | 221 | 223 | 53.1 |
| C | 7 | 238 | 2772 | 48.04 | 221 | 223 | 53.1 |
| C | 13 | 61 | 1571 | 25.4 | 221 | 223 | 53.1 |
| D | 1 | 52 | 477969 | 9013.04 | 218 | 213 | 53.0 |
| D | 10 | 157 | 74809 | 1407.28 | 218 | 213 | 53.0 |
| D | 13 | 249 | 9455 | 174.35 | 218 | 213 | 53.0 |
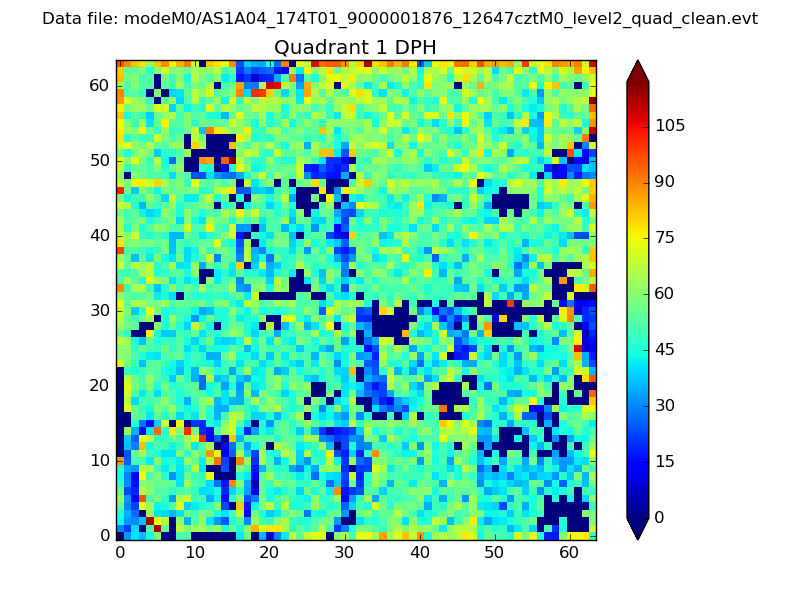
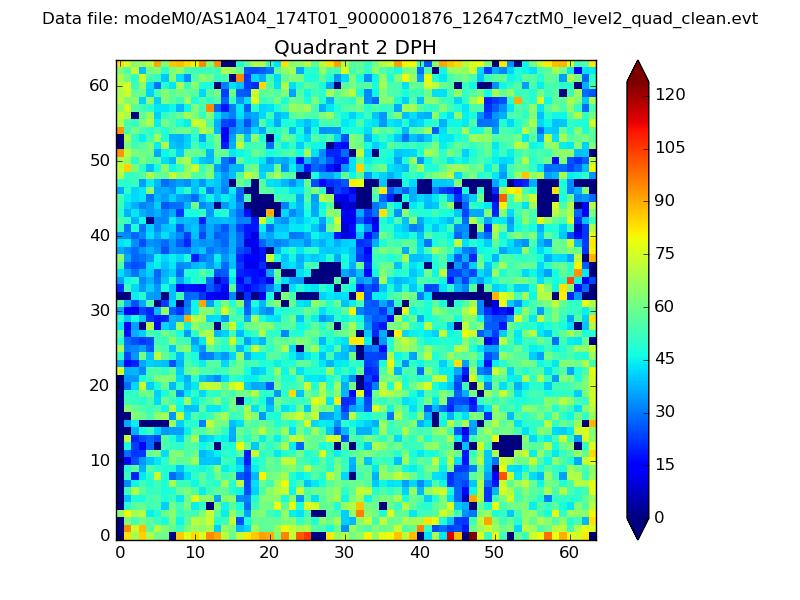
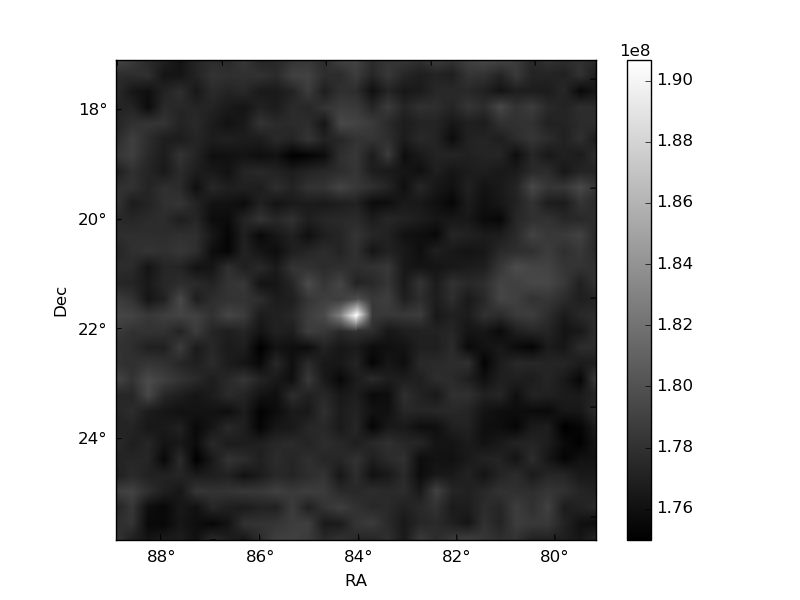
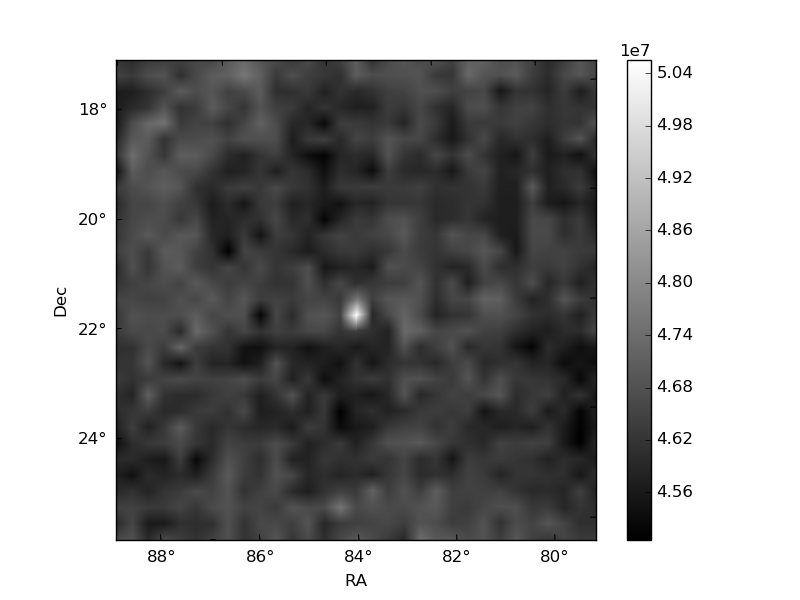
Histogram calculated using DETX and DETY for each event in the final _common_clean file
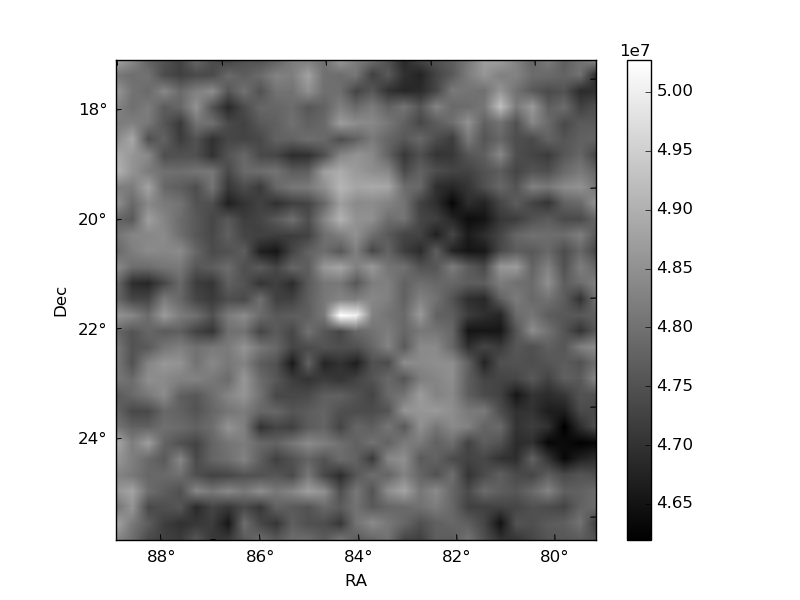
| Quadrant A | 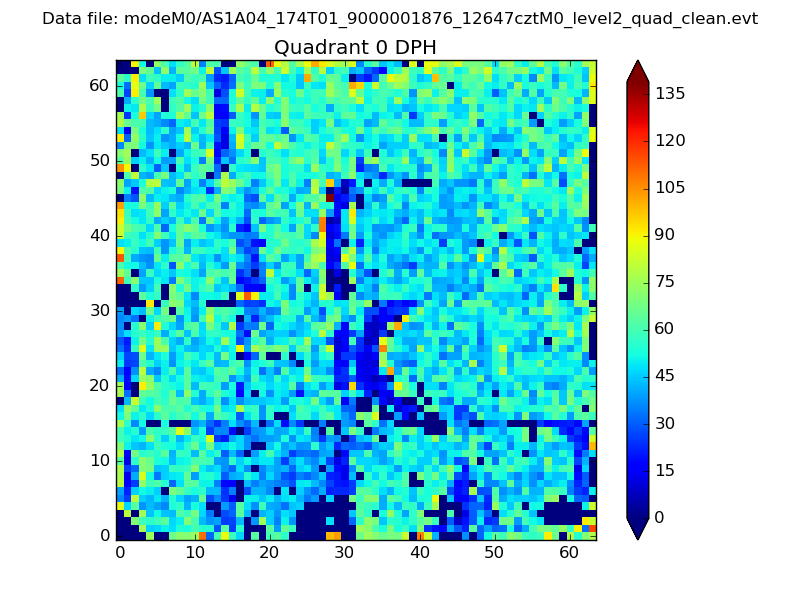 |
 |
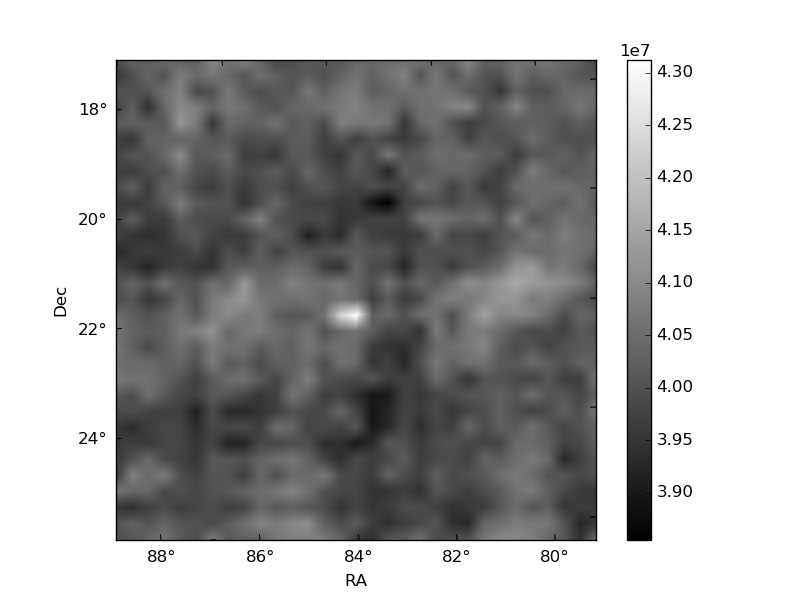
Quadrant B |
|---|---|---|---|
| Quadrant D | 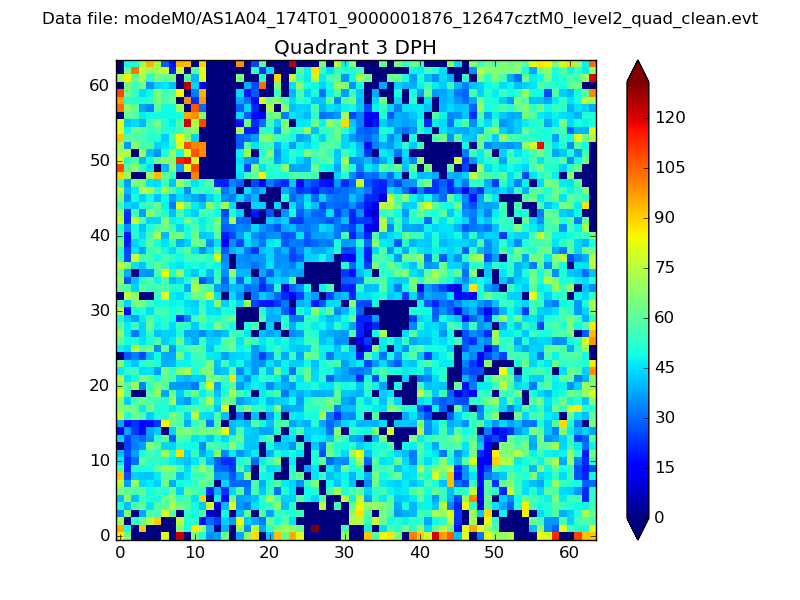 |
 |
Quadrant C |
| Plot type | Count rate plots | Images |
|---|---|---|
| Comparison with Poisson distribution Blue bars denote a histogram of data divided into 1 sec bins. Red curve is a Poisson curve with rate = median count rate of data. |
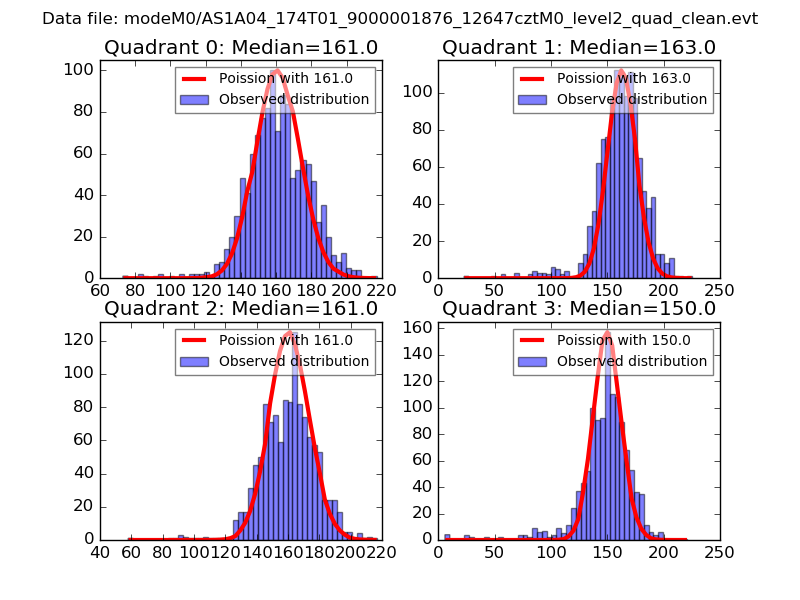 |
 |
| Quadrant-wise count rates Data is divided into 100 sec bins |
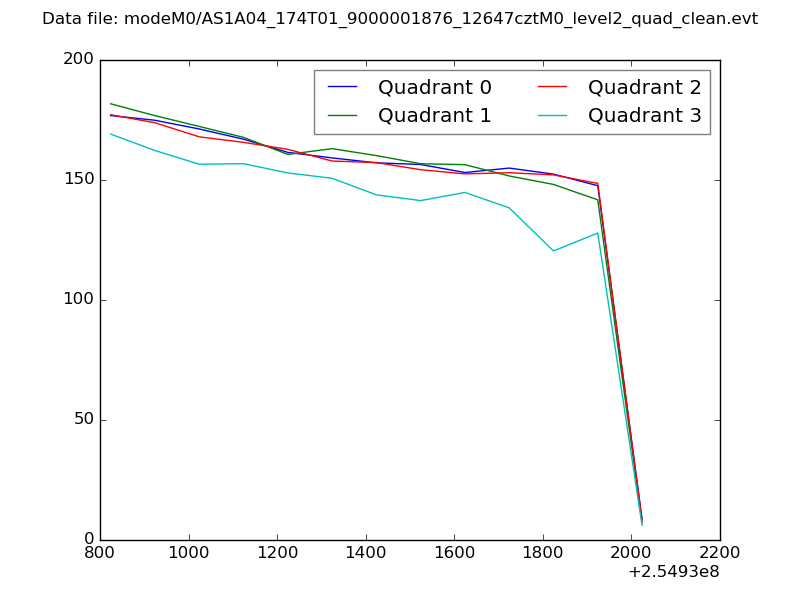 |
|
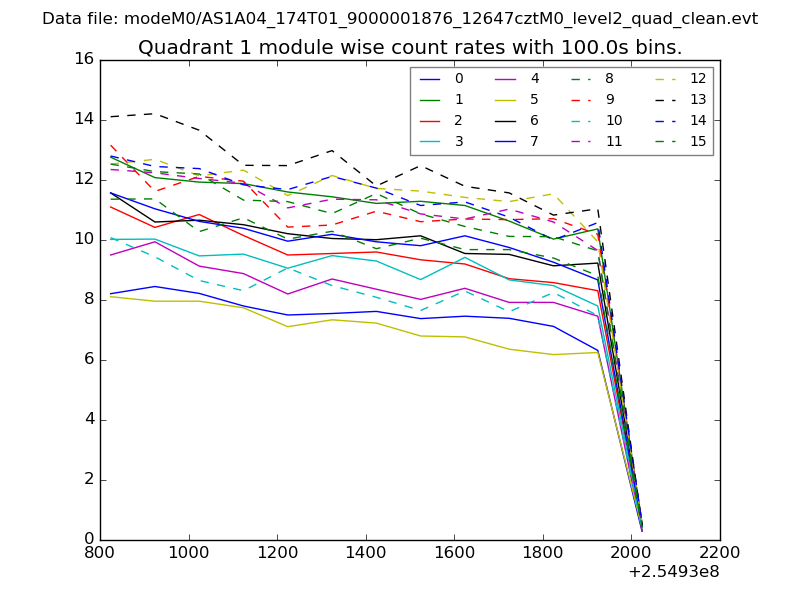
| Module-wise count rates for Quadrant A Data is divided into 100 sec bins |
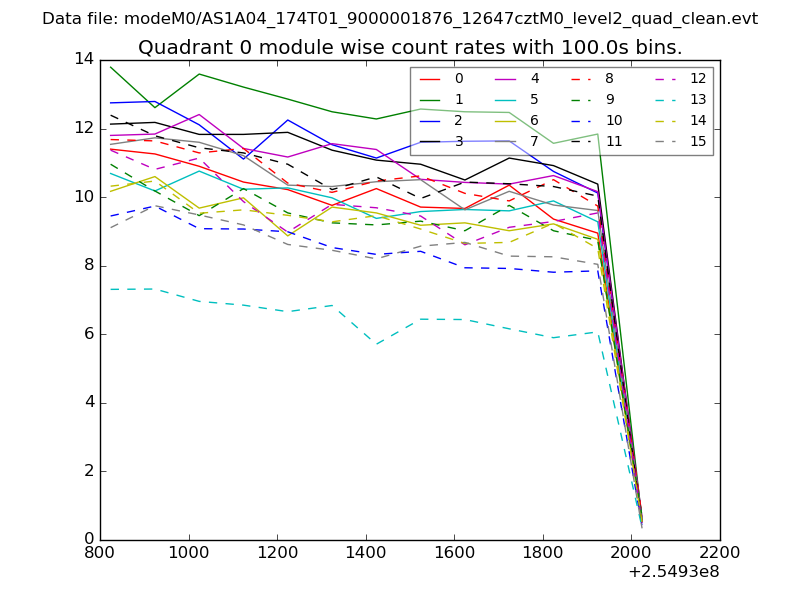 |
 |
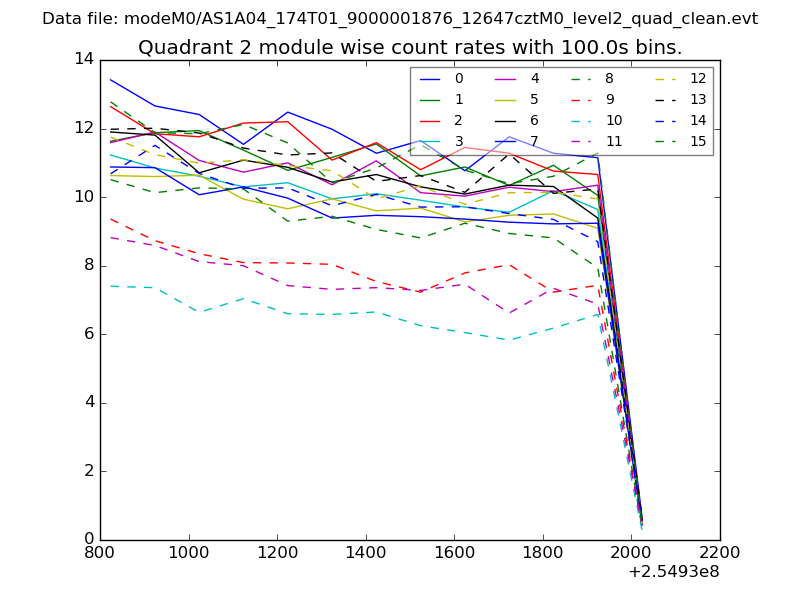
| Module-wise count rates for Quadrant B Data is divided into 100 sec bins |
 |
 |
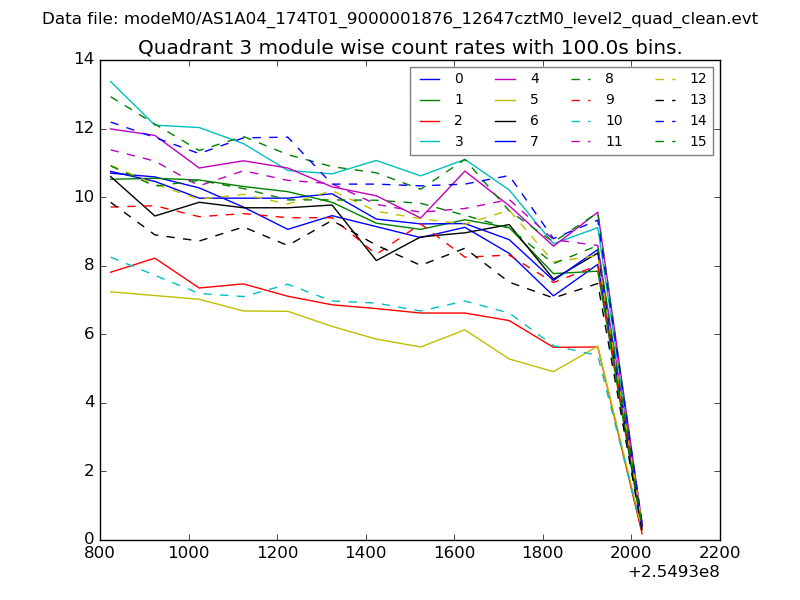
| Module-wise count rates for Quadrant C Data is divided into 100 sec bins |
 |
 |
| Module-wise count rates for Quadrant D Data is divided into 100 sec bins |
 |
 |
| Parameter | Plot |
|---|---|
| CZT HV Monitor | 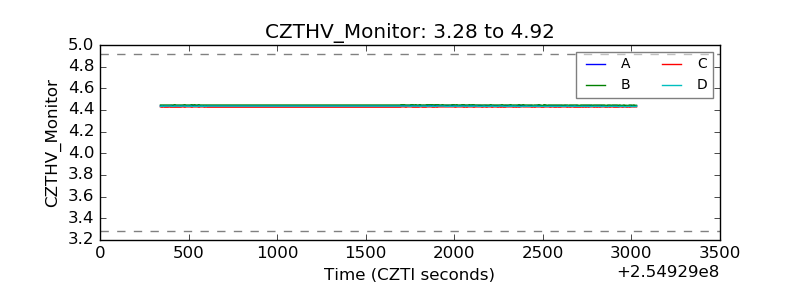 |
| D_VDD | 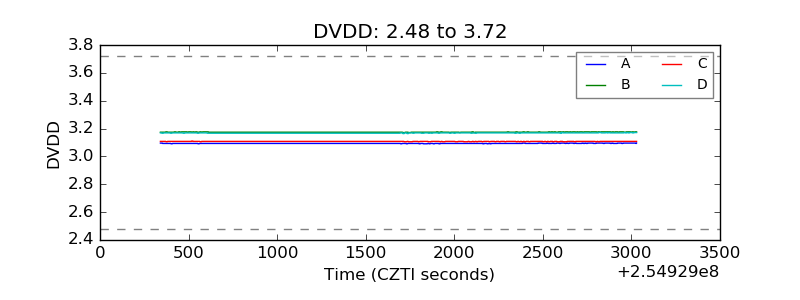 |
| Temperature 1 | 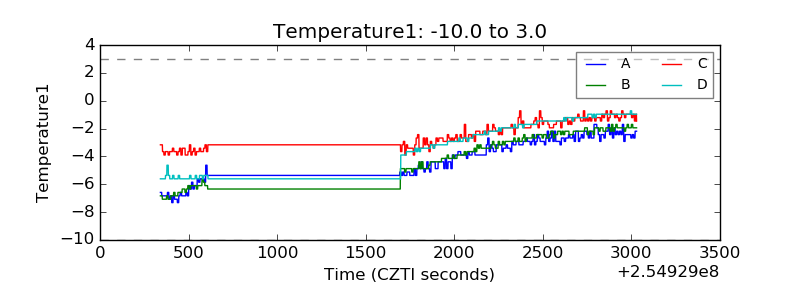 |
| Veto HV Monitor | 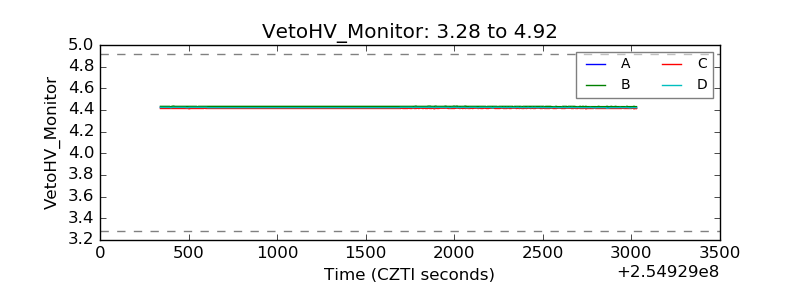 |
| Veto LLD | 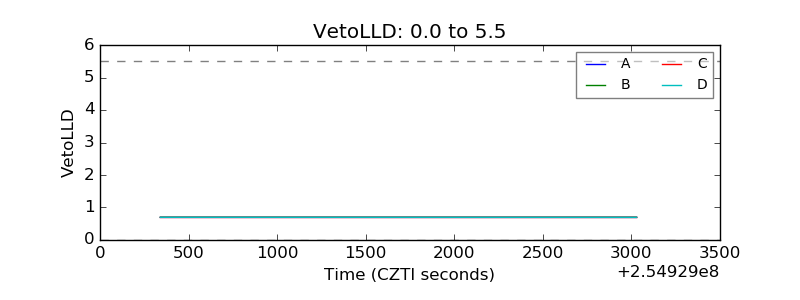 |
| Alpha Counter | 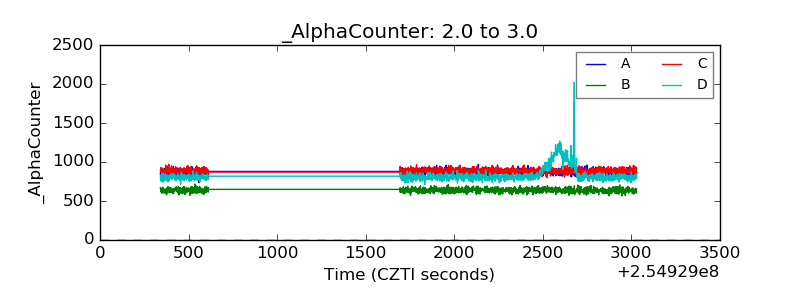 |
| _CPM_Rate | 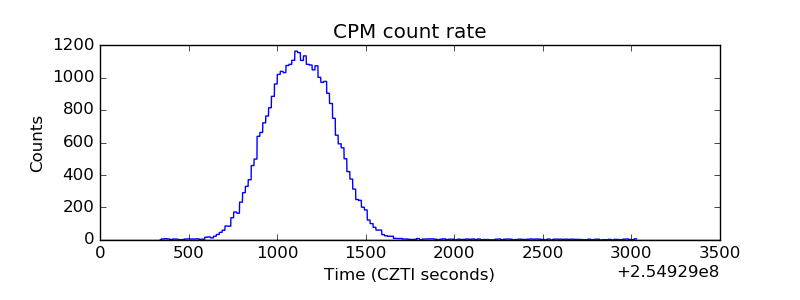 |
| CZT Counter | 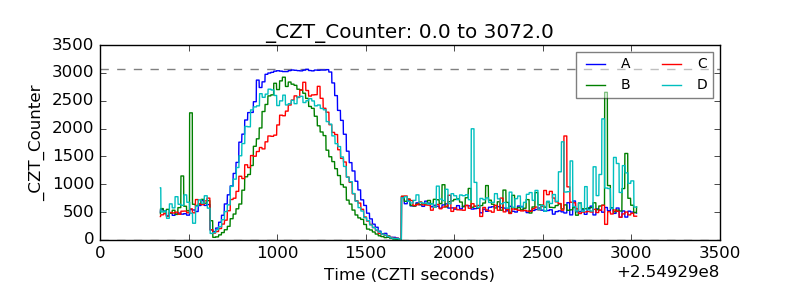 |
| +2.5 Volts monitor |  |
| +5 Volts monitor |  |
| _ROLL_ROT | 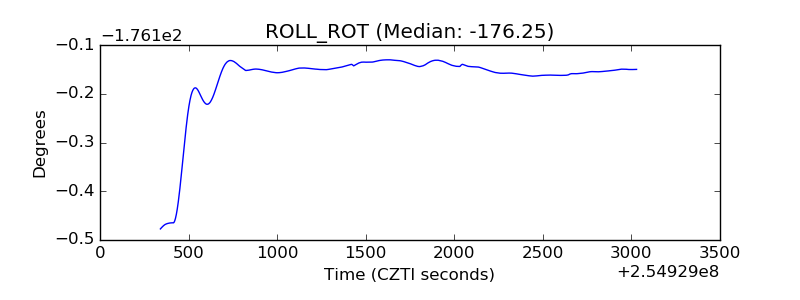 |
| _Roll_DEC | 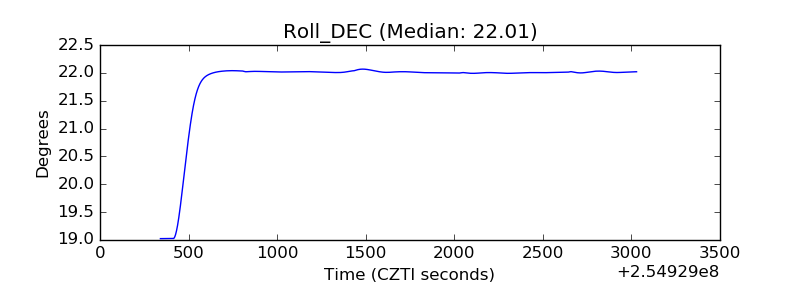 |
| _Roll_RA | 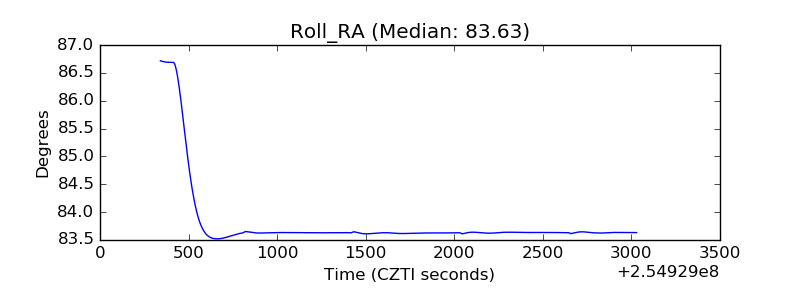 |
| Veto Counter | 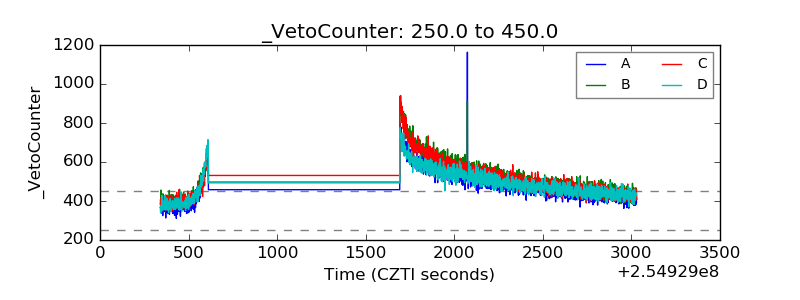 |