| Param | Original file | Final file |
|---|---|---|
| Filename | modeM0/AS1A04_174T01_9000001876_12648cztM0_level2.evt | modeM0/AS1A04_174T01_9000001876_12648cztM0_level2_quad_clean.evt |
| Size (bytes) | 566,939,520 | 104,431,680 |
| Size | 540.7 MB | 99.6 MB |
| Events in quadrant A | 3,019,296 | 727,959 |
| Events in quadrant B | 4,720,982 | 673,384 |
| Events in quadrant C | 3,114,735 | 716,712 |
| Events in quadrant D | 5,901,555 | 618,447 |
| Mode M9 | |||
|---|---|---|---|
| Quadrant | BADHDUFLAG | Total packets | Discarded packets |
| A | 0 | 12 | 0 |
| B | 0 | 12 | 0 |
| C | 0 | 12 | 0 |
| D | 0 | 12 | 0 |
| Mode M0 | |||
|---|---|---|---|
| Quadrant | BADHDUFLAG | Total packets | Discarded packets |
| A | 0 | 12890 | 2 |
| B | 0 | 17977 | 1 |
| C | 0 | 13200 | 1 |
| D | 0 | 21673 | 1 |
| Mode SS | |||
|---|---|---|---|
| Quadrant | BADHDUFLAG | Total packets | Discarded packets |
| A | 0 | 124 | 0 |
| B | 0 | 124 | 0 |
| C | 0 | 124 | 0 |
| D | 0 | 124 | 0 |
| Quadrant | Total seconds | Saturated seconds | Saturation percentage |
|---|---|---|---|
| A | 6097 | 67 | 1.098901% |
| B | 6097 | 631 | 10.349352% |
| C | 6097 | 81 | 1.328522% |
| D | 6097 | 903 | 14.810563% |
Noise dominated data is calculated using 1-second bins in cleaned event files. If a bin has >2000 counts, and if more than 50% of those come from <1% of pixels, then it is considered to be noise-dominated and hence unusable.
| Quadrant | # 1 sec bins | Bins with >0 counts | Bins with >2000 counts | High rate bins dominated by noise | Noise dominated (total time) | Noise dominated (detector-on time) | Marked lightcurve |
|---|---|---|---|---|---|---|---|
| A | 7258 | 6098 | 0 | 0 | 0.00% | 0.00% | 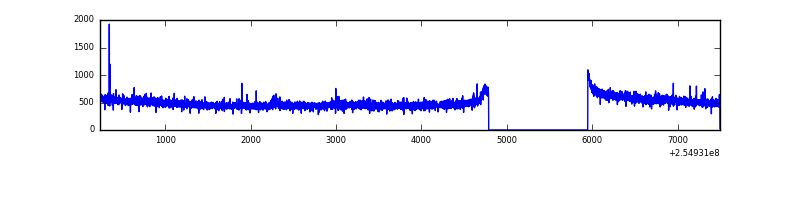 |
| B | 7258 | 6098 | 513 | 513 | 7.07% | 8.41% | 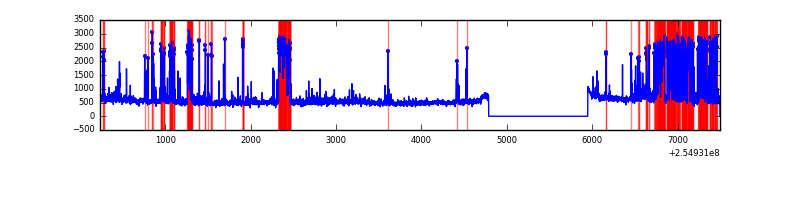 |
| C | 7258 | 6098 | 29 | 29 | 0.40% | 0.48% | 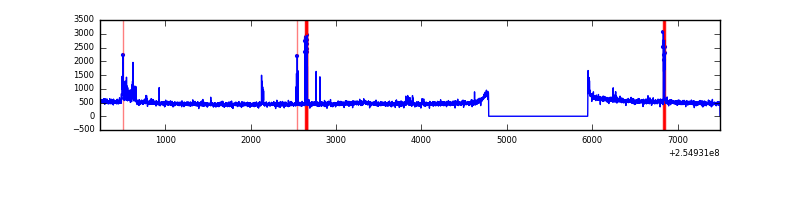 |
| D | 7258 | 6098 | 740 | 740 | 10.20% | 12.14% | 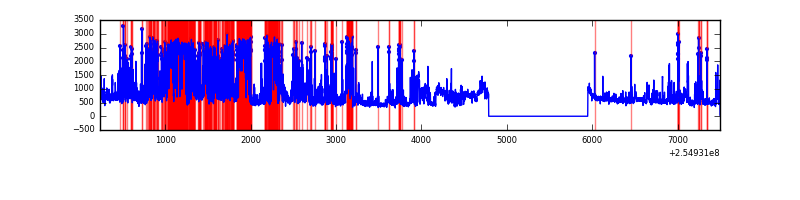 |
Top three noisy pixels from each quadrant. If the there are fewer than three noisy pixels in the level2.evt file, extra rows are filled as -1
| Pixel properties | Quadrant properties | ||||||
|---|---|---|---|---|---|---|---|
| Quadrant | DetID | PixID | Counts | Sigma | Mean | Median | Sigma |
| A | 8 | 15 | 14456 | 86.19 | 781 | 767 | 158.8 |
| A | 0 | 226 | 7002 | 39.26 | 781 | 767 | 158.8 |
| A | 12 | 194 | 6060 | 33.33 | 781 | 767 | 158.8 |
| B | 4 | 239 | 1576609 | 11376.0 | 732 | 718 | 138.5 |
| B | 11 | 51 | 127171 | 912.84 | 732 | 718 | 138.5 |
| B | 3 | 209 | 57366 | 408.93 | 732 | 718 | 138.5 |
| C | 15 | 208 | 181535 | 1039.99 | 750 | 760 | 173.8 |
| C | 14 | 234 | 8163 | 42.59 | 750 | 760 | 173.8 |
| C | 13 | 61 | 5249 | 25.82 | 750 | 760 | 173.8 |
| D | 1 | 52 | 2926739 | 17435.29 | 703 | 688 | 167.8 |
| D | 10 | 157 | 263224 | 1564.36 | 703 | 688 | 167.8 |
| D | 2 | 234 | 21693 | 125.16 | 703 | 688 | 167.8 |
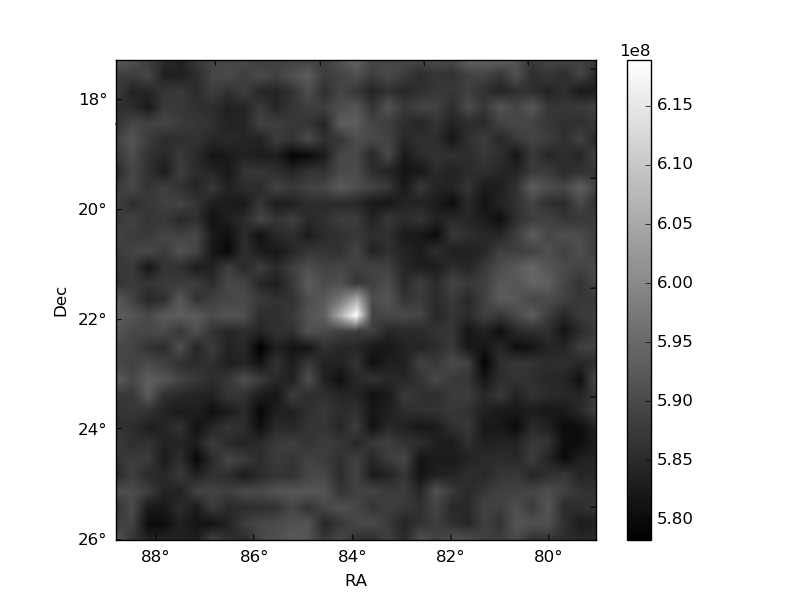
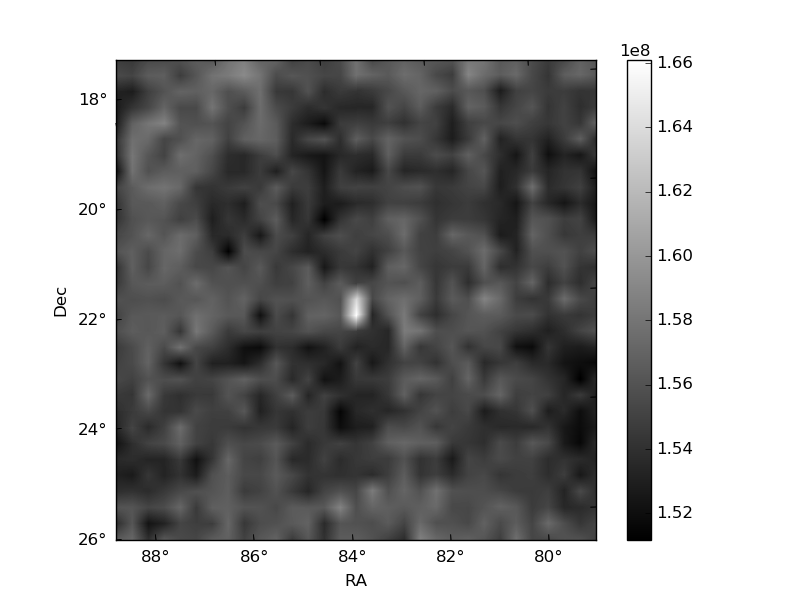
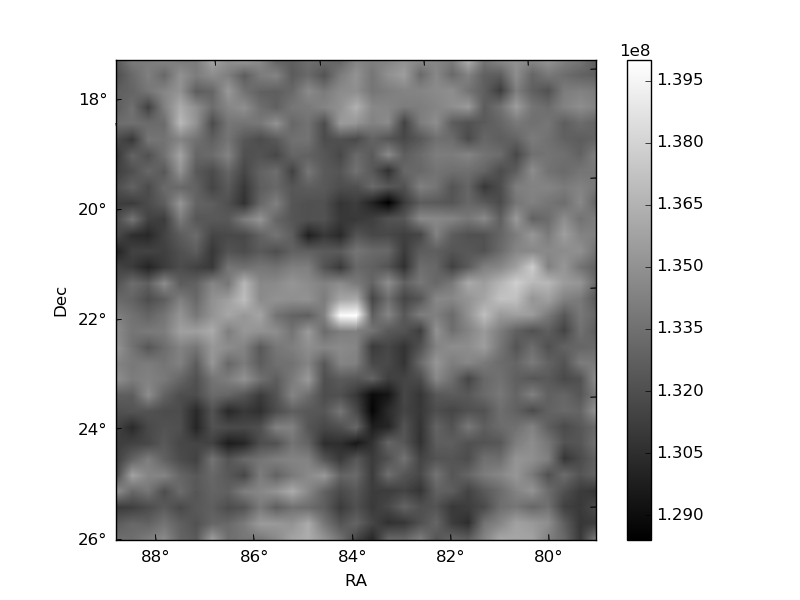
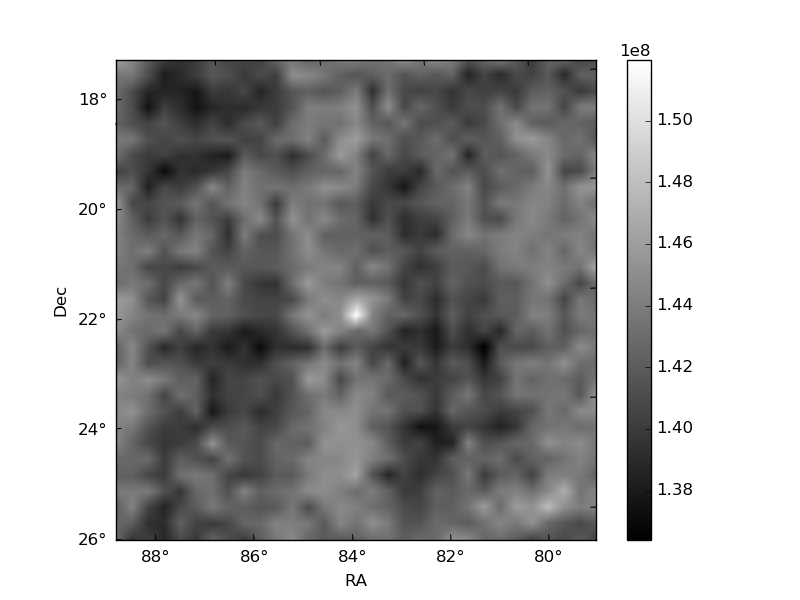
Histogram calculated using DETX and DETY for each event in the final _common_clean file
| Quadrant A | 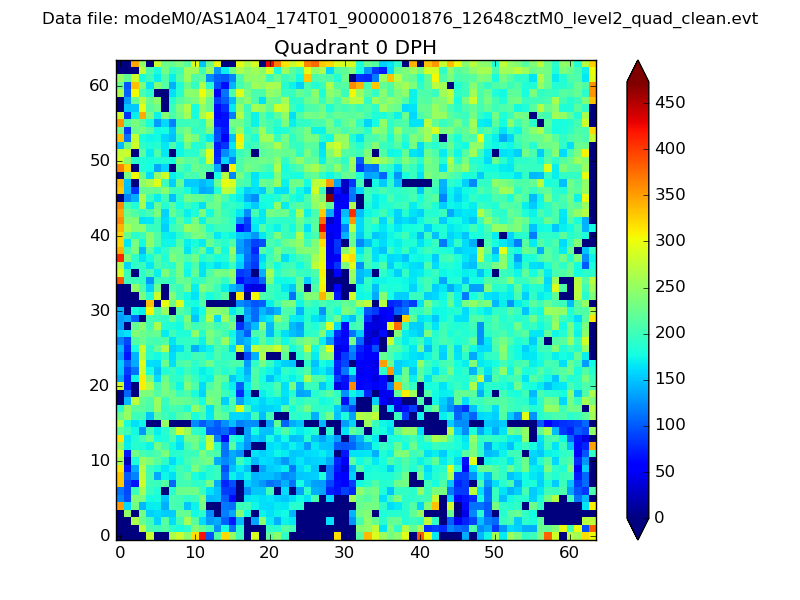 |
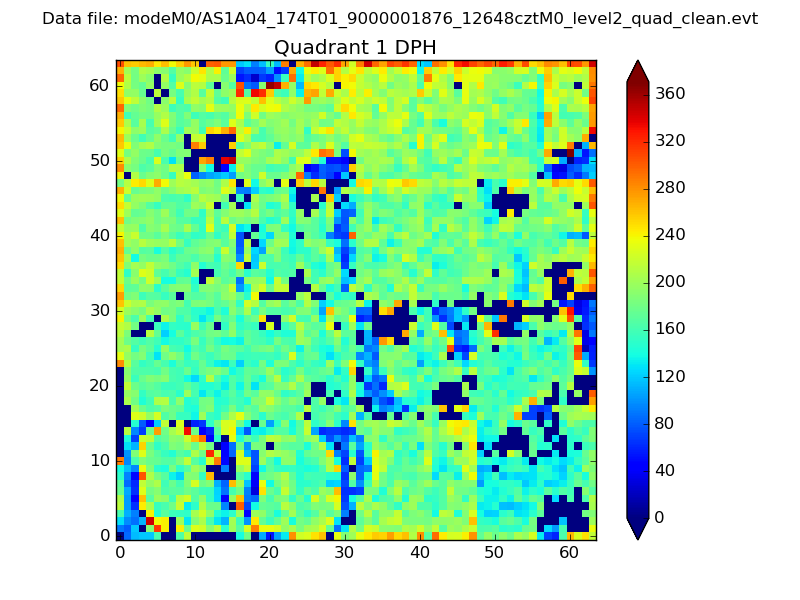 |
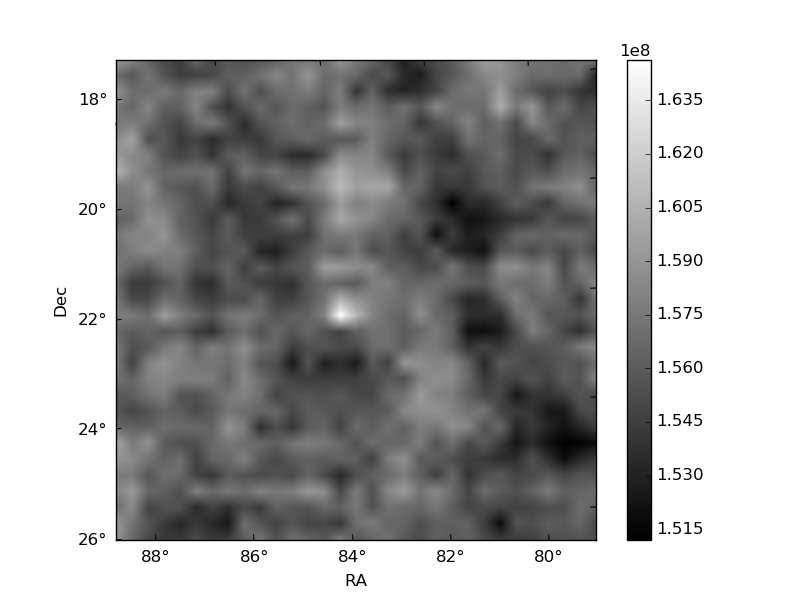
Quadrant B |
|---|---|---|---|
| Quadrant D | 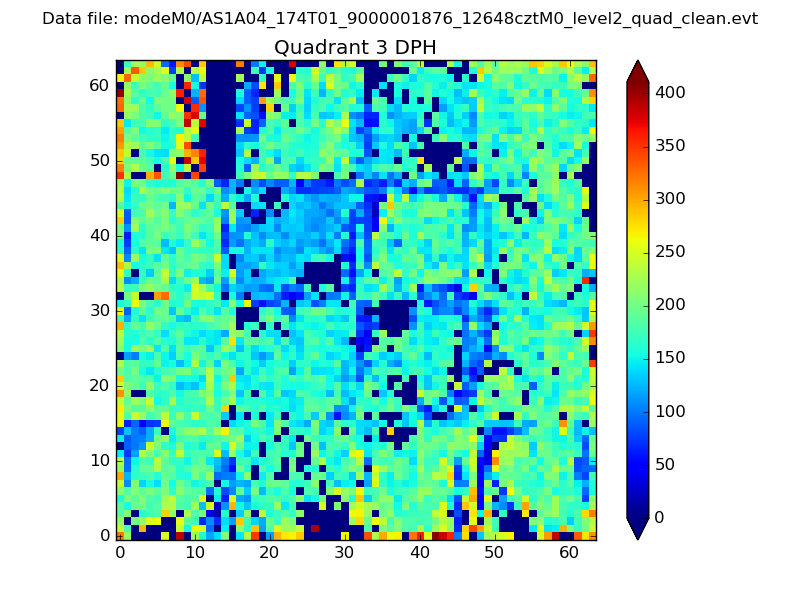 |
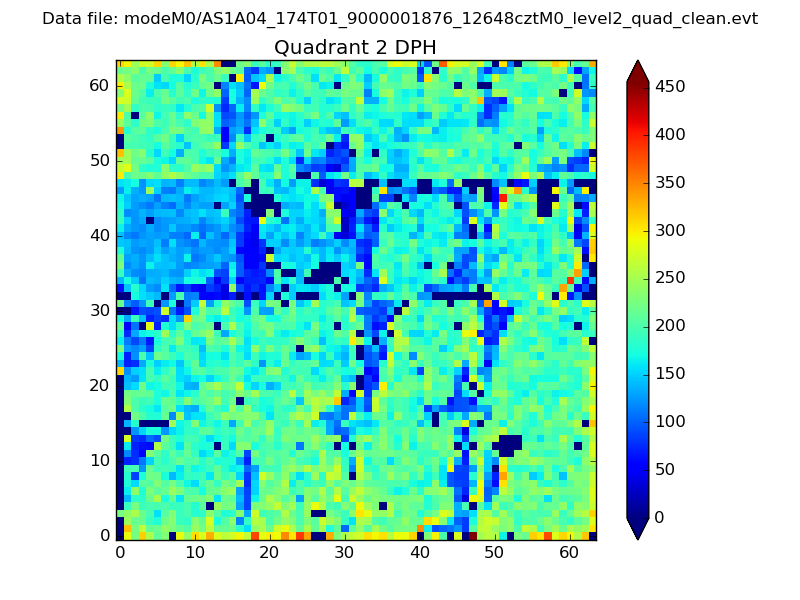 |
Quadrant C |
| Plot type | Count rate plots | Images |
|---|---|---|
| Comparison with Poisson distribution Blue bars denote a histogram of data divided into 1 sec bins. Red curve is a Poisson curve with rate = median count rate of data. |
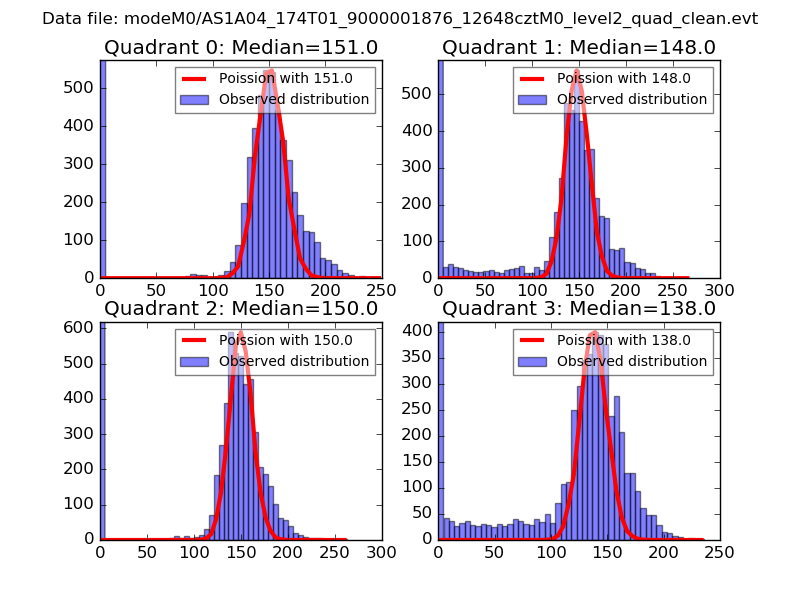 |
 |
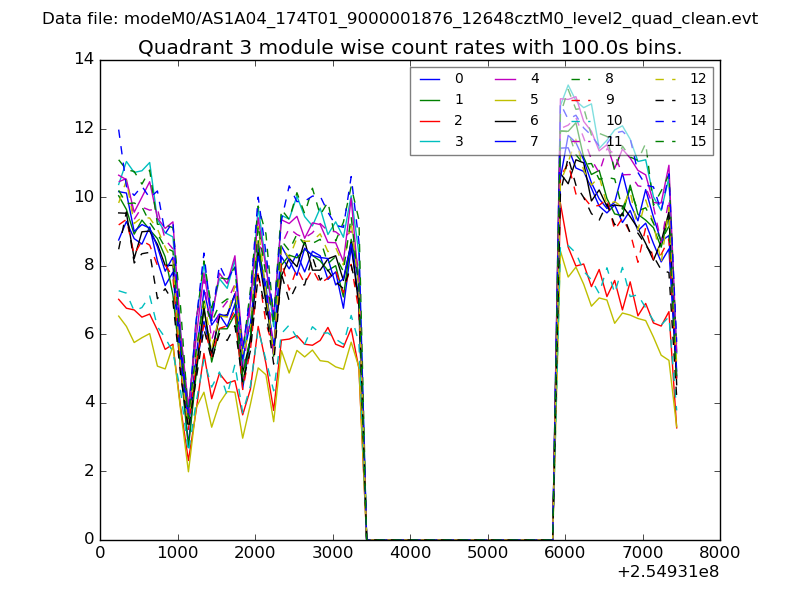
| Quadrant-wise count rates Data is divided into 100 sec bins |
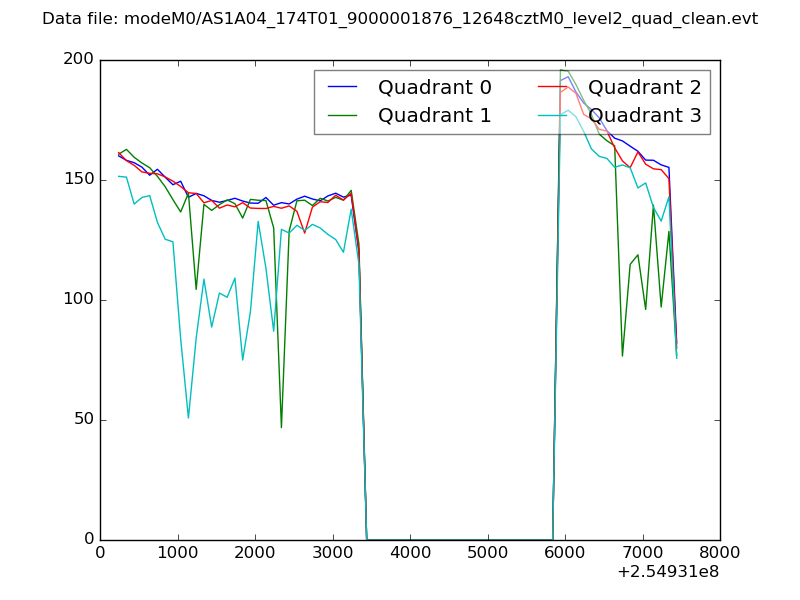 |
|
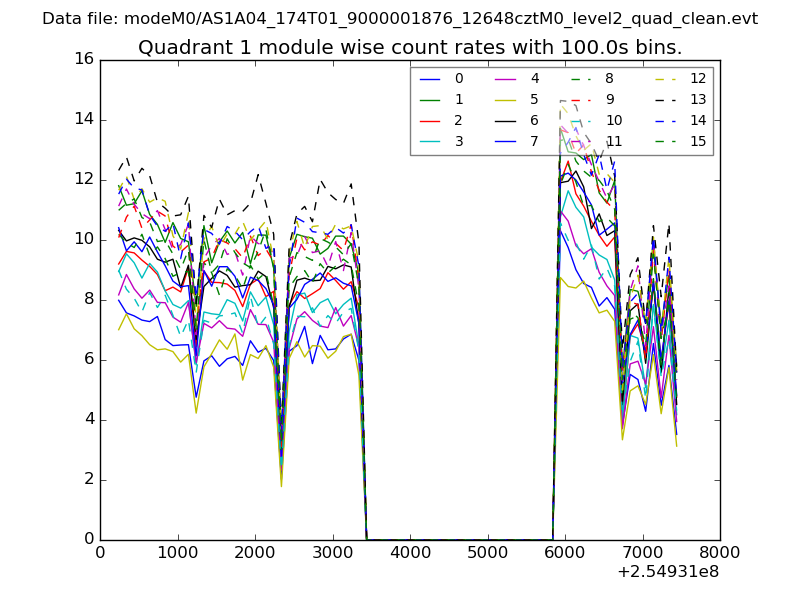
| Module-wise count rates for Quadrant A Data is divided into 100 sec bins |
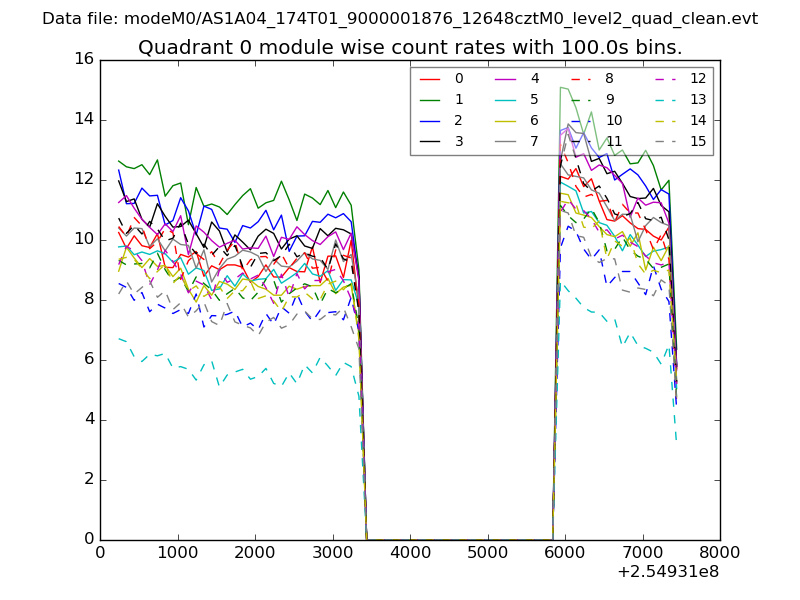 |
 |
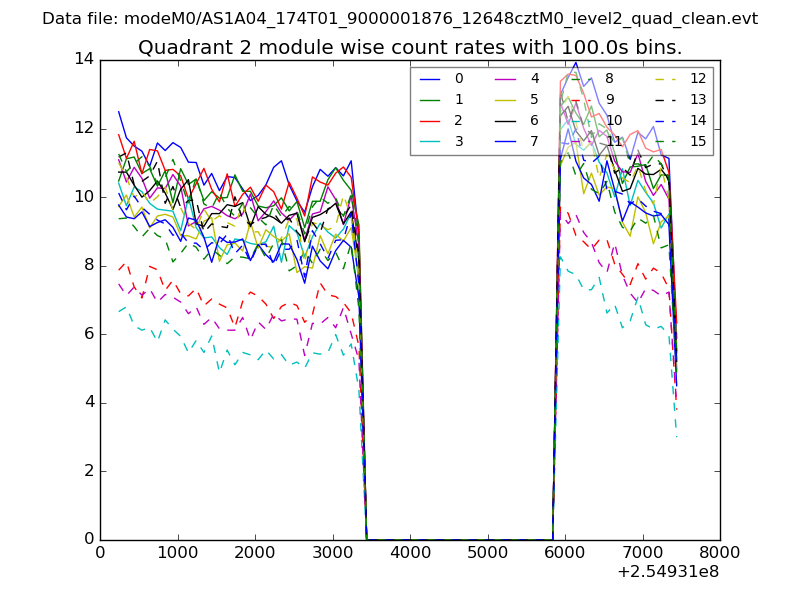
| Module-wise count rates for Quadrant B Data is divided into 100 sec bins |
 |
 |
| Module-wise count rates for Quadrant C Data is divided into 100 sec bins |
 |
 |
| Module-wise count rates for Quadrant D Data is divided into 100 sec bins |
 |
 |
| Parameter | Plot |
|---|---|
| CZT HV Monitor | 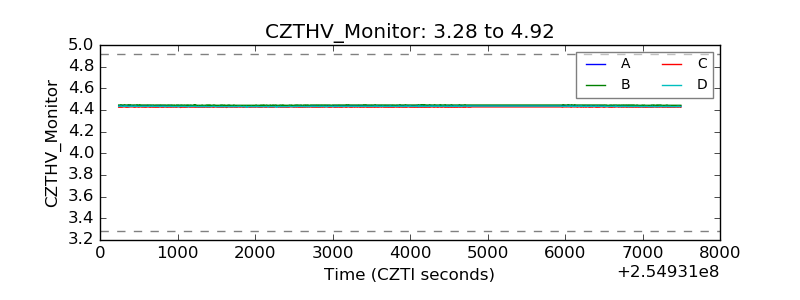 |
| D_VDD | 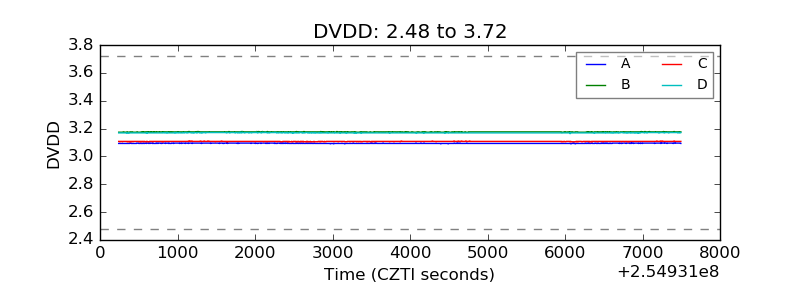 |
| Temperature 1 | 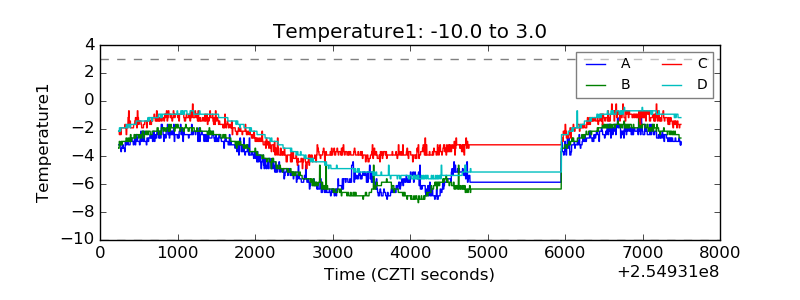 |
| Veto HV Monitor | 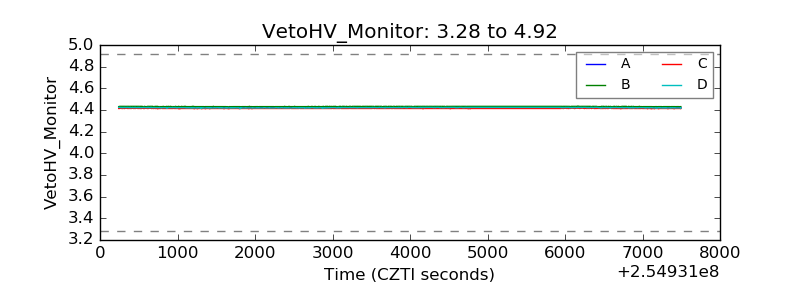 |
| Veto LLD | 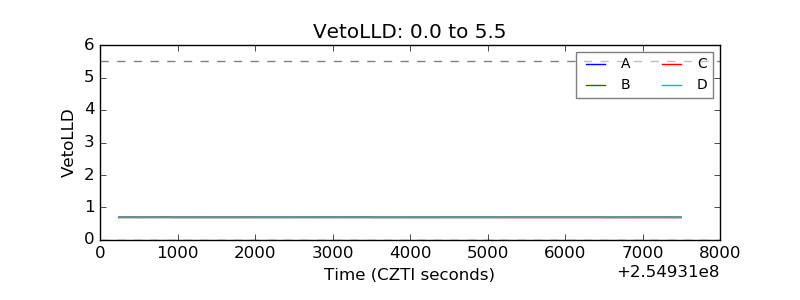 |
| Alpha Counter | 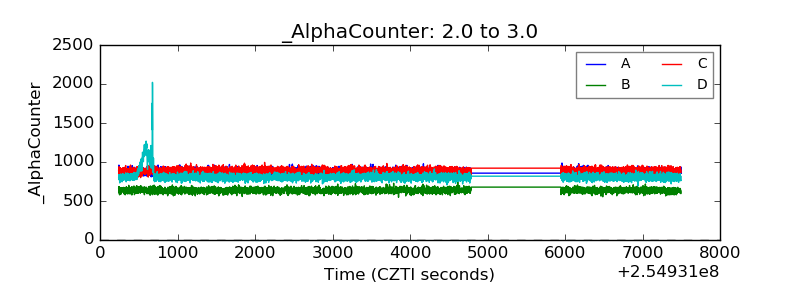 |
| _CPM_Rate | 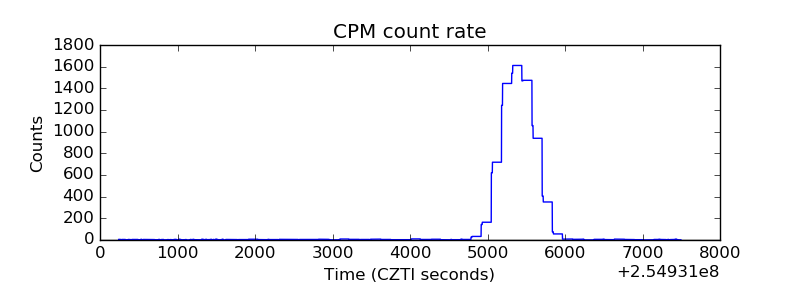 |
| CZT Counter | 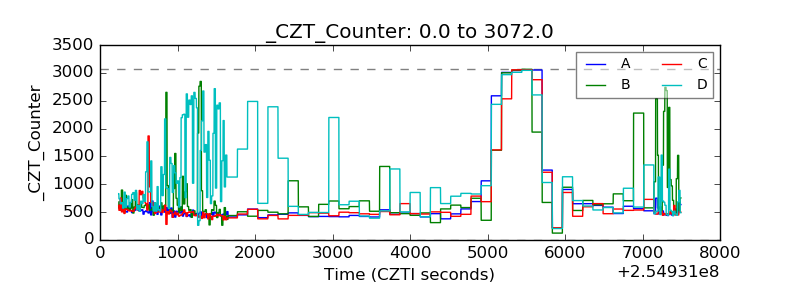 |
| +2.5 Volts monitor |  |
| +5 Volts monitor |  |
| _ROLL_ROT | 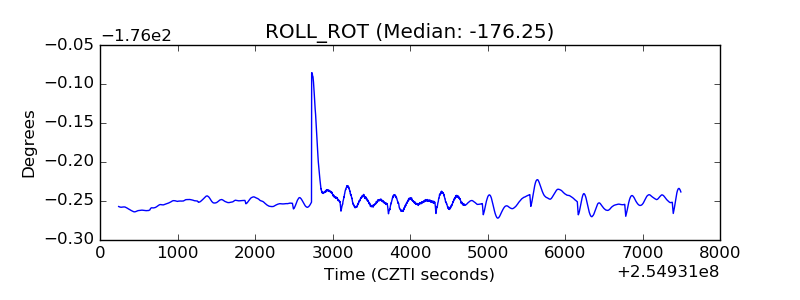 |
| _Roll_DEC | 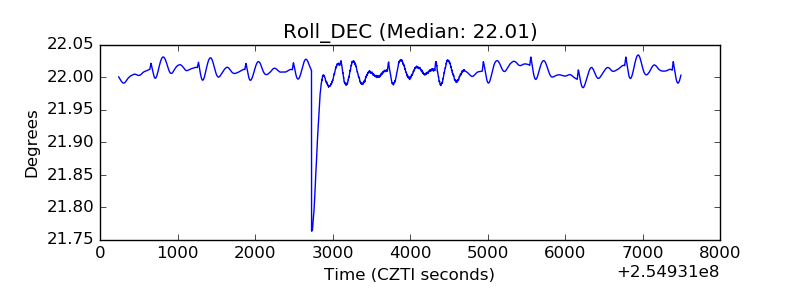 |
| _Roll_RA | 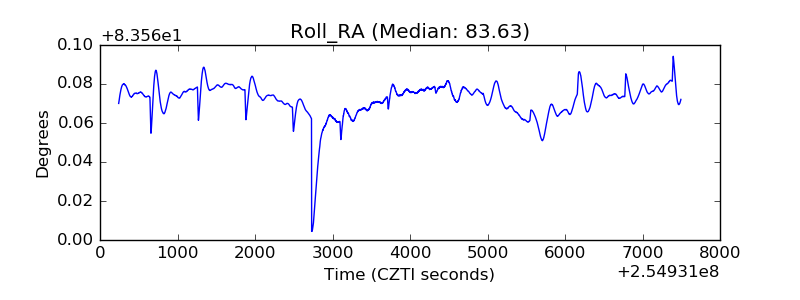 |
| Veto Counter | 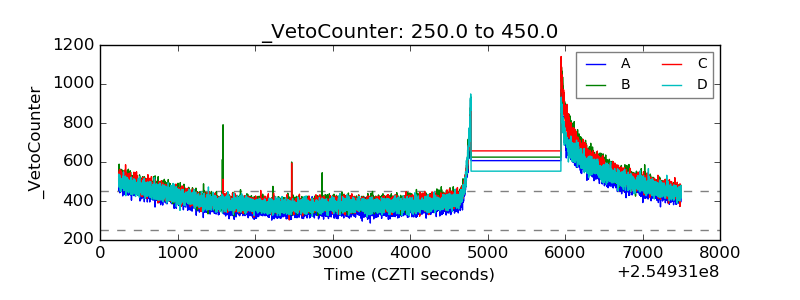 |