| Param | Original file | Final file |
|---|---|---|
| Filename | modeM0/AS1A04_174T01_9000001876_12649cztM0_level2.evt | modeM0/AS1A04_174T01_9000001876_12649cztM0_level2_quad_clean.evt |
| Size (bytes) | 516,061,440 | 96,215,040 |
| Size | 492.2 MB | 91.8 MB |
| Events in quadrant A | 3,038,337 | 663,975 |
| Events in quadrant B | 5,198,467 | 591,071 |
| Events in quadrant C | 2,884,595 | 652,985 |
| Events in quadrant D | 4,110,312 | 596,149 |
| Mode M9 | |||
|---|---|---|---|
| Quadrant | BADHDUFLAG | Total packets | Discarded packets |
| A | 0 | 13 | 0 |
| B | 0 | 13 | 0 |
| C | 0 | 13 | 0 |
| D | 0 | 13 | 0 |
| Mode M0 | |||
|---|---|---|---|
| Quadrant | BADHDUFLAG | Total packets | Discarded packets |
| A | 0 | 12825 | 2 |
| B | 0 | 19293 | 1 |
| C | 0 | 12243 | 1 |
| D | 0 | 16047 | 1 |
| Mode SS | |||
|---|---|---|---|
| Quadrant | BADHDUFLAG | Total packets | Discarded packets |
| A | 0 | 120 | 0 |
| B | 0 | 120 | 0 |
| C | 0 | 120 | 0 |
| D | 0 | 120 | 0 |
| Quadrant | Total seconds | Saturated seconds | Saturation percentage |
|---|---|---|---|
| A | 5852 | 60 | 1.025290% |
| B | 5852 | 817 | 13.961039% |
| C | 5852 | 44 | 0.751880% |
| D | 5852 | 405 | 6.920711% |
Noise dominated data is calculated using 1-second bins in cleaned event files. If a bin has >2000 counts, and if more than 50% of those come from <1% of pixels, then it is considered to be noise-dominated and hence unusable.
| Quadrant | # 1 sec bins | Bins with >0 counts | Bins with >2000 counts | High rate bins dominated by noise | Noise dominated (total time) | Noise dominated (detector-on time) | Marked lightcurve |
|---|---|---|---|---|---|---|---|
| A | 7123 | 5853 | 0 | 0 | 0.00% | 0.00% | 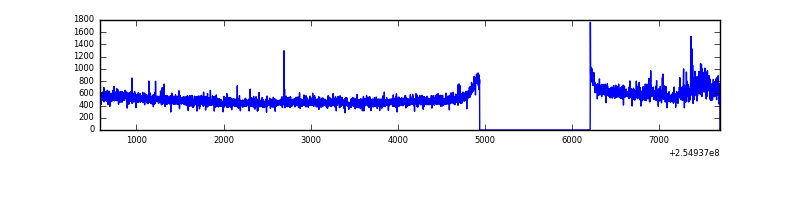 |
| B | 7123 | 5853 | 690 | 690 | 9.69% | 11.79% | 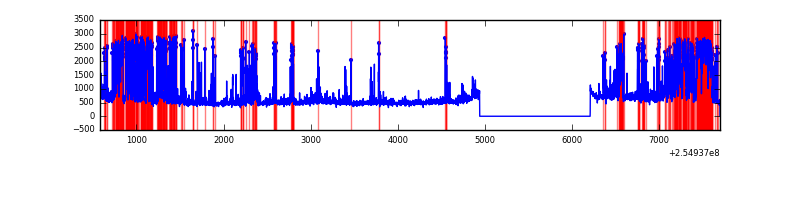 |
| C | 7123 | 5853 | 11 | 11 | 0.15% | 0.19% | 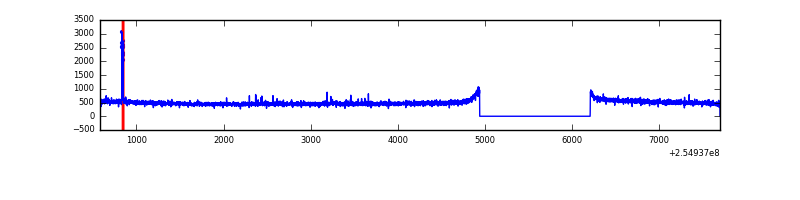 |
| D | 7122 | 5852 | 308 | 308 | 4.32% | 5.26% | 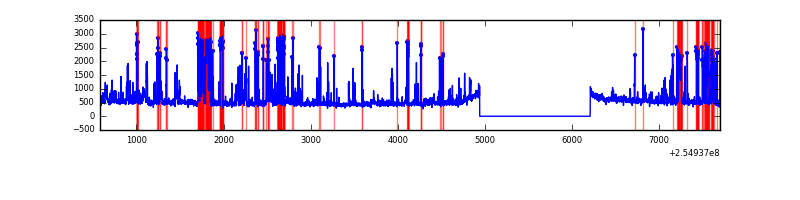 |
Top three noisy pixels from each quadrant. If the there are fewer than three noisy pixels in the level2.evt file, extra rows are filled as -1
| Pixel properties | Quadrant properties | ||||||
|---|---|---|---|---|---|---|---|
| Quadrant | DetID | PixID | Counts | Sigma | Mean | Median | Sigma |
| A | 8 | 15 | 77114 | 500.51 | 754 | 742 | 152.6 |
| A | 0 | 23 | 48937 | 315.85 | 754 | 742 | 152.6 |
| A | 0 | 226 | 9858 | 59.74 | 754 | 742 | 152.6 |
| B | 4 | 239 | 2171755 | 16594.15 | 698 | 684 | 130.8 |
| B | 3 | 64 | 87901 | 666.63 | 698 | 684 | 130.8 |
| B | 11 | 51 | 85655 | 649.46 | 698 | 684 | 130.8 |
| C | 15 | 208 | 49562 | 292.06 | 727 | 733 | 167.2 |
| C | 13 | 61 | 5315 | 27.41 | 727 | 733 | 167.2 |
| C | 8 | 222 | 1906 | 7.02 | 727 | 733 | 167.2 |
| D | 1 | 52 | 1178924 | 6963.25 | 707 | 690 | 169.2 |
| D | 10 | 157 | 156063 | 918.24 | 707 | 690 | 169.2 |
| D | 13 | 249 | 30232 | 174.59 | 707 | 690 | 169.2 |
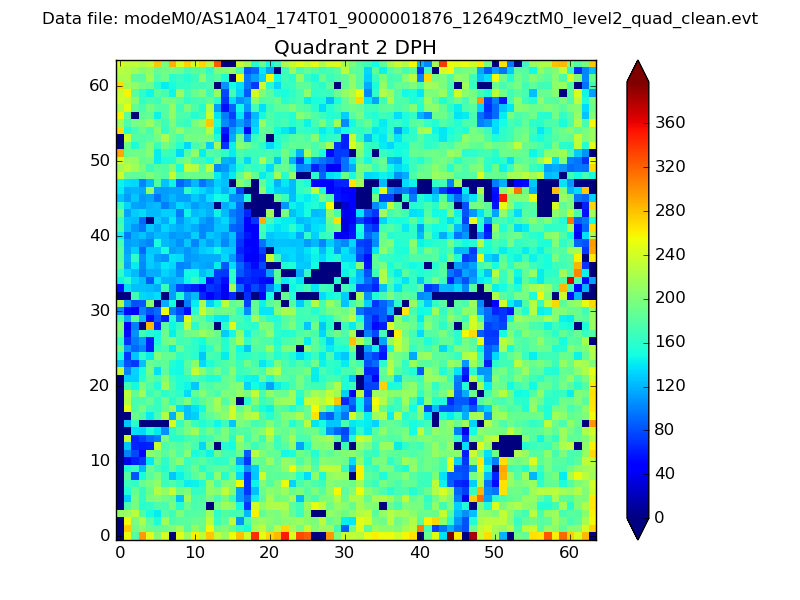
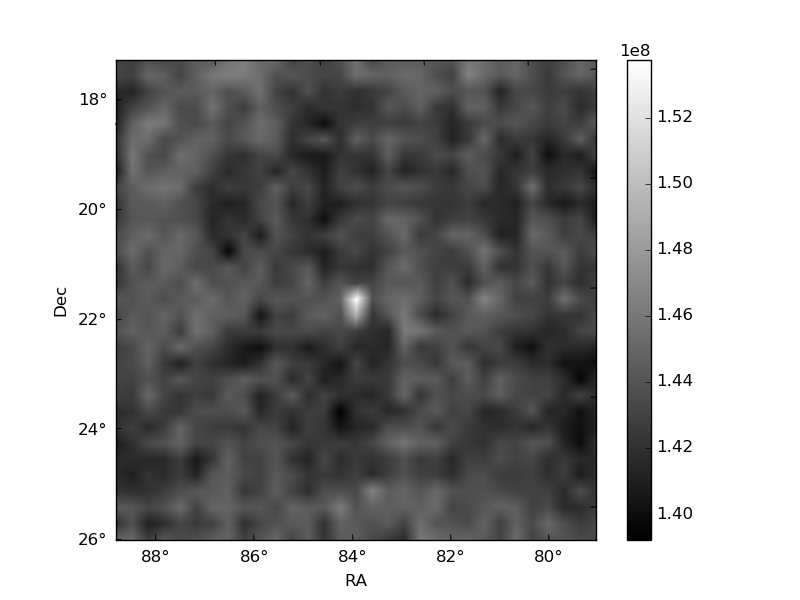
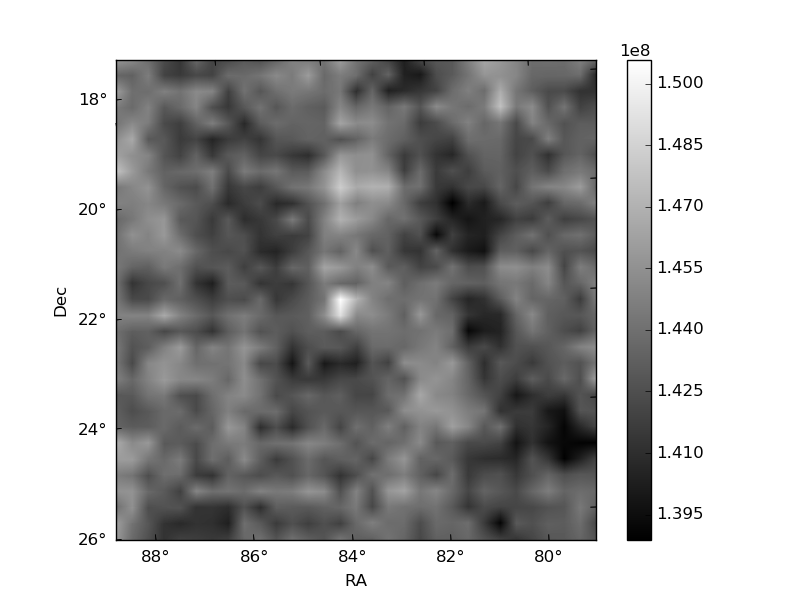
Histogram calculated using DETX and DETY for each event in the final _common_clean file
| Quadrant A | 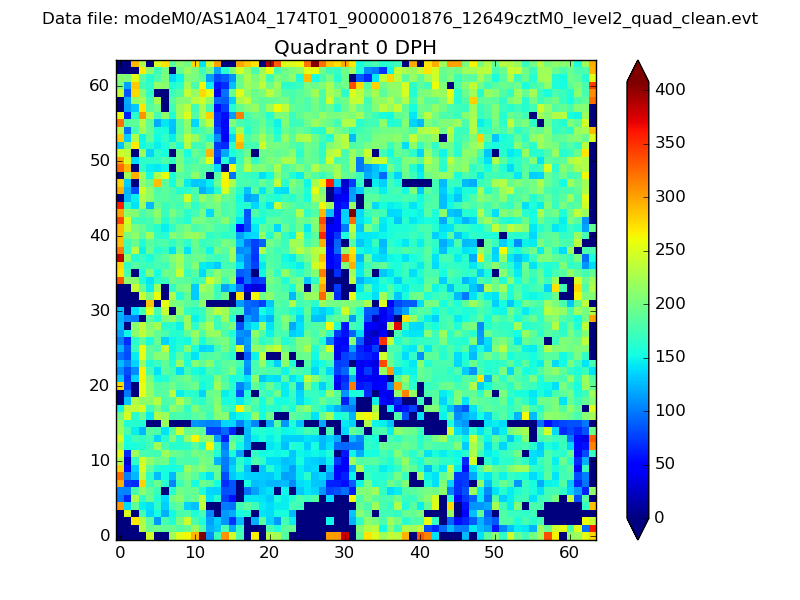 |
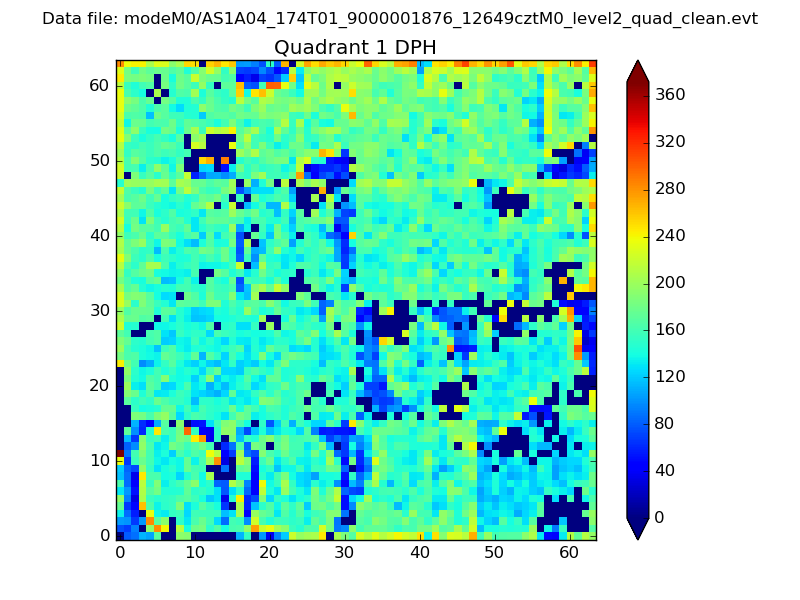 |
Quadrant B |
|---|---|---|---|
| Quadrant D | 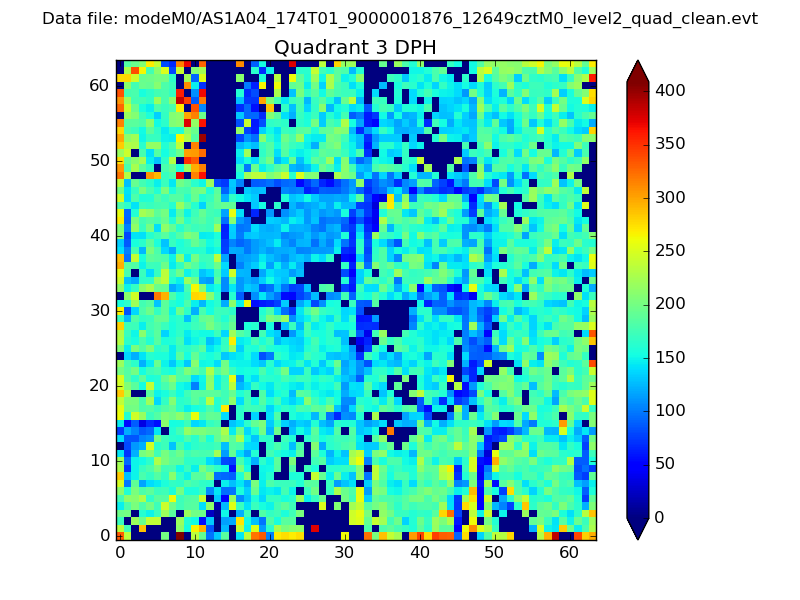 |
 |
Quadrant C |
| Plot type | Count rate plots | Images |
|---|---|---|
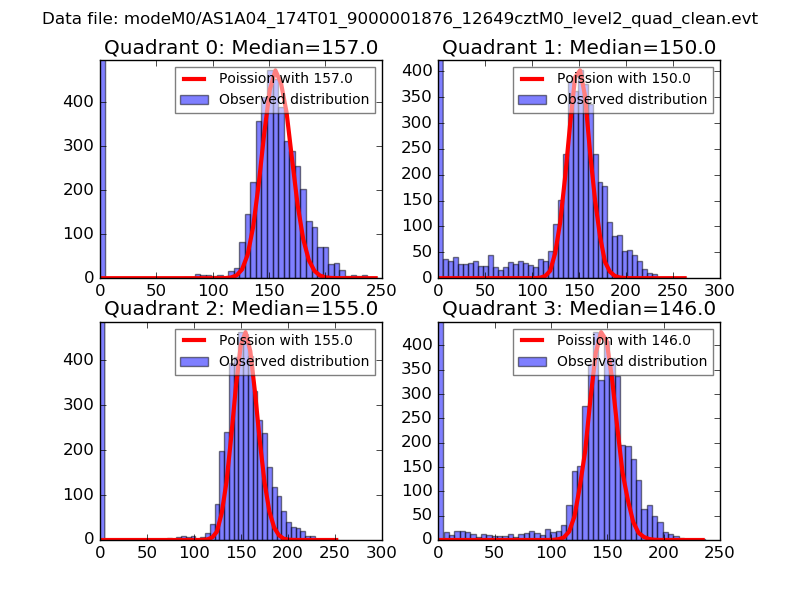
| Comparison with Poisson distribution Blue bars denote a histogram of data divided into 1 sec bins. Red curve is a Poisson curve with rate = median count rate of data. |
 |
 |
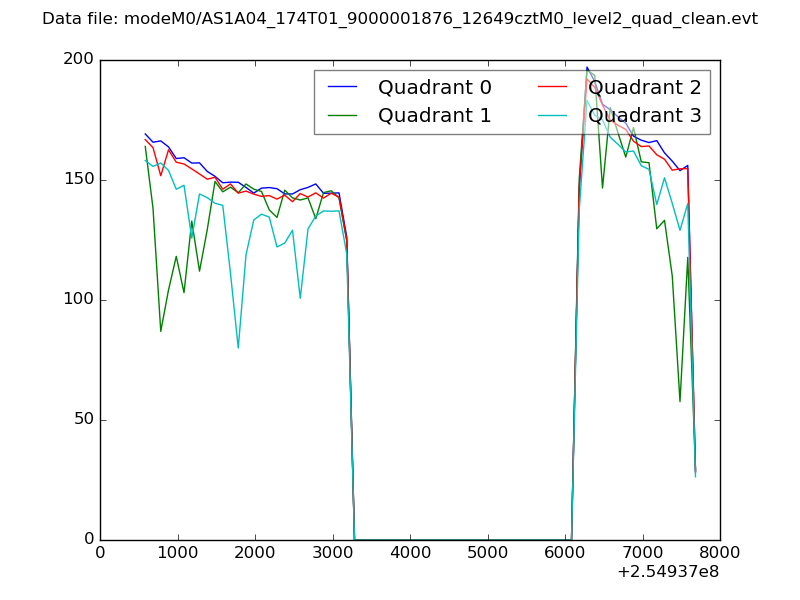
| Quadrant-wise count rates Data is divided into 100 sec bins |
 |
|
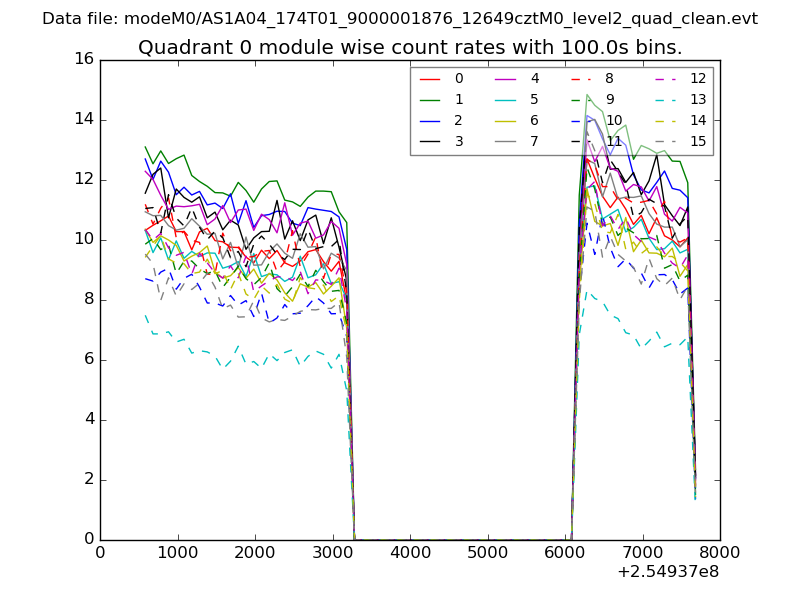
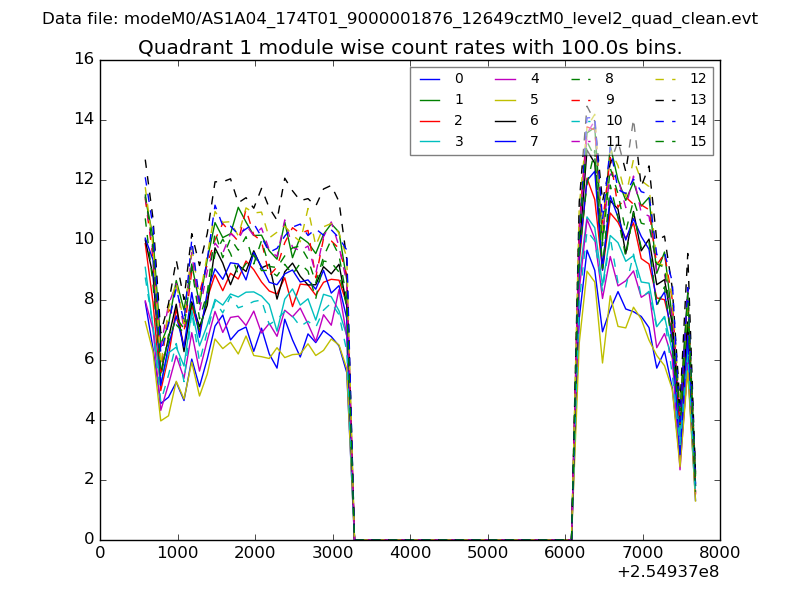
| Module-wise count rates for Quadrant A Data is divided into 100 sec bins |
 |
 |
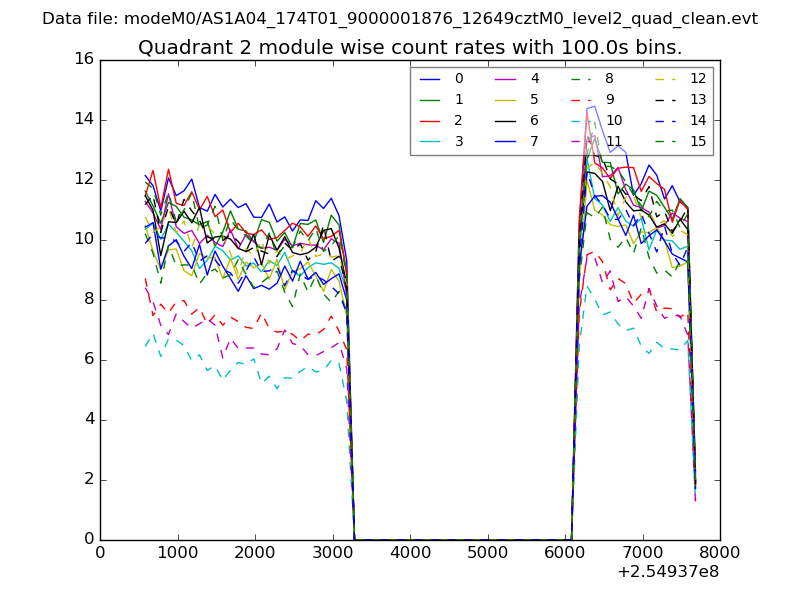
| Module-wise count rates for Quadrant B Data is divided into 100 sec bins |
 |
 |
| Module-wise count rates for Quadrant C Data is divided into 100 sec bins |
 |
 |
| Module-wise count rates for Quadrant D Data is divided into 100 sec bins |
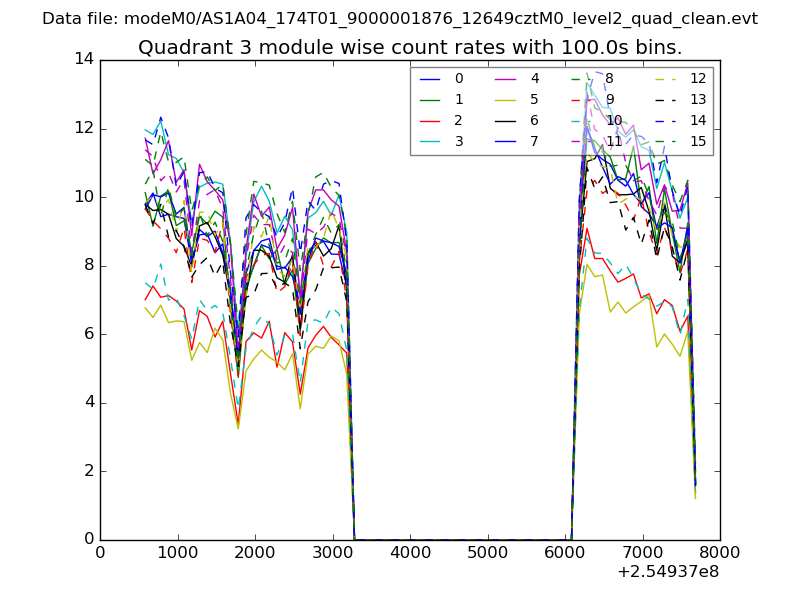 |
 |
| Parameter | Plot |
|---|---|
| CZT HV Monitor | 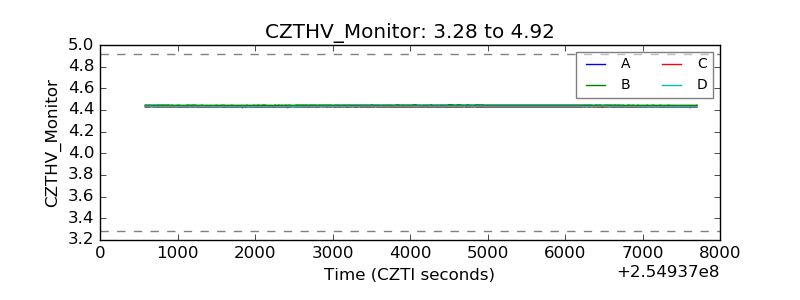 |
| D_VDD | 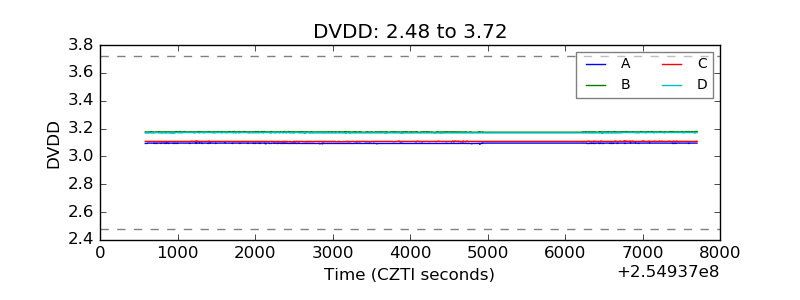 |
| Temperature 1 | 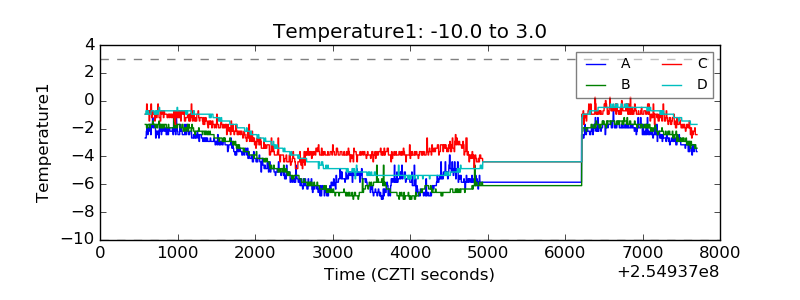 |
| Veto HV Monitor | 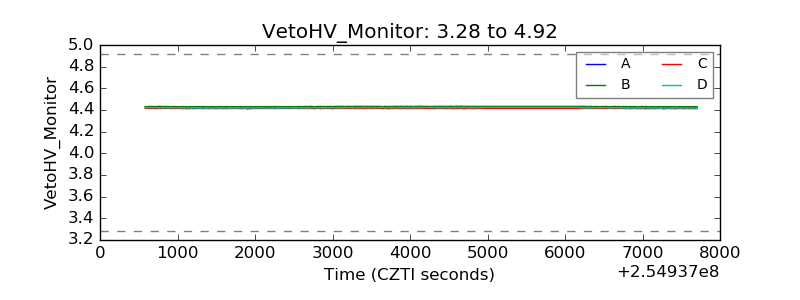 |
| Veto LLD | 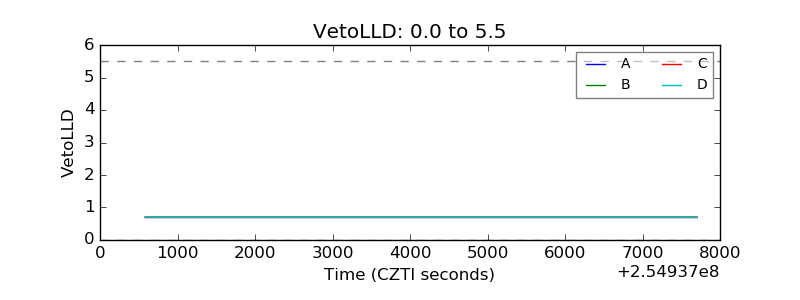 |
| Alpha Counter | 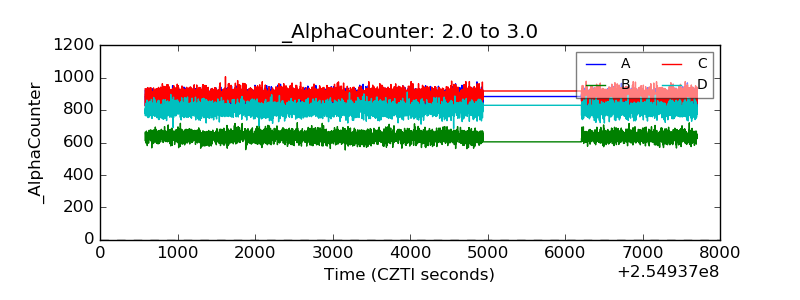 |
| _CPM_Rate | 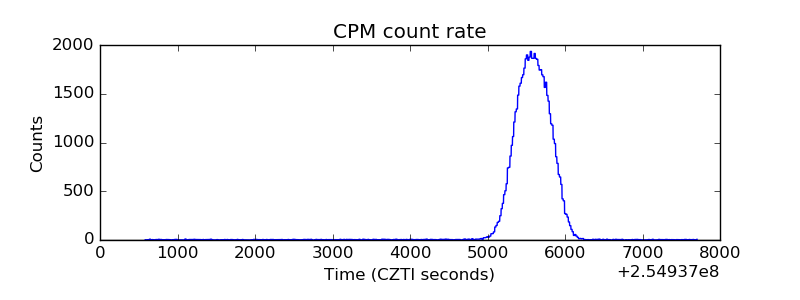 |
| CZT Counter | 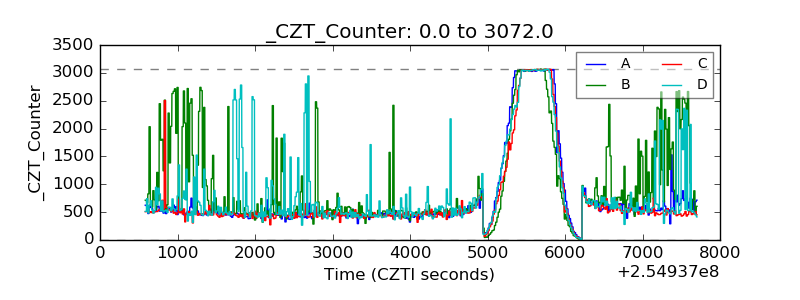 |
| +2.5 Volts monitor |  |
| +5 Volts monitor |  |
| _ROLL_ROT | 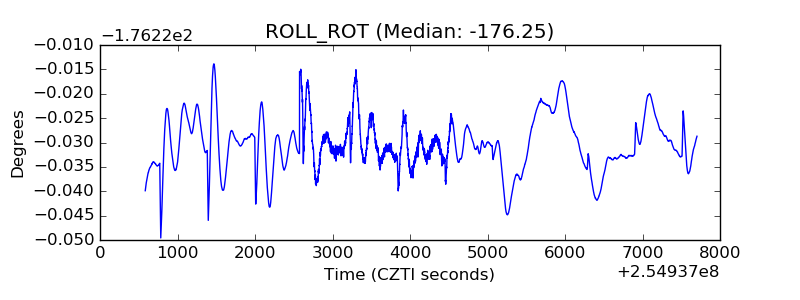 |
| _Roll_DEC | 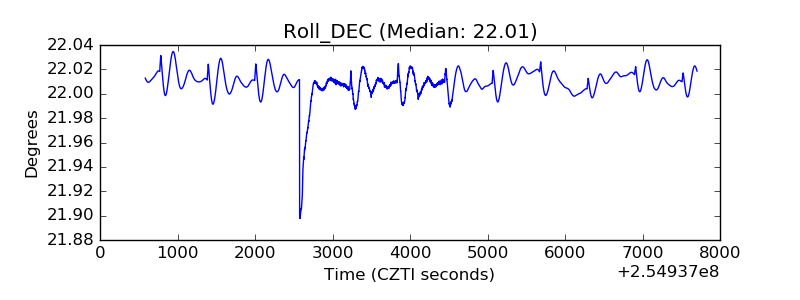 |
| _Roll_RA | 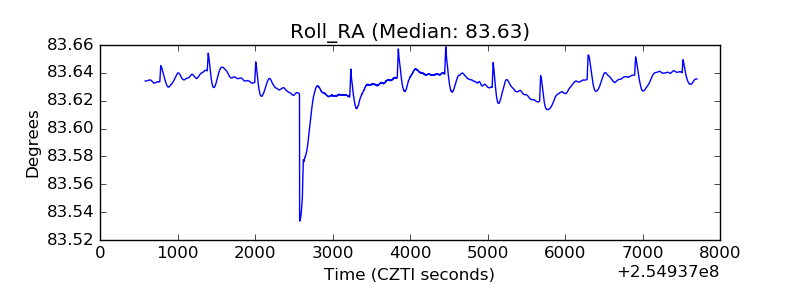 |
| Veto Counter | 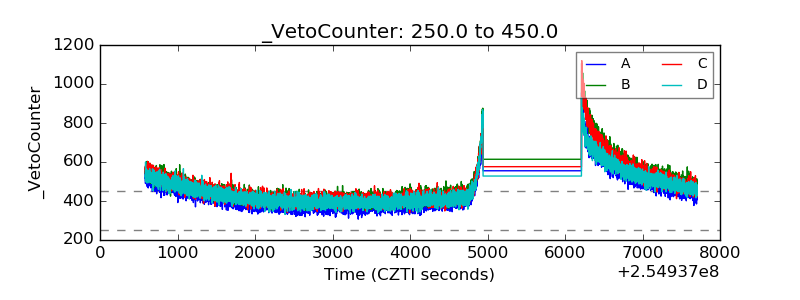 |