| Param | Original file | Final file |
|---|---|---|
| Filename | modeM0/AS1A04_174T01_9000001876_12653cztM0_level2.evt | modeM0/AS1A04_174T01_9000001876_12653cztM0_level2_quad_clean.evt |
| Size (bytes) | 542,505,600 | 98,297,280 |
| Size | 517.4 MB | 93.7 MB |
| Events in quadrant A | 3,197,661 | 645,253 |
| Events in quadrant B | 4,034,097 | 639,006 |
| Events in quadrant C | 3,169,046 | 644,926 |
| Events in quadrant D | 5,567,973 | 573,581 |
| Mode M9 | |||
|---|---|---|---|
| Quadrant | BADHDUFLAG | Total packets | Discarded packets |
| A | 0 | 18 | 0 |
| B | 0 | 18 | 0 |
| C | 0 | 18 | 0 |
| D | 0 | 19 | 0 |
| Mode M0 | |||
|---|---|---|---|
| Quadrant | BADHDUFLAG | Total packets | Discarded packets |
| A | 0 | 14010 | 3 |
| B | 0 | 16339 | 2 |
| C | 0 | 13895 | 2 |
| D | 0 | 21234 | 2 |
| Mode SS | |||
|---|---|---|---|
| Quadrant | BADHDUFLAG | Total packets | Discarded packets |
| A | 0 | 138 | 0 |
| B | 0 | 138 | 0 |
| C | 0 | 138 | 0 |
| D | 0 | 138 | 0 |
| Quadrant | Total seconds | Saturated seconds | Saturation percentage |
|---|---|---|---|
| A | 6800 | 21 | 0.308824% |
| B | 6800 | 192 | 2.823529% |
| C | 6800 | 9 | 0.132353% |
| D | 6800 | 472 | 6.941176% |
Noise dominated data is calculated using 1-second bins in cleaned event files. If a bin has >2000 counts, and if more than 50% of those come from <1% of pixels, then it is considered to be noise-dominated and hence unusable.
| Quadrant | # 1 sec bins | Bins with >0 counts | Bins with >2000 counts | High rate bins dominated by noise | Noise dominated (total time) | Noise dominated (detector-on time) | Marked lightcurve |
|---|---|---|---|---|---|---|---|
| A | 7661 | 6802 | 3 | 3 | 0.04% | 0.04% | 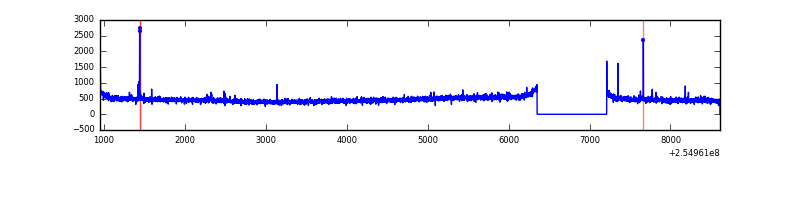 |
| B | 7661 | 6801 | 96 | 96 | 1.25% | 1.41% | 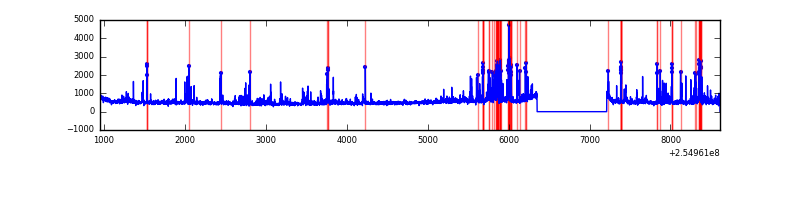 |
| C | 7661 | 6802 | 0 | 0 | 0.00% | 0.00% | 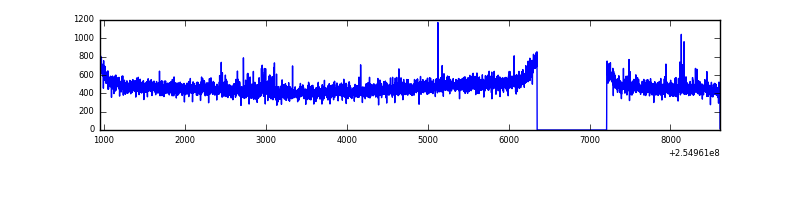 |
| D | 7661 | 6802 | 506 | 506 | 6.60% | 7.44% | 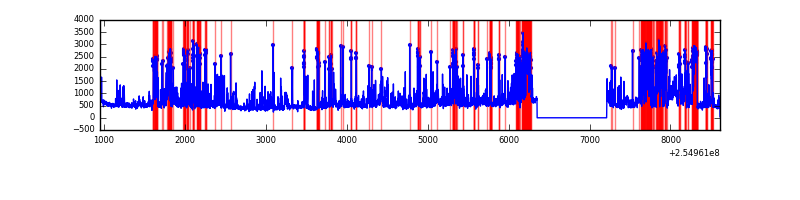 |
Top three noisy pixels from each quadrant. If the there are fewer than three noisy pixels in the level2.evt file, extra rows are filled as -1
| Pixel properties | Quadrant properties | ||||||
|---|---|---|---|---|---|---|---|
| Quadrant | DetID | PixID | Counts | Sigma | Mean | Median | Sigma |
| A | 9 | 143 | 20430 | 117.29 | 820 | 804 | 167.3 |
| A | 8 | 192 | 7945 | 42.67 | 820 | 804 | 167.3 |
| A | 12 | 189 | 7575 | 40.46 | 820 | 804 | 167.3 |
| B | 4 | 239 | 483733 | 3092.03 | 819 | 801 | 156.2 |
| B | 3 | 64 | 151968 | 967.87 | 819 | 801 | 156.2 |
| B | 11 | 51 | 74536 | 472.1 | 819 | 801 | 156.2 |
| C | 15 | 208 | 39420 | 207.59 | 802 | 811 | 186.0 |
| C | 13 | 61 | 5853 | 27.11 | 802 | 811 | 186.0 |
| C | 14 | 234 | 4080 | 17.58 | 802 | 811 | 186.0 |
| D | 1 | 52 | 2056546 | 10961.77 | 768 | 746 | 187.5 |
| D | 10 | 157 | 472025 | 2512.92 | 768 | 746 | 187.5 |
| D | 10 | 199 | 45878 | 240.65 | 768 | 746 | 187.5 |
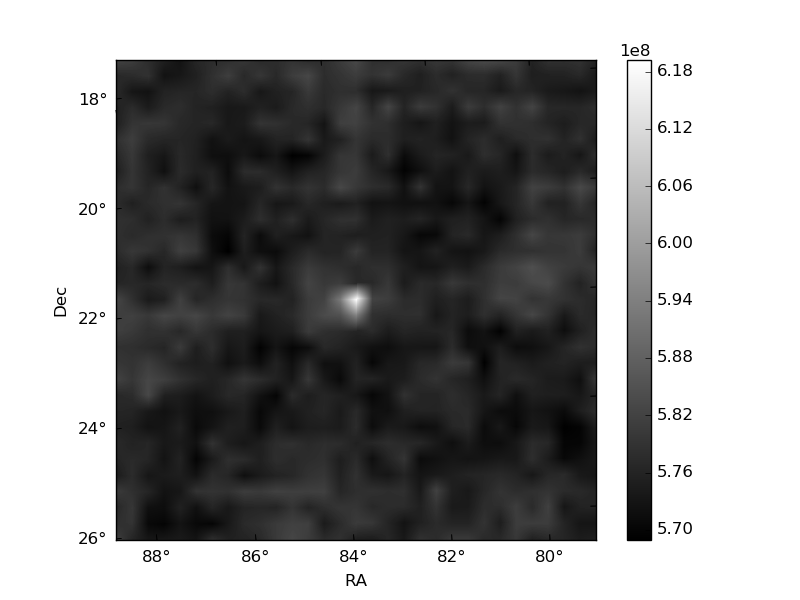
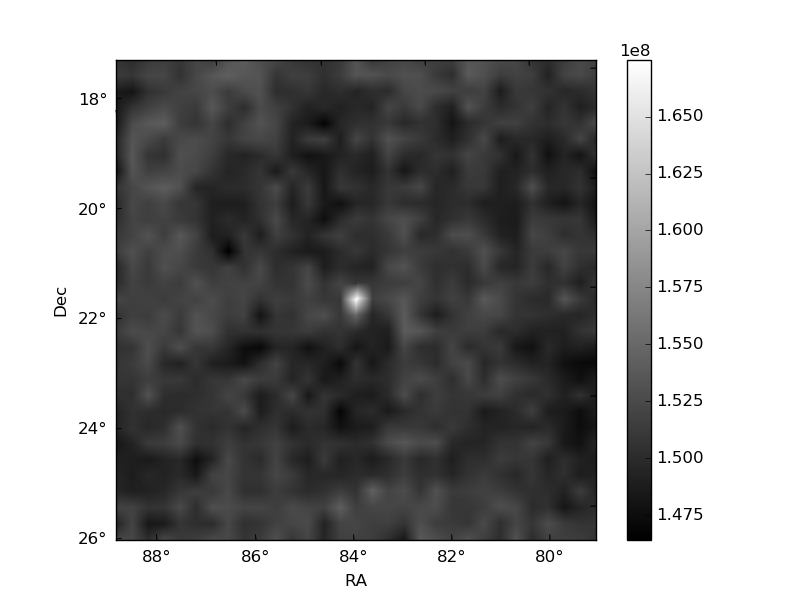
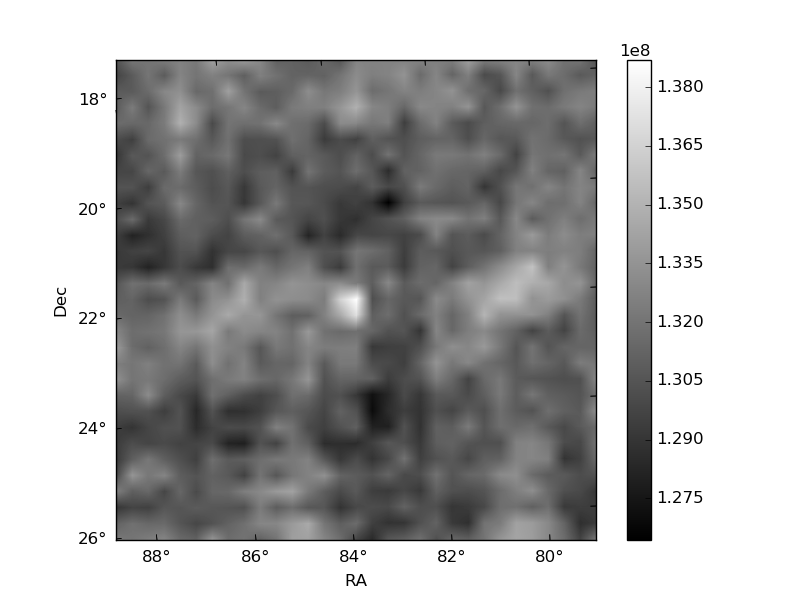
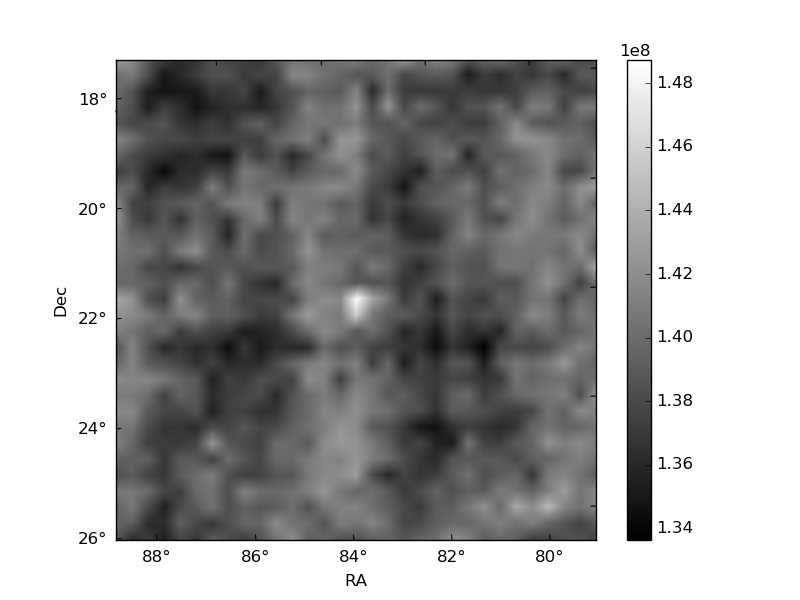
Histogram calculated using DETX and DETY for each event in the final _common_clean file
| Quadrant A | 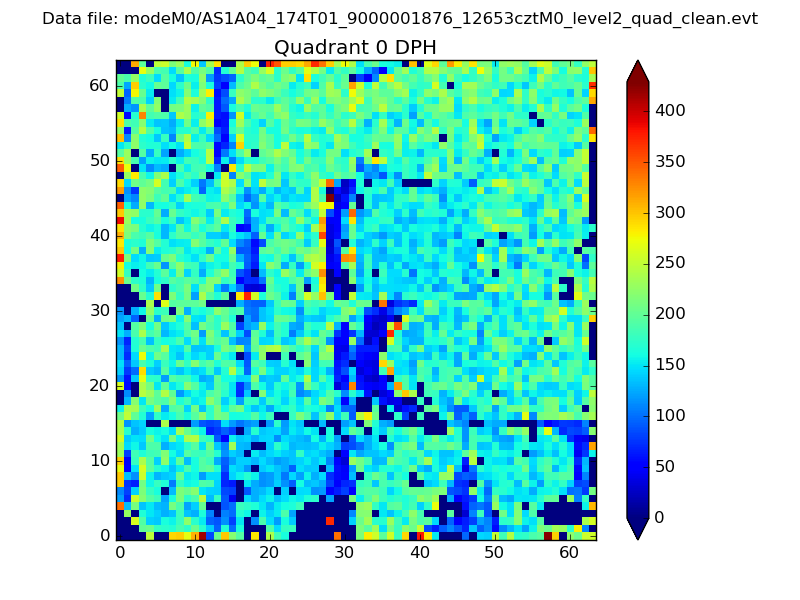 |
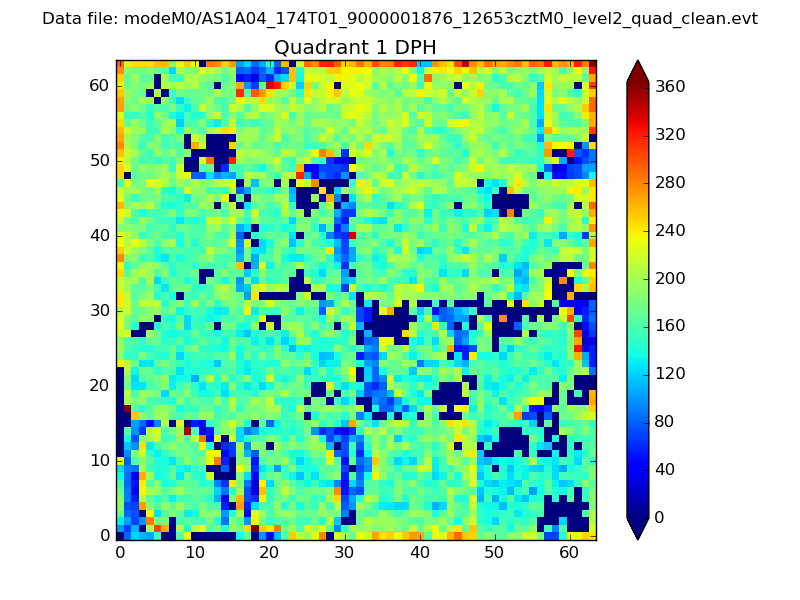 |
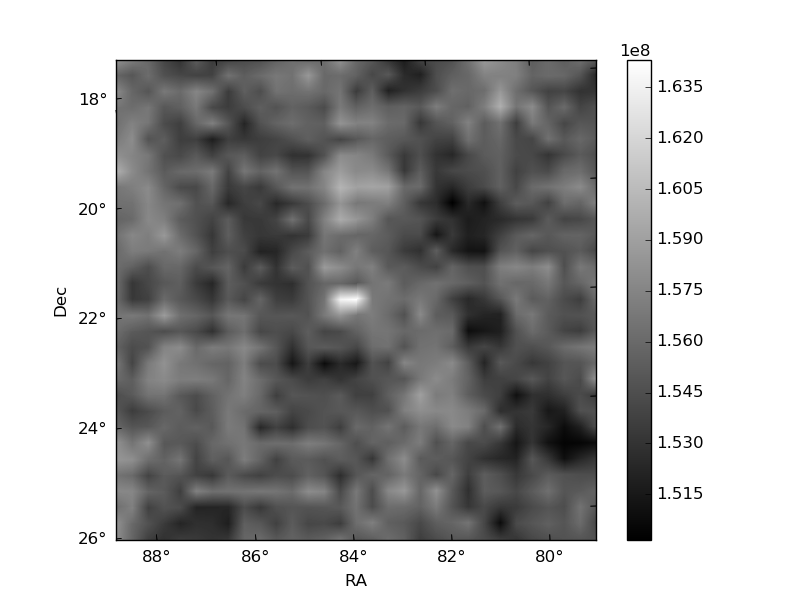
Quadrant B |
|---|---|---|---|
| Quadrant D | 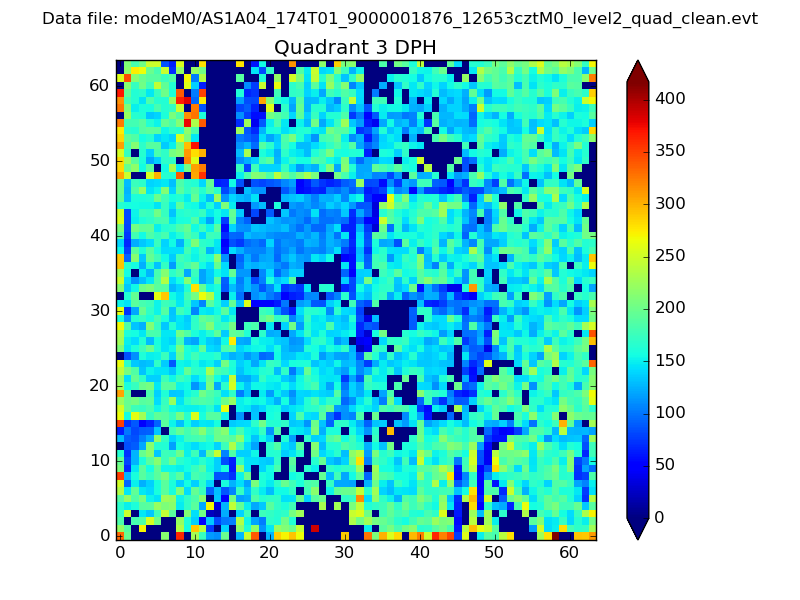 |
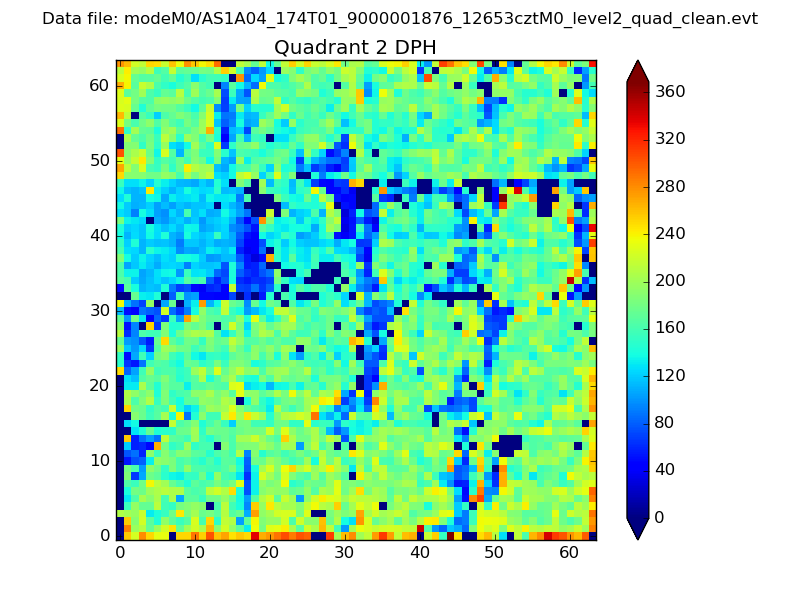 |
Quadrant C |
| Plot type | Count rate plots | Images |
|---|---|---|
| Comparison with Poisson distribution Blue bars denote a histogram of data divided into 1 sec bins. Red curve is a Poisson curve with rate = median count rate of data. |
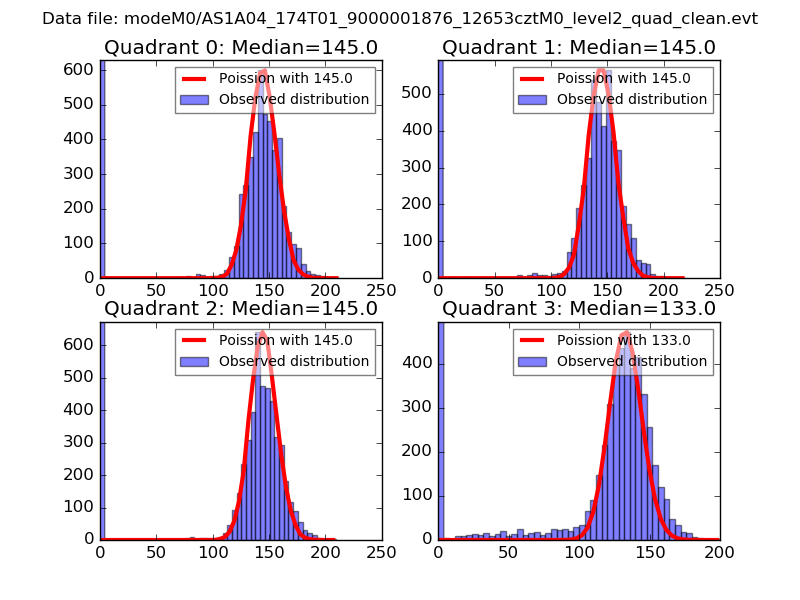 |
 |
| Quadrant-wise count rates Data is divided into 100 sec bins |
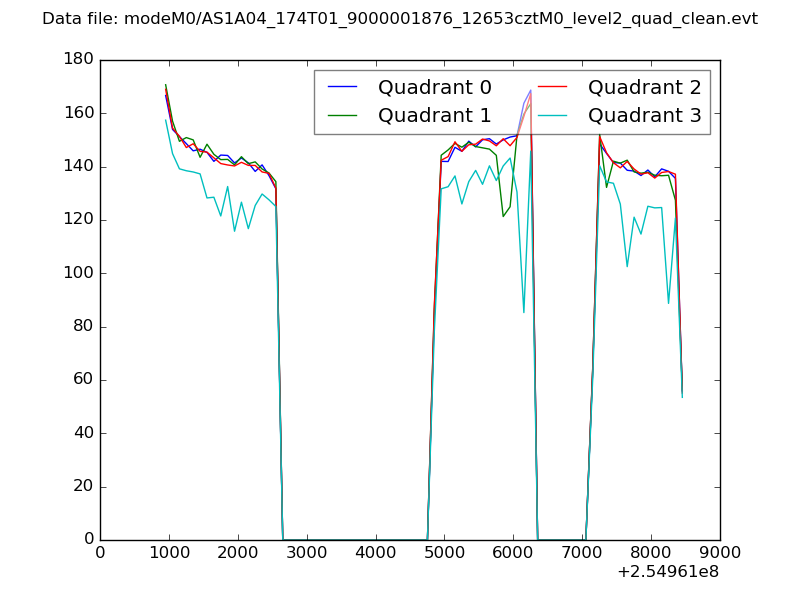 |
|
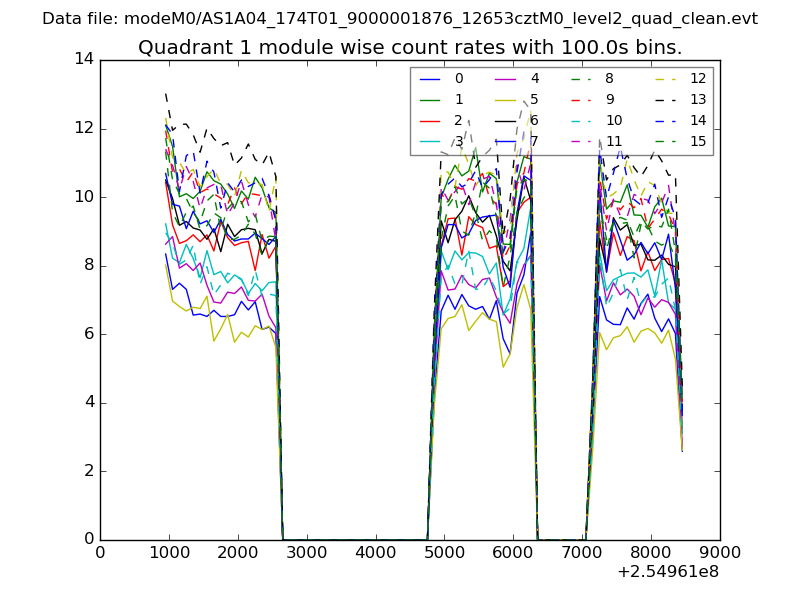
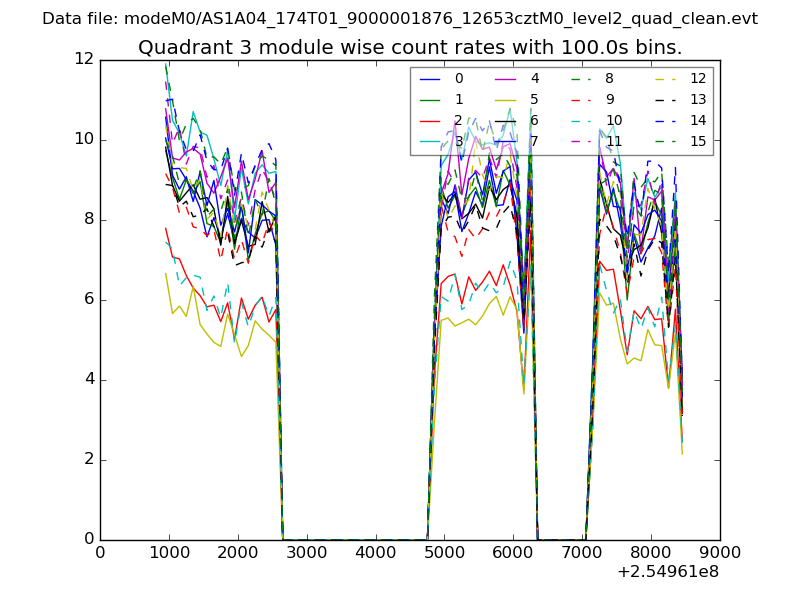
| Module-wise count rates for Quadrant A Data is divided into 100 sec bins |
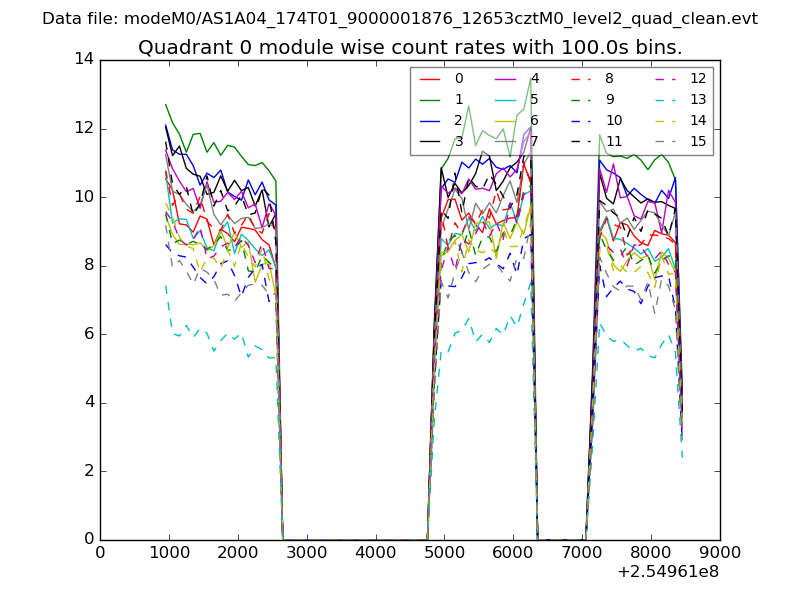 |
 |
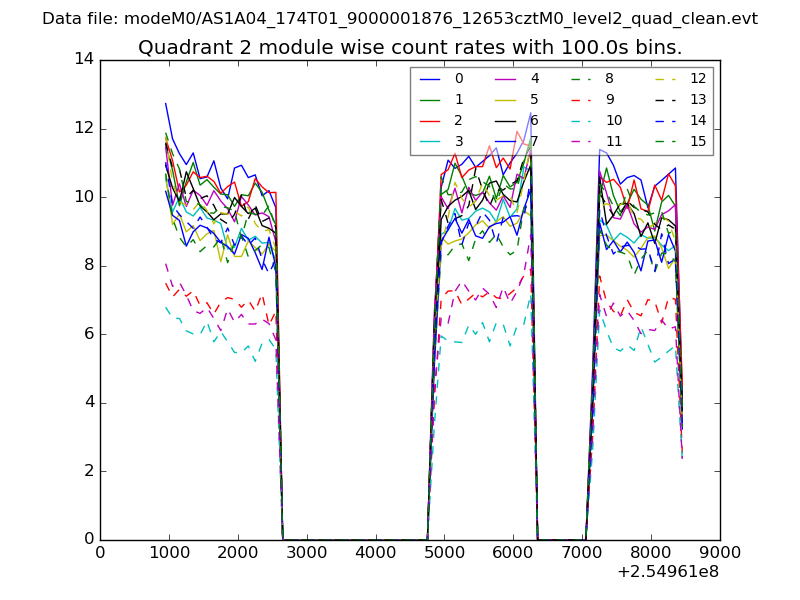
| Module-wise count rates for Quadrant B Data is divided into 100 sec bins |
 |
 |
| Module-wise count rates for Quadrant C Data is divided into 100 sec bins |
 |
 |
| Module-wise count rates for Quadrant D Data is divided into 100 sec bins |
 |
 |
| Parameter | Plot |
|---|---|
| CZT HV Monitor | 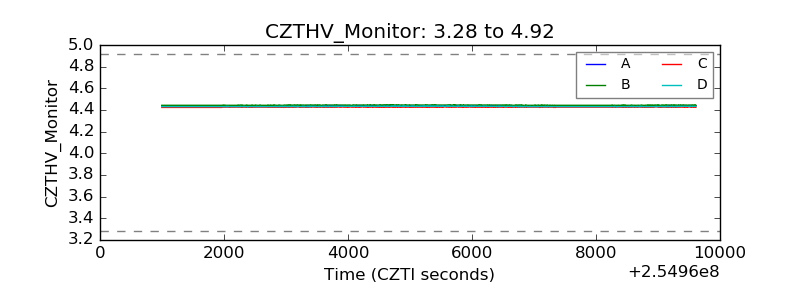 |
| D_VDD | 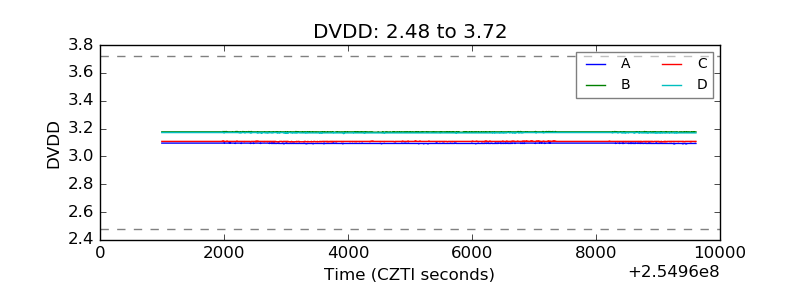 |
| Temperature 1 | 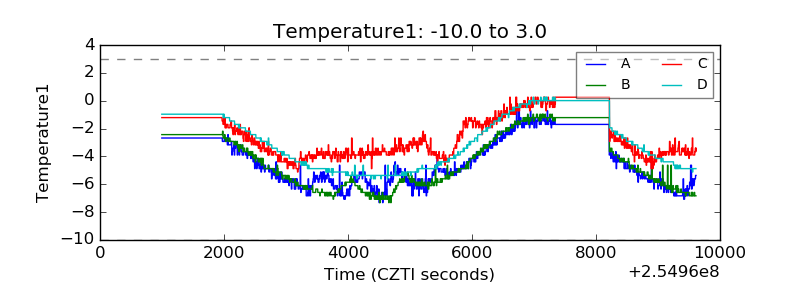 |
| Veto HV Monitor | 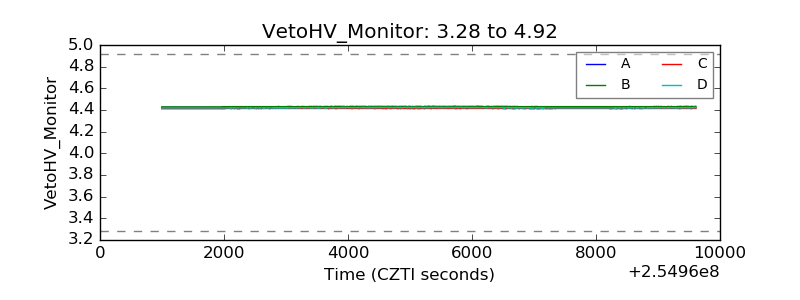 |
| Veto LLD | 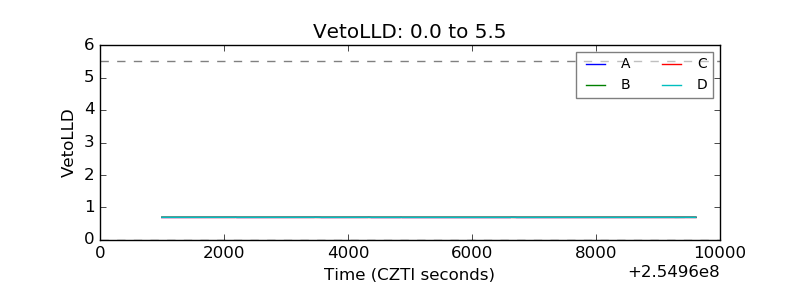 |
| Alpha Counter | 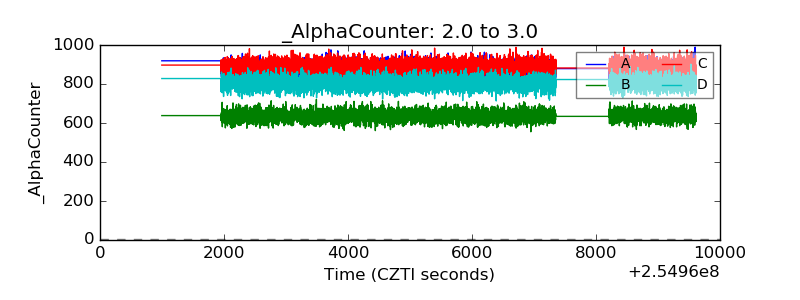 |
| _CPM_Rate | 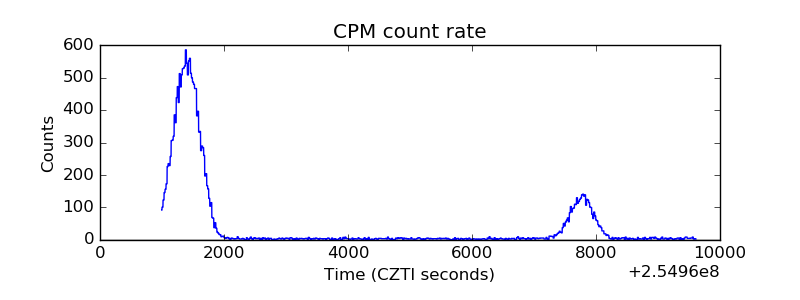 |
| CZT Counter | 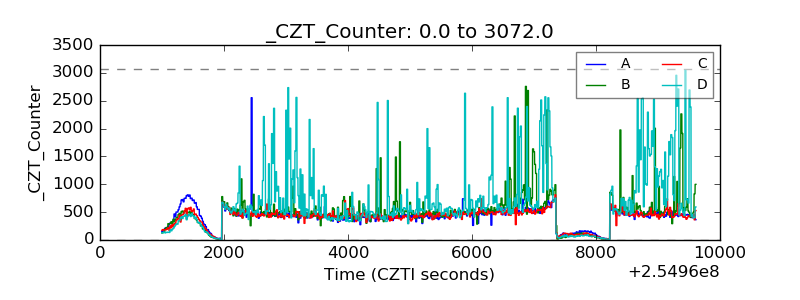 |
| +2.5 Volts monitor |  |
| +5 Volts monitor |  |
| _ROLL_ROT | 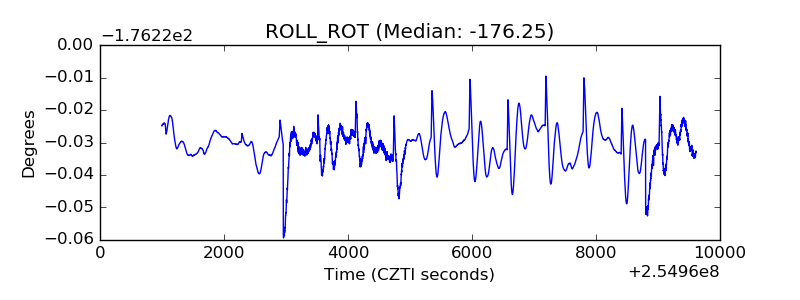 |
| _Roll_DEC | 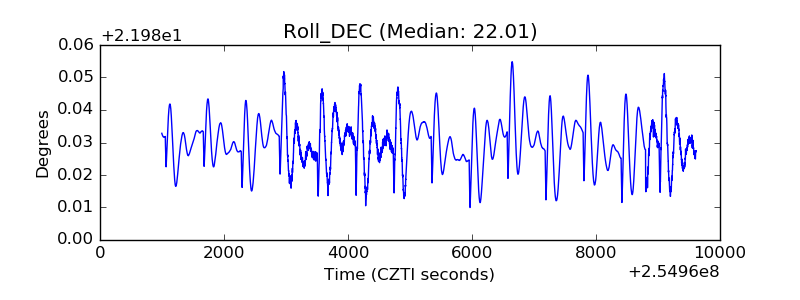 |
| _Roll_RA | 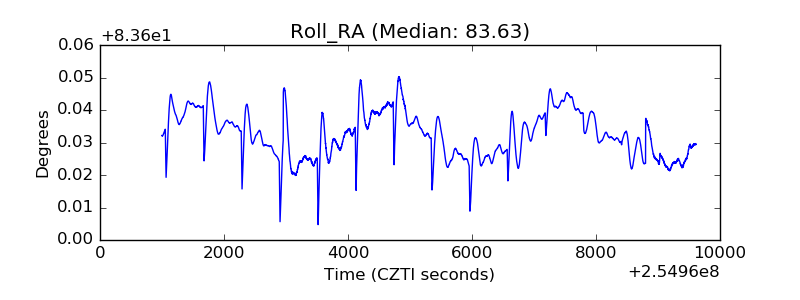 |
| Veto Counter | 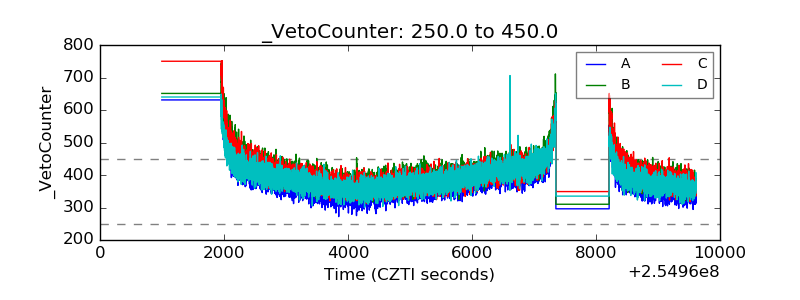 |