| Param | Original file | Final file |
|---|---|---|
| Filename | modeM0/AS1A04_174T01_9000001876_12654cztM0_level2.evt | modeM0/AS1A04_174T01_9000001876_12654cztM0_level2_quad_clean.evt |
| Size (bytes) | 576,394,560 | 86,676,480 |
| Size | 549.7 MB | 82.7 MB |
| Events in quadrant A | 3,124,286 | 558,250 |
| Events in quadrant B | 4,345,910 | 533,310 |
| Events in quadrant C | 3,176,978 | 556,425 |
| Events in quadrant D | 6,356,086 | 510,790 |
| Mode M9 | |||
|---|---|---|---|
| Quadrant | BADHDUFLAG | Total packets | Discarded packets |
| A | 0 | 5 | 0 |
| B | 0 | 5 | 0 |
| C | 0 | 5 | 0 |
| D | 0 | 5 | 0 |
| Mode M0 | |||
|---|---|---|---|
| Quadrant | BADHDUFLAG | Total packets | Discarded packets |
| A | 0 | 13782 | 2 |
| B | 0 | 17258 | 1 |
| C | 0 | 13984 | 1 |
| D | 0 | 23482 | 1 |
| Mode SS | |||
|---|---|---|---|
| Quadrant | BADHDUFLAG | Total packets | Discarded packets |
| A | 0 | 134 | 0 |
| B | 0 | 134 | 0 |
| C | 0 | 134 | 0 |
| D | 0 | 134 | 0 |
| Quadrant | Total seconds | Saturated seconds | Saturation percentage |
|---|---|---|---|
| A | 6687 | 49 | 0.732765% |
| B | 6687 | 417 | 6.235980% |
| C | 6687 | 27 | 0.403769% |
| D | 6687 | 761 | 11.380290% |
Noise dominated data is calculated using 1-second bins in cleaned event files. If a bin has >2000 counts, and if more than 50% of those come from <1% of pixels, then it is considered to be noise-dominated and hence unusable.
| Quadrant | # 1 sec bins | Bins with >0 counts | Bins with >2000 counts | High rate bins dominated by noise | Noise dominated (total time) | Noise dominated (detector-on time) | Marked lightcurve |
|---|---|---|---|---|---|---|---|
| A | 7128 | 6688 | 3 | 3 | 0.04% | 0.04% | 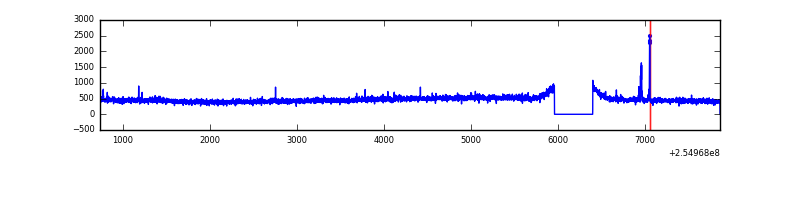 |
| B | 7128 | 6688 | 303 | 303 | 4.25% | 4.53% | 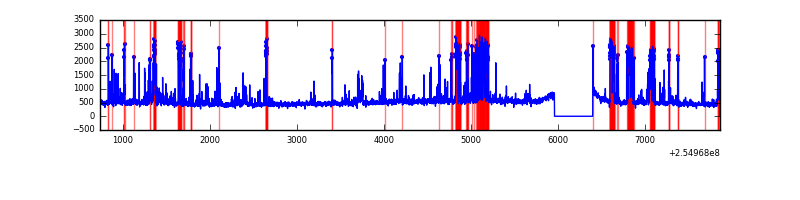 |
| C | 7128 | 6688 | 3 | 3 | 0.04% | 0.04% |  |
| D | 7128 | 6689 | 788 | 788 | 11.05% | 11.78% | 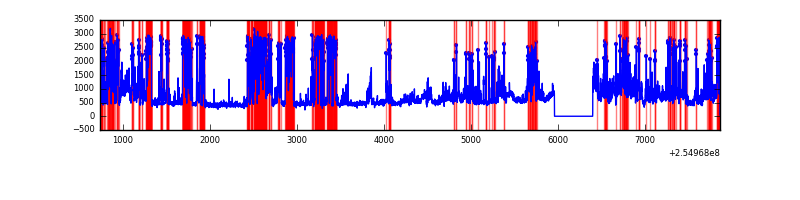 |
Top three noisy pixels from each quadrant. If the there are fewer than three noisy pixels in the level2.evt file, extra rows are filled as -1
| Pixel properties | Quadrant properties | ||||||
|---|---|---|---|---|---|---|---|
| Quadrant | DetID | PixID | Counts | Sigma | Mean | Median | Sigma |
| A | 12 | 189 | 18417 | 108.16 | 798 | 782 | 163.0 |
| A | 9 | 143 | 16446 | 96.07 | 798 | 782 | 163.0 |
| A | 13 | 248 | 16312 | 95.25 | 798 | 782 | 163.0 |
| B | 4 | 239 | 995677 | 6574.88 | 780 | 763 | 151.3 |
| B | 3 | 64 | 207417 | 1365.67 | 780 | 763 | 151.3 |
| B | 3 | 209 | 38669 | 250.5 | 780 | 763 | 151.3 |
| C | 15 | 208 | 124210 | 675.79 | 781 | 789 | 182.6 |
| C | 12 | 2 | 6546 | 31.52 | 781 | 789 | 182.6 |
| C | 13 | 61 | 5736 | 27.08 | 781 | 789 | 182.6 |
| D | 1 | 52 | 2793604 | 15629.29 | 737 | 716 | 178.7 |
| D | 10 | 157 | 675513 | 3776.23 | 737 | 716 | 178.7 |
| D | 13 | 249 | 54597 | 301.52 | 737 | 716 | 178.7 |
Histogram calculated using DETX and DETY for each event in the final _common_clean file
| Quadrant A | 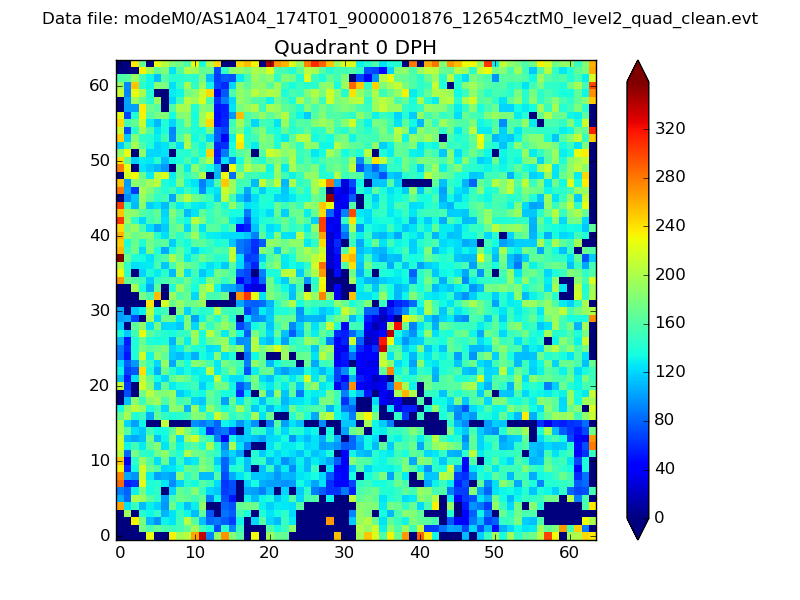 |
 |
Quadrant B |
|---|---|---|---|
| Quadrant D | 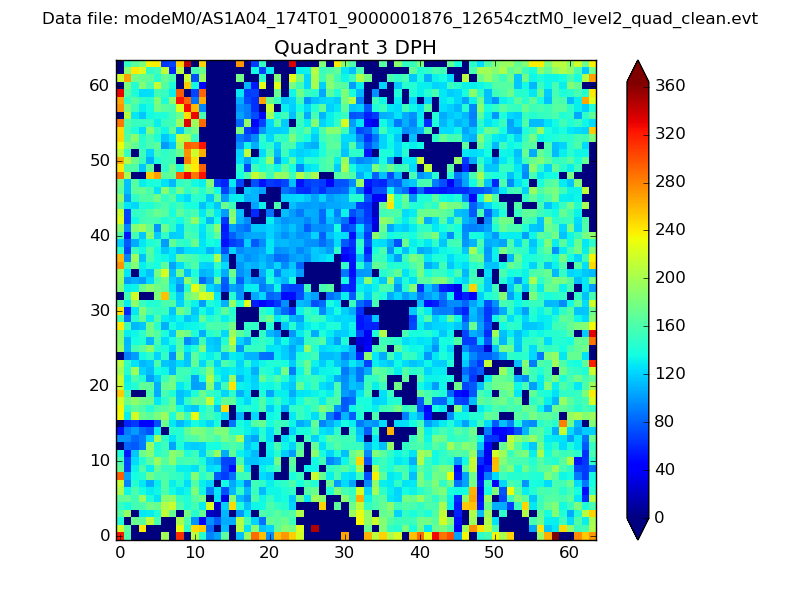 |
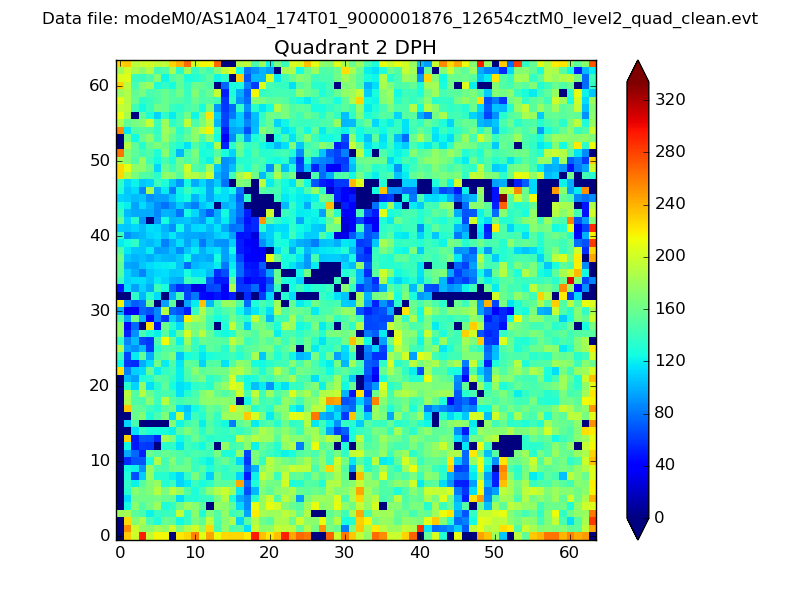 |
Quadrant C |
| Plot type | Count rate plots | Images |
|---|---|---|
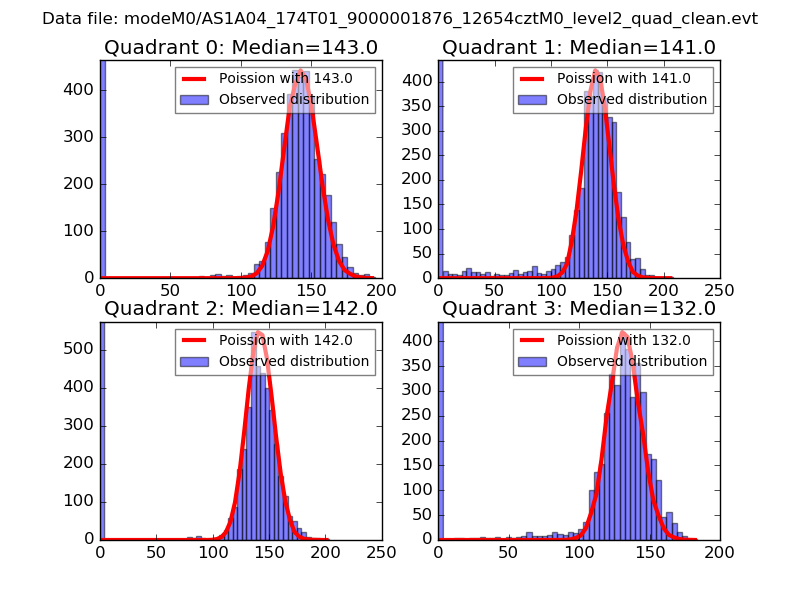
| Comparison with Poisson distribution Blue bars denote a histogram of data divided into 1 sec bins. Red curve is a Poisson curve with rate = median count rate of data. |
 |
 |
| Quadrant-wise count rates Data is divided into 100 sec bins |
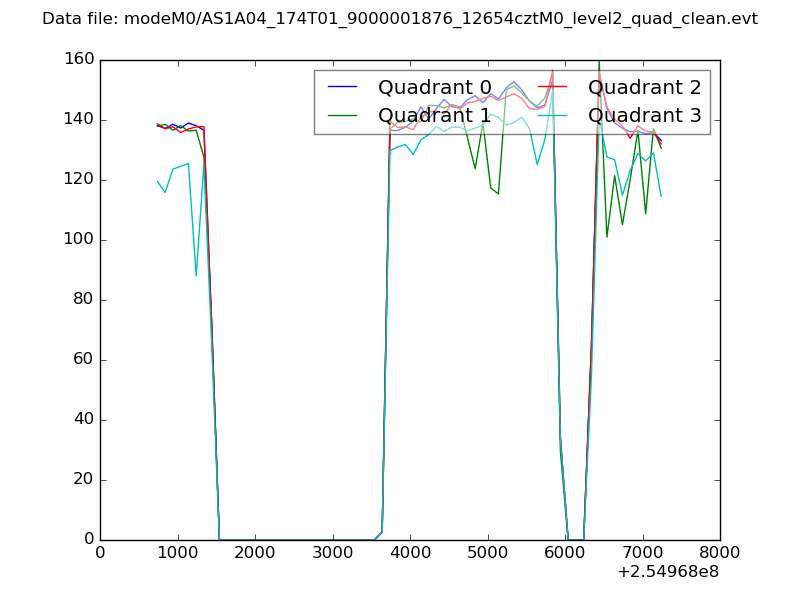 |
|
| Module-wise count rates for Quadrant A Data is divided into 100 sec bins |
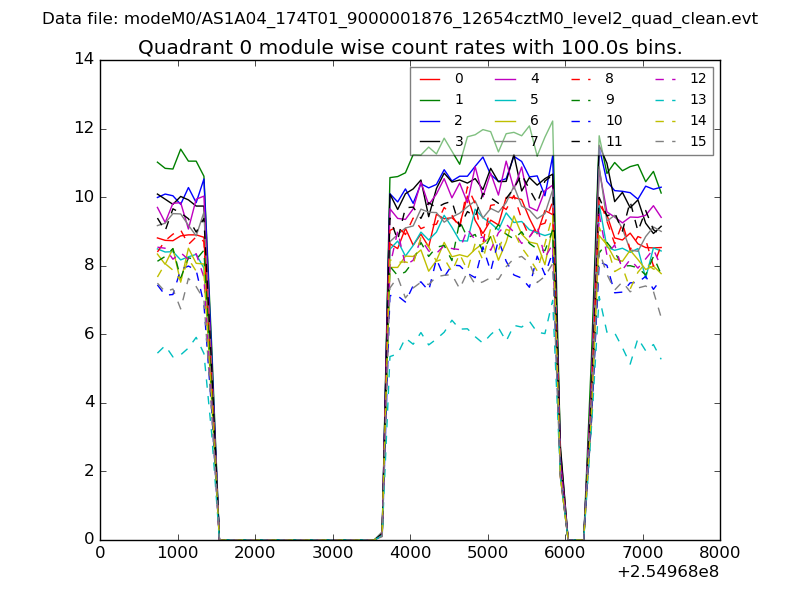 |
 |
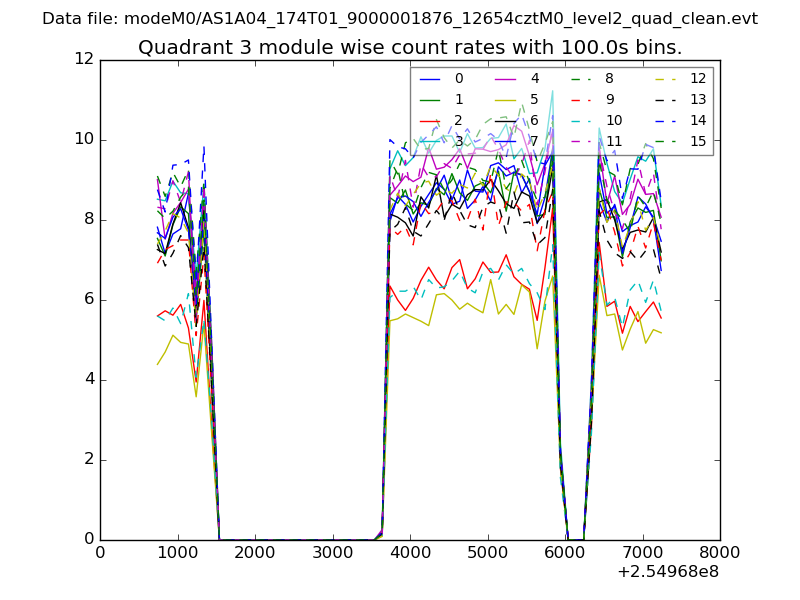
| Module-wise count rates for Quadrant B Data is divided into 100 sec bins |
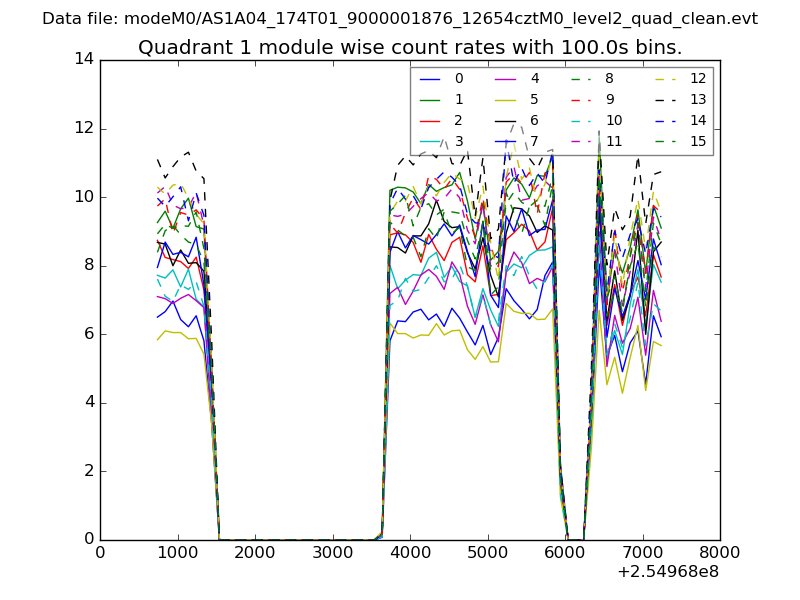 |
 |
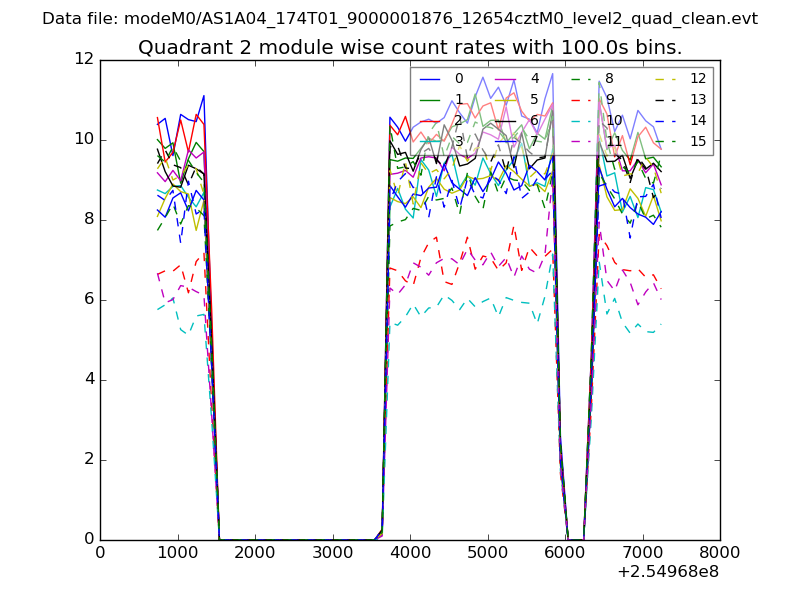
| Module-wise count rates for Quadrant C Data is divided into 100 sec bins |
 |
 |
| Module-wise count rates for Quadrant D Data is divided into 100 sec bins |
 |
 |
| Parameter | Plot |
|---|---|
| CZT HV Monitor | 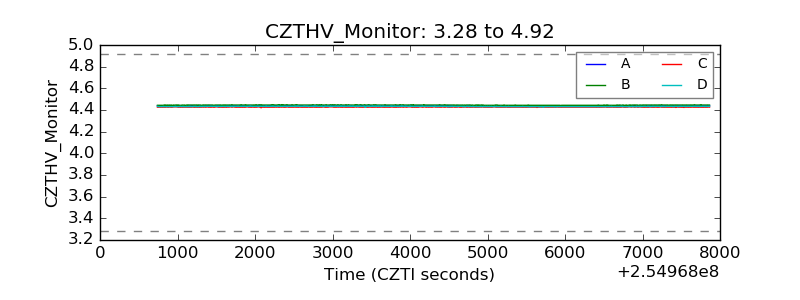 |
| D_VDD | 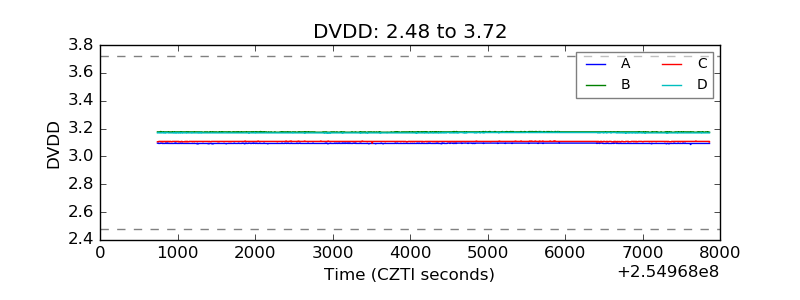 |
| Temperature 1 | 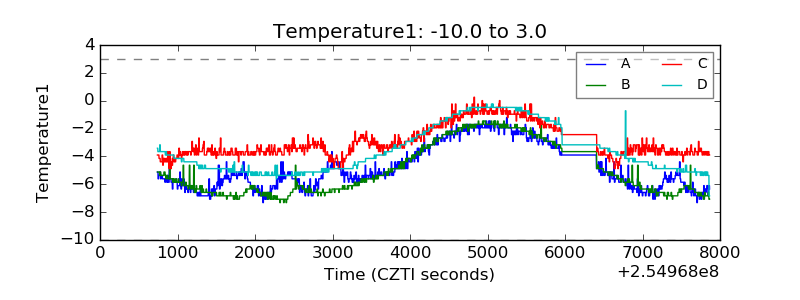 |
| Veto HV Monitor | 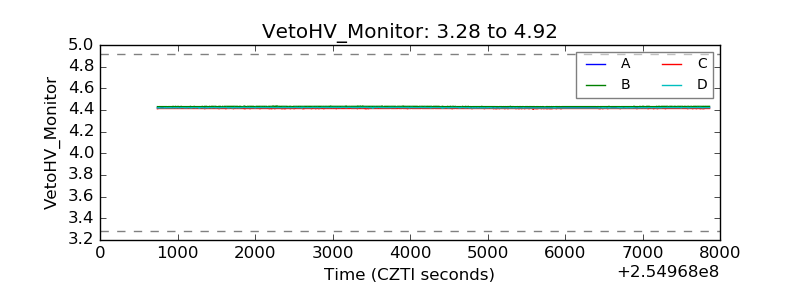 |
| Veto LLD | 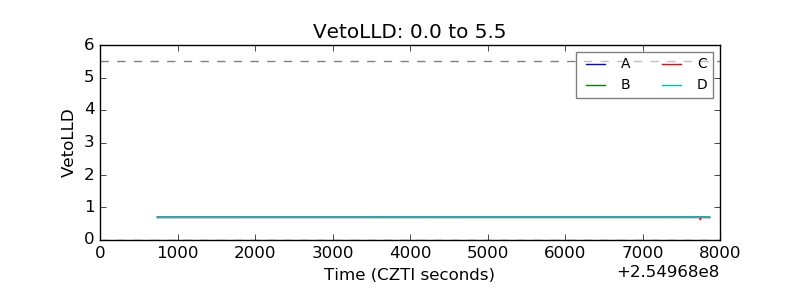 |
| Alpha Counter | 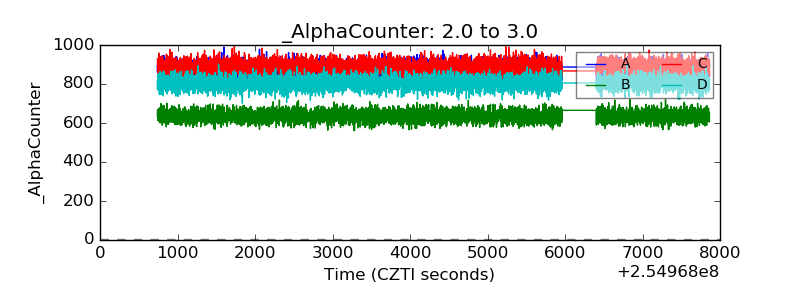 |
| _CPM_Rate | 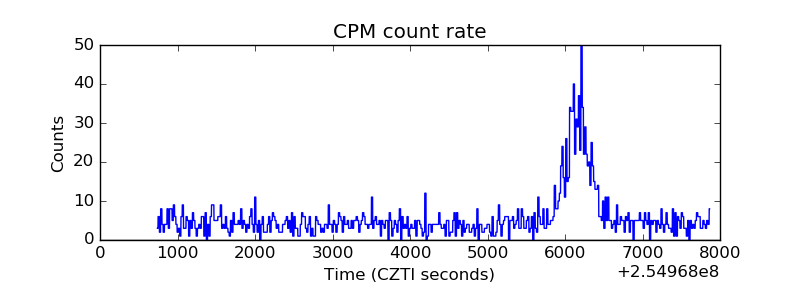 |
| CZT Counter | 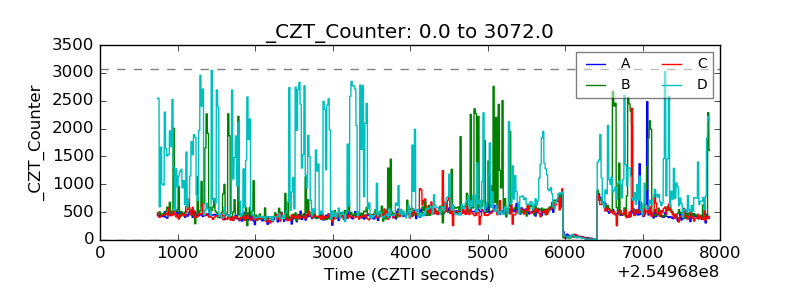 |
| +2.5 Volts monitor |  |
| +5 Volts monitor |  |
| _ROLL_ROT | 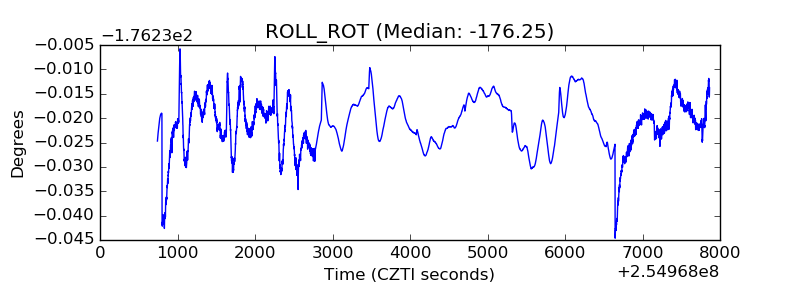 |
| _Roll_DEC | 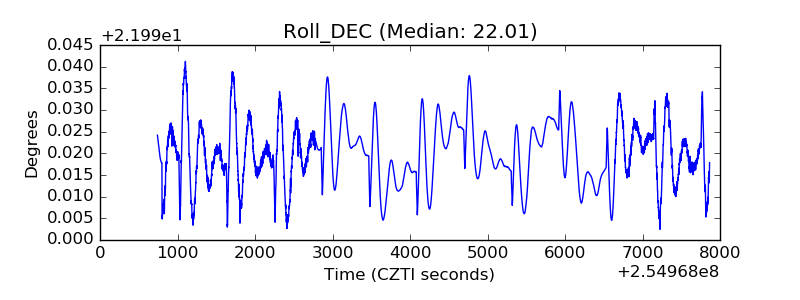 |
| _Roll_RA | 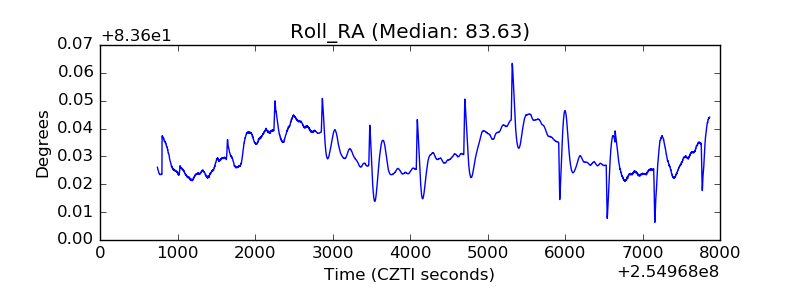 |
| Veto Counter | 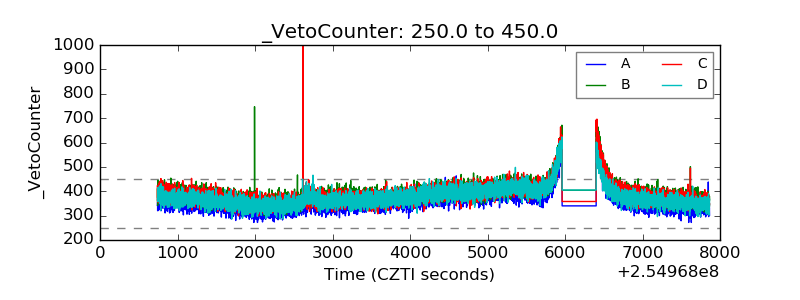 |