| Param | Original file | Final file |
|---|---|---|
| Filename | modeM0/AS1A04_174T01_9000001876_12655cztM0_level2.evt | modeM0/AS1A04_174T01_9000001876_12655cztM0_level2_quad_clean.evt |
| Size (bytes) | 640,454,400 | 95,832,000 |
| Size | 610.8 MB | 91.4 MB |
| Events in quadrant A | 3,655,217 | 607,974 |
| Events in quadrant B | 5,145,495 | 574,905 |
| Events in quadrant C | 3,755,279 | 611,949 |
| Events in quadrant D | 6,315,021 | 567,882 |
| Mode M9 | |||
|---|---|---|---|
| Quadrant | BADHDUFLAG | Total packets | Discarded packets |
| A | 0 | 3 | 0 |
| B | 0 | 3 | 0 |
| C | 0 | 3 | 0 |
| D | 0 | 4 | 0 |
| Mode M0 | |||
|---|---|---|---|
| Quadrant | BADHDUFLAG | Total packets | Discarded packets |
| A | 0 | 16127 | 3 |
| B | 0 | 20345 | 2 |
| C | 0 | 16454 | 2 |
| D | 0 | 24192 | 2 |
| Mode SS | |||
|---|---|---|---|
| Quadrant | BADHDUFLAG | Total packets | Discarded packets |
| A | 0 | 156 | 0 |
| B | 0 | 156 | 0 |
| C | 0 | 156 | 0 |
| D | 0 | 156 | 0 |
| Quadrant | Total seconds | Saturated seconds | Saturation percentage |
|---|---|---|---|
| A | 7756 | 113 | 1.456937% |
| B | 7756 | 620 | 7.993811% |
| C | 7756 | 89 | 1.147499% |
| D | 7756 | 576 | 7.426509% |
Noise dominated data is calculated using 1-second bins in cleaned event files. If a bin has >2000 counts, and if more than 50% of those come from <1% of pixels, then it is considered to be noise-dominated and hence unusable.
| Quadrant | # 1 sec bins | Bins with >0 counts | Bins with >2000 counts | High rate bins dominated by noise | Noise dominated (total time) | Noise dominated (detector-on time) | Marked lightcurve |
|---|---|---|---|---|---|---|---|
| A | 7992 | 7758 | 3 | 3 | 0.04% | 0.04% | 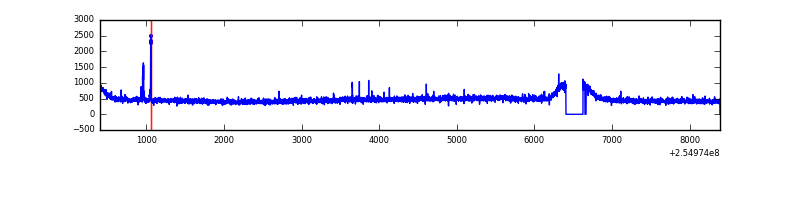 |
| B | 7992 | 7757 | 392 | 392 | 4.90% | 5.05% | 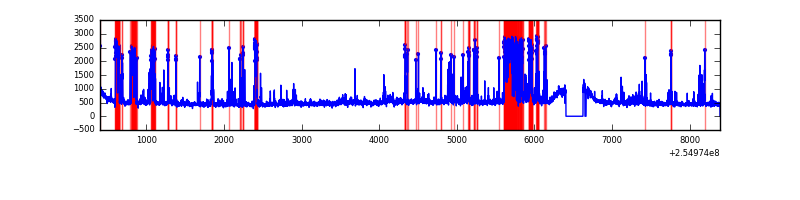 |
| C | 7992 | 7758 | 12 | 12 | 0.15% | 0.15% | 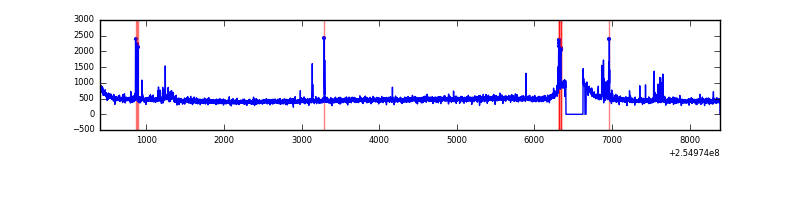 |
| D | 7992 | 7758 | 487 | 487 | 6.09% | 6.28% |  |
Top three noisy pixels from each quadrant. If the there are fewer than three noisy pixels in the level2.evt file, extra rows are filled as -1
| Pixel properties | Quadrant properties | ||||||
|---|---|---|---|---|---|---|---|
| Quadrant | DetID | PixID | Counts | Sigma | Mean | Median | Sigma |
| A | 9 | 143 | 20504 | 101.79 | 936 | 915 | 192.4 |
| A | 12 | 189 | 18429 | 91.01 | 936 | 915 | 192.4 |
| A | 13 | 248 | 16090 | 78.86 | 936 | 915 | 192.4 |
| B | 4 | 239 | 1400600 | 7915.69 | 911 | 889 | 176.8 |
| B | 3 | 64 | 48443 | 268.93 | 911 | 889 | 176.8 |
| B | 3 | 209 | 47233 | 262.09 | 911 | 889 | 176.8 |
| C | 15 | 208 | 155020 | 719.03 | 919 | 927 | 214.3 |
| C | 12 | 2 | 8346 | 34.62 | 919 | 927 | 214.3 |
| C | 14 | 234 | 8191 | 33.9 | 919 | 927 | 214.3 |
| D | 1 | 52 | 2229032 | 10334.01 | 882 | 856 | 215.6 |
| D | 10 | 157 | 665369 | 3081.93 | 882 | 856 | 215.6 |
| D | 13 | 249 | 30324 | 136.67 | 882 | 856 | 215.6 |
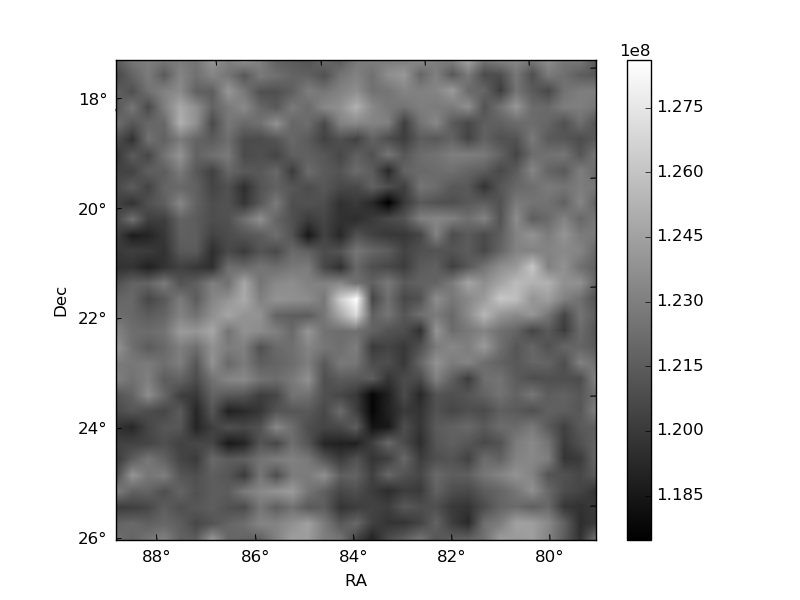
Histogram calculated using DETX and DETY for each event in the final _common_clean file
| Quadrant A |  |
 |
Quadrant B |
|---|---|---|---|
| Quadrant D | 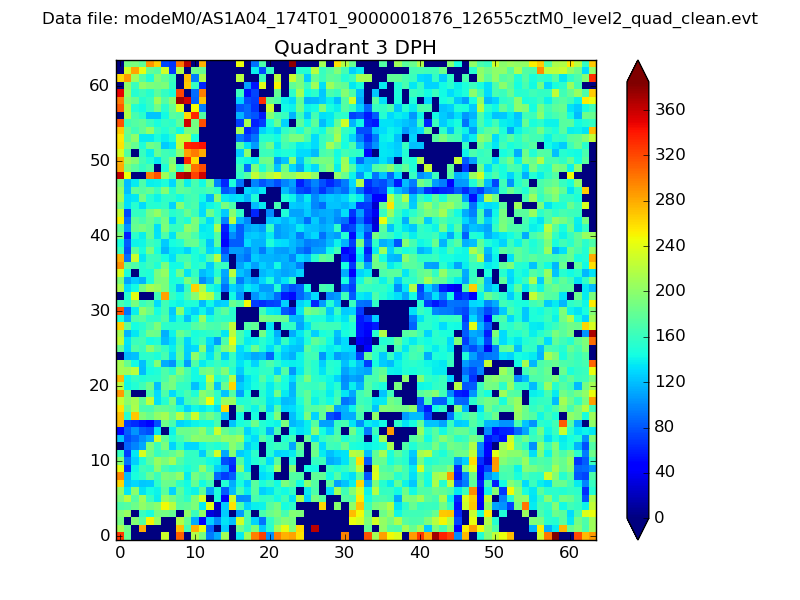 |
 |
Quadrant C |
| Plot type | Count rate plots | Images |
|---|---|---|
| Comparison with Poisson distribution Blue bars denote a histogram of data divided into 1 sec bins. Red curve is a Poisson curve with rate = median count rate of data. |
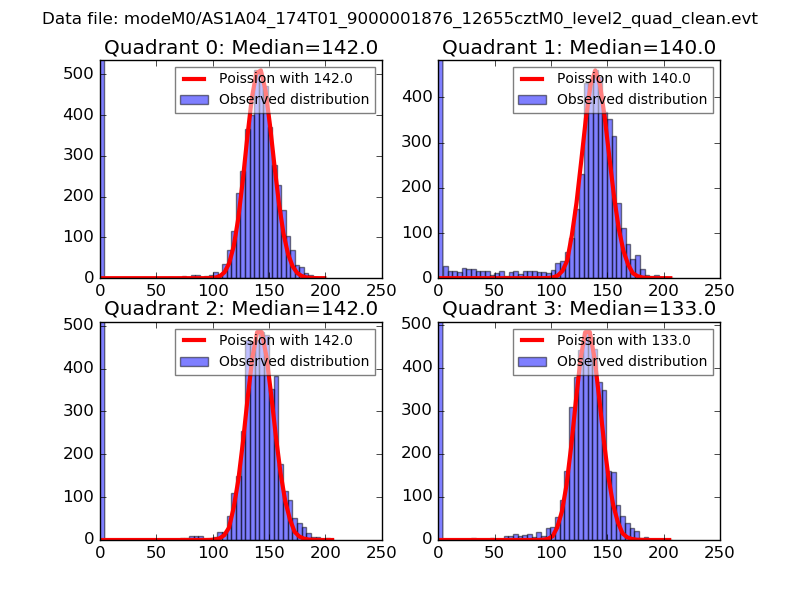 |
 |
| Quadrant-wise count rates Data is divided into 100 sec bins |
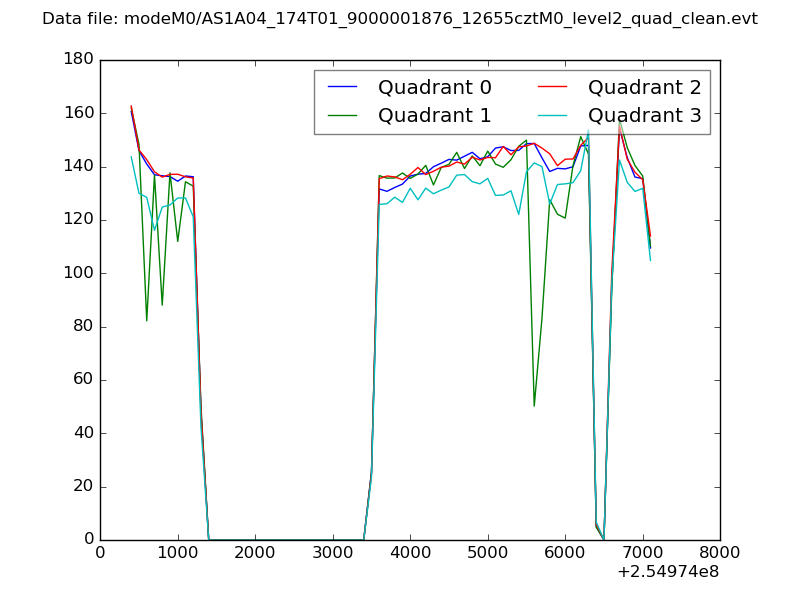 |
|
| Module-wise count rates for Quadrant A Data is divided into 100 sec bins |
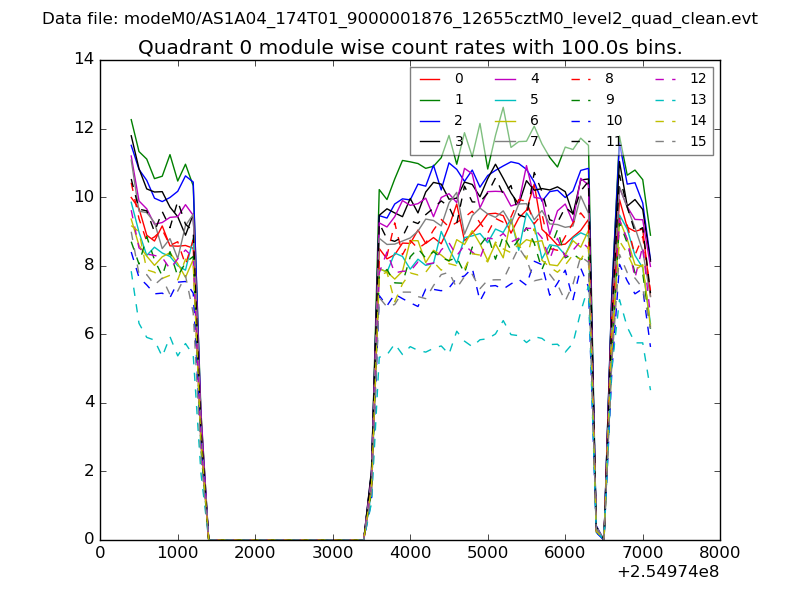 |
 |
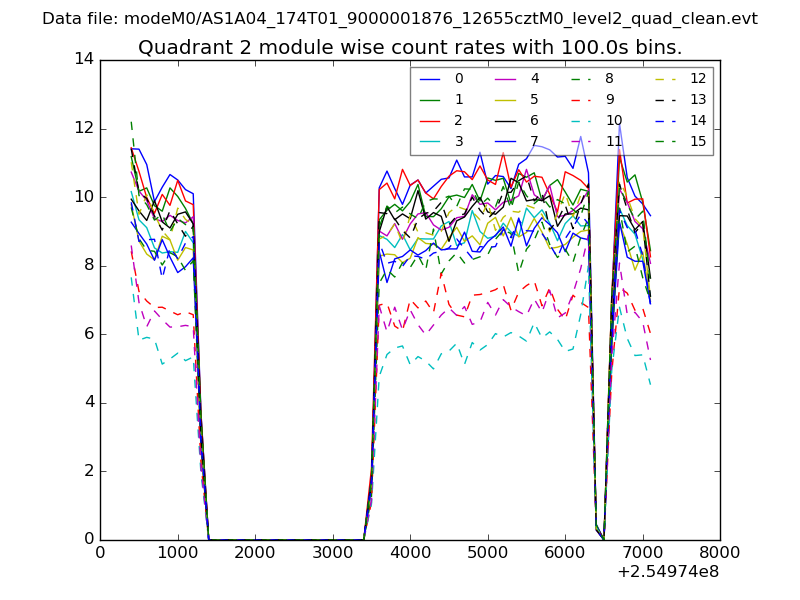
| Module-wise count rates for Quadrant B Data is divided into 100 sec bins |
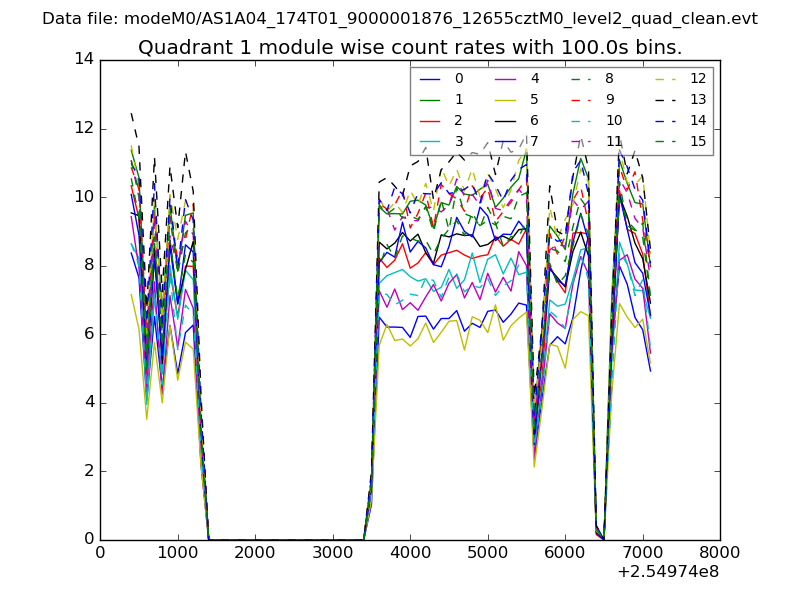 |
 |
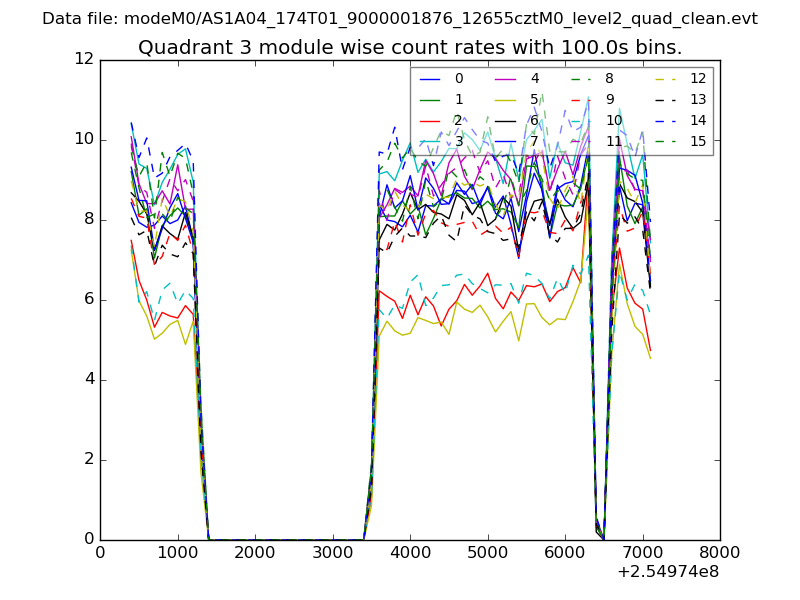
| Module-wise count rates for Quadrant C Data is divided into 100 sec bins |
 |
 |
| Module-wise count rates for Quadrant D Data is divided into 100 sec bins |
 |
 |
| Parameter | Plot |
|---|---|
| CZT HV Monitor | 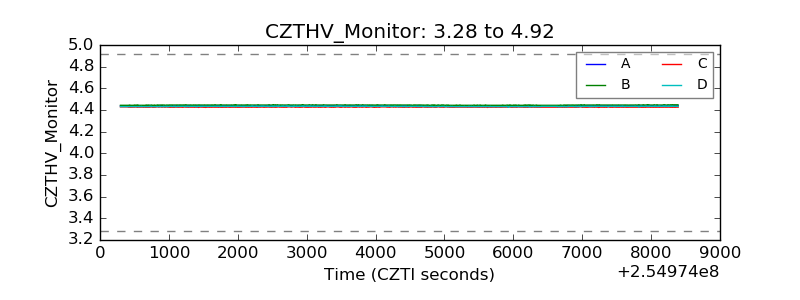 |
| D_VDD | 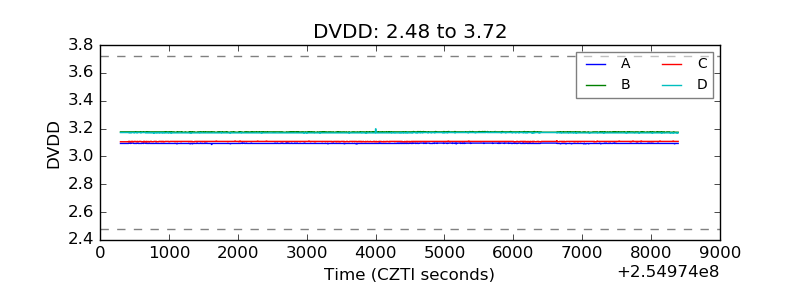 |
| Temperature 1 | 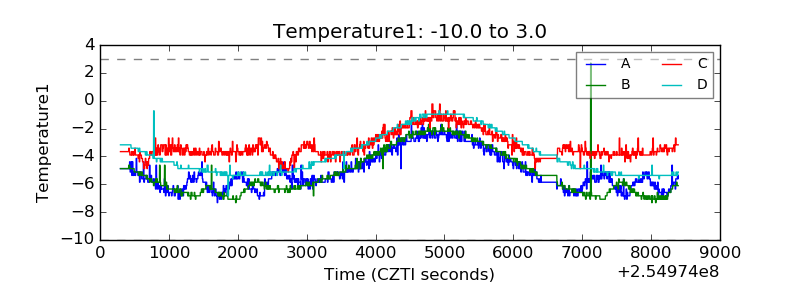 |
| Veto HV Monitor | 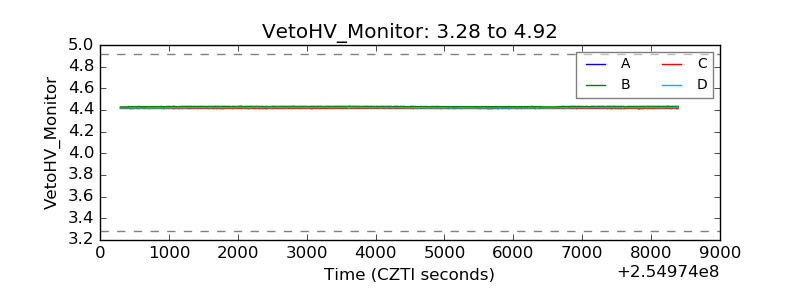 |
| Veto LLD | 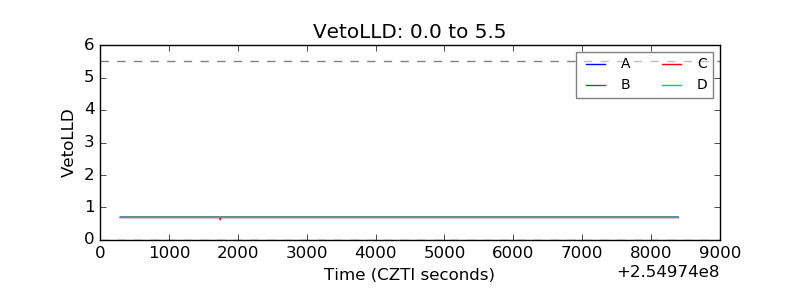 |
| Alpha Counter | 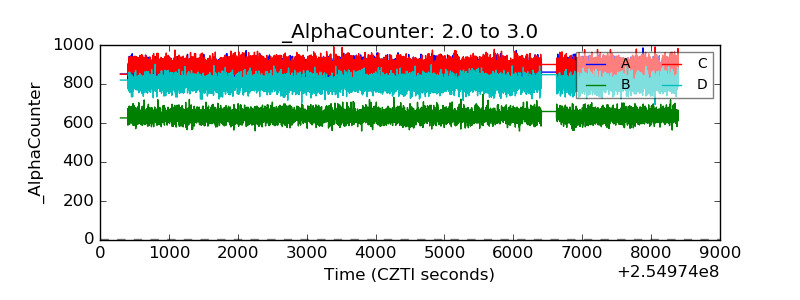 |
| _CPM_Rate | 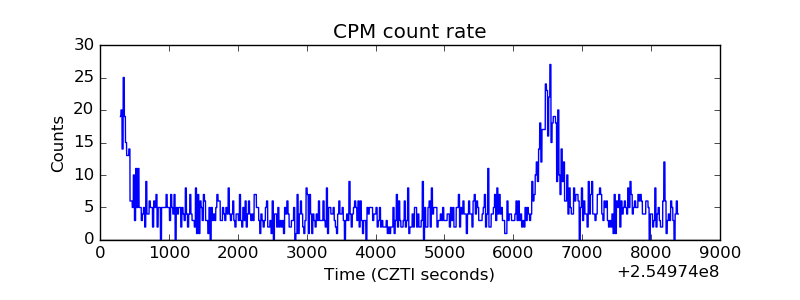 |
| CZT Counter |  |
| +2.5 Volts monitor |  |
| +5 Volts monitor |  |
| _ROLL_ROT | 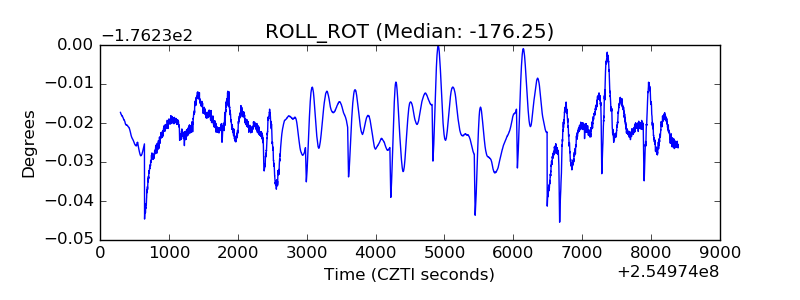 |
| _Roll_DEC | 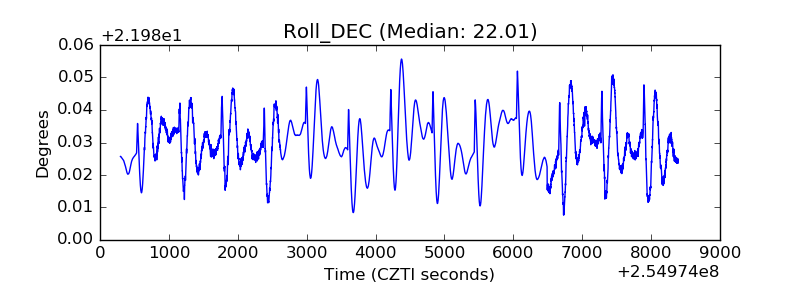 |
| _Roll_RA | 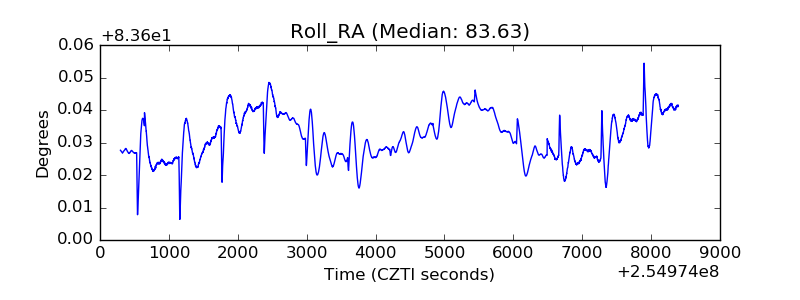 |
| Veto Counter | 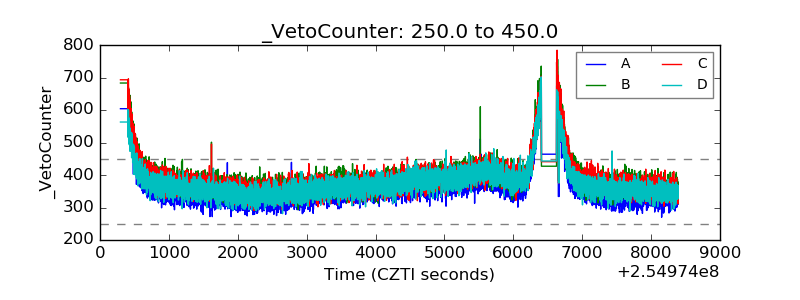 |