| Param | Original file | Final file |
|---|---|---|
| Filename | modeM0/AS1A04_174T01_9000001876_12656cztM0_level2.evt | modeM0/AS1A04_174T01_9000001876_12656cztM0_level2_quad_clean.evt |
| Size (bytes) | 531,561,600 | 79,706,880 |
| Size | 506.9 MB | 76.0 MB |
| Events in quadrant A | 3,368,580 | 491,606 |
| Events in quadrant B | 4,906,180 | 454,665 |
| Events in quadrant C | 3,418,856 | 493,175 |
| Events in quadrant D | 3,912,164 | 468,812 |
| Mode M9 | |||
|---|---|---|---|
| Quadrant | BADHDUFLAG | Total packets | Discarded packets |
| A | 0 | 3 | 0 |
| B | 0 | 3 | 0 |
| C | 0 | 3 | 0 |
| D | 0 | 3 | 0 |
| Mode M0 | |||
|---|---|---|---|
| Quadrant | BADHDUFLAG | Total packets | Discarded packets |
| A | 0 | 14826 | 2 |
| B | 0 | 19268 | 1 |
| C | 0 | 15086 | 1 |
| D | 0 | 16611 | 1 |
| Mode SS | |||
|---|---|---|---|
| Quadrant | BADHDUFLAG | Total packets | Discarded packets |
| A | 0 | 150 | 0 |
| B | 0 | 150 | 0 |
| C | 0 | 150 | 0 |
| D | 0 | 150 | 0 |
| Quadrant | Total seconds | Saturated seconds | Saturation percentage |
|---|---|---|---|
| A | 7245 | 64 | 0.883368% |
| B | 7245 | 580 | 8.005521% |
| C | 7245 | 48 | 0.662526% |
| D | 7245 | 103 | 1.421670% |
Noise dominated data is calculated using 1-second bins in cleaned event files. If a bin has >2000 counts, and if more than 50% of those come from <1% of pixels, then it is considered to be noise-dominated and hence unusable.
| Quadrant | # 1 sec bins | Bins with >0 counts | Bins with >2000 counts | High rate bins dominated by noise | Noise dominated (total time) | Noise dominated (detector-on time) | Marked lightcurve |
|---|---|---|---|---|---|---|---|
| A | 7626 | 7246 | 0 | 0 | 0.00% | 0.00% | 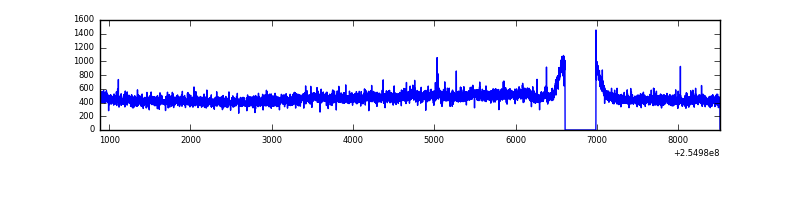 |
| B | 7626 | 7246 | 418 | 418 | 5.48% | 5.77% | 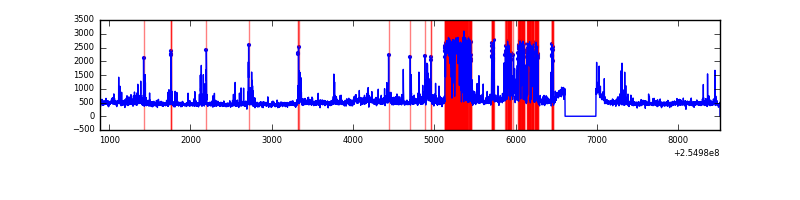 |
| C | 7626 | 7246 | 5 | 5 | 0.07% | 0.07% | 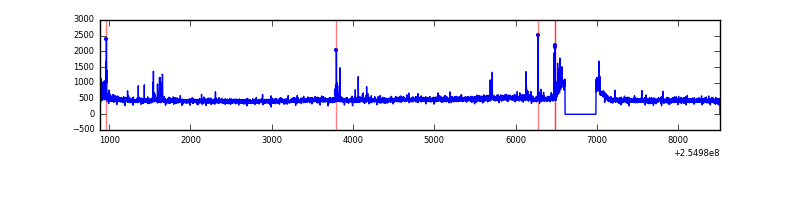 |
| D | 7626 | 7246 | 67 | 67 | 0.88% | 0.92% | 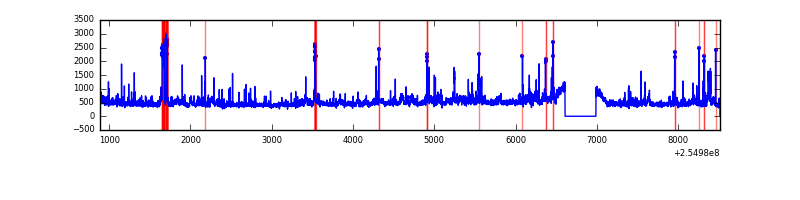 |
Top three noisy pixels from each quadrant. If the there are fewer than three noisy pixels in the level2.evt file, extra rows are filled as -1
| Pixel properties | Quadrant properties | ||||||
|---|---|---|---|---|---|---|---|
| Quadrant | DetID | PixID | Counts | Sigma | Mean | Median | Sigma |
| A | 12 | 189 | 53895 | 299.74 | 860 | 842 | 177.0 |
| A | 8 | 15 | 9988 | 51.67 | 860 | 842 | 177.0 |
| A | 0 | 226 | 7646 | 38.44 | 860 | 842 | 177.0 |
| B | 4 | 239 | 1357539 | 8433.56 | 836 | 818 | 160.9 |
| B | 11 | 51 | 90824 | 559.49 | 836 | 818 | 160.9 |
| B | 3 | 64 | 56558 | 346.49 | 836 | 818 | 160.9 |
| C | 15 | 208 | 107305 | 540.35 | 846 | 851 | 197.0 |
| C | 14 | 234 | 10349 | 48.21 | 846 | 851 | 197.0 |
| C | 13 | 61 | 6329 | 27.81 | 846 | 851 | 197.0 |
| D | 1 | 52 | 366896 | 1810.18 | 831 | 809 | 202.2 |
| D | 10 | 157 | 299148 | 1475.19 | 831 | 809 | 202.2 |
| D | 13 | 249 | 66595 | 325.29 | 831 | 809 | 202.2 |
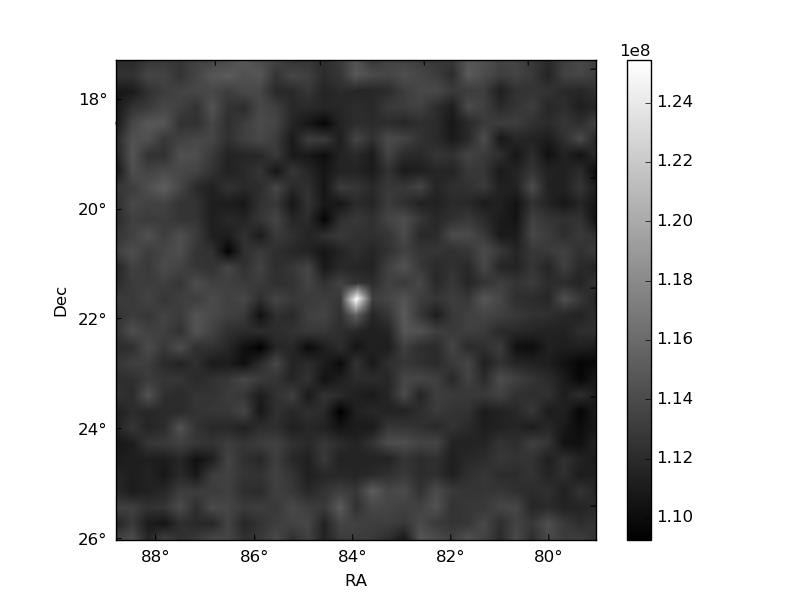
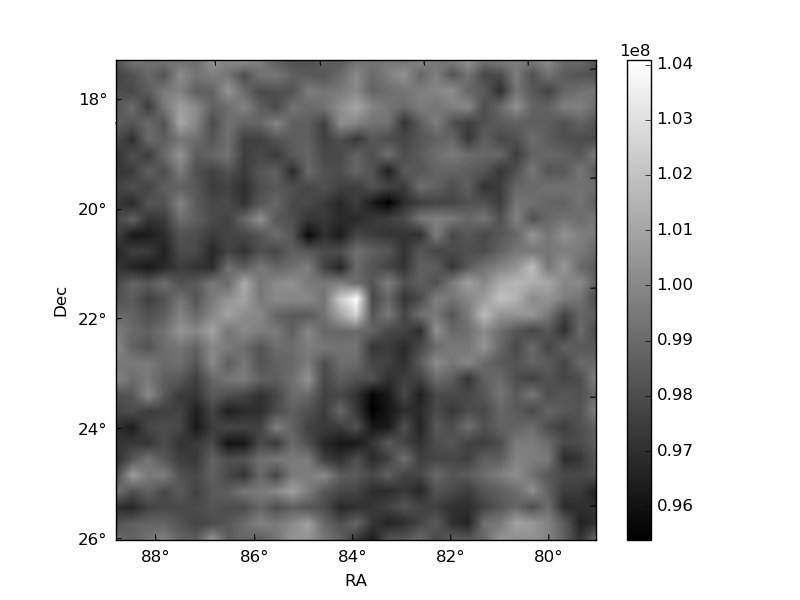
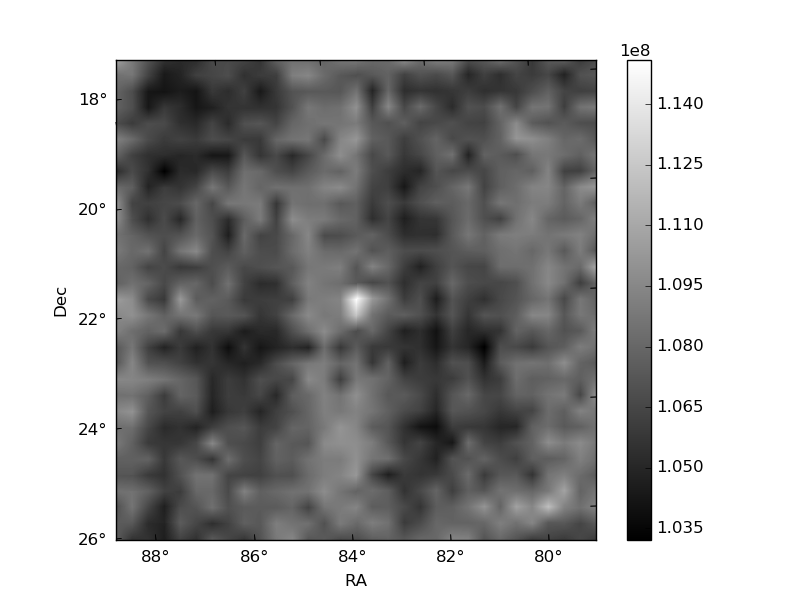
Histogram calculated using DETX and DETY for each event in the final _common_clean file
| Quadrant A |  |
 |
Quadrant B |
|---|---|---|---|
| Quadrant D |  |
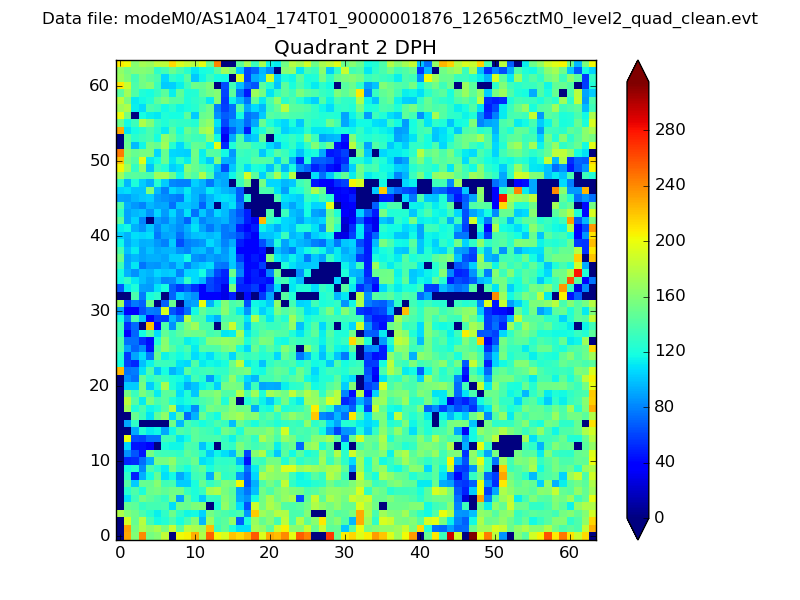 |
Quadrant C |
| Plot type | Count rate plots | Images |
|---|---|---|
| Comparison with Poisson distribution Blue bars denote a histogram of data divided into 1 sec bins. Red curve is a Poisson curve with rate = median count rate of data. |
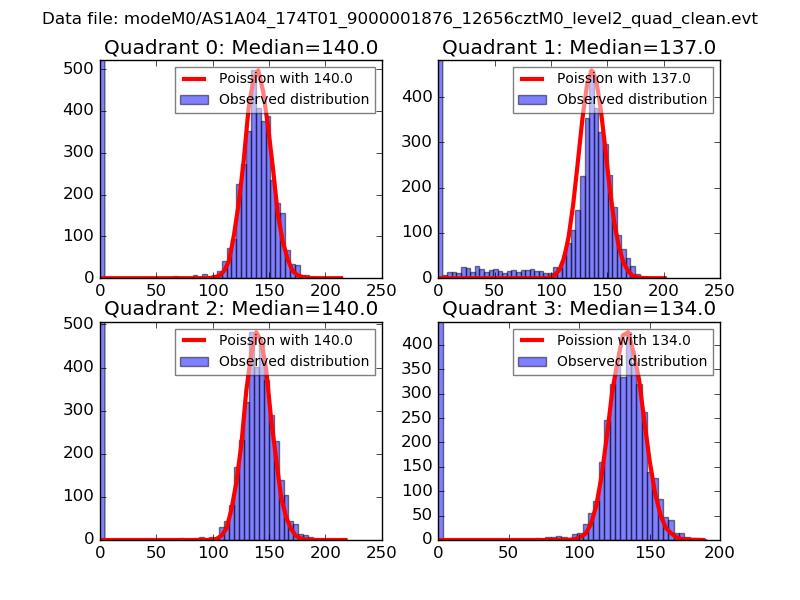 |
 |
| Quadrant-wise count rates Data is divided into 100 sec bins |
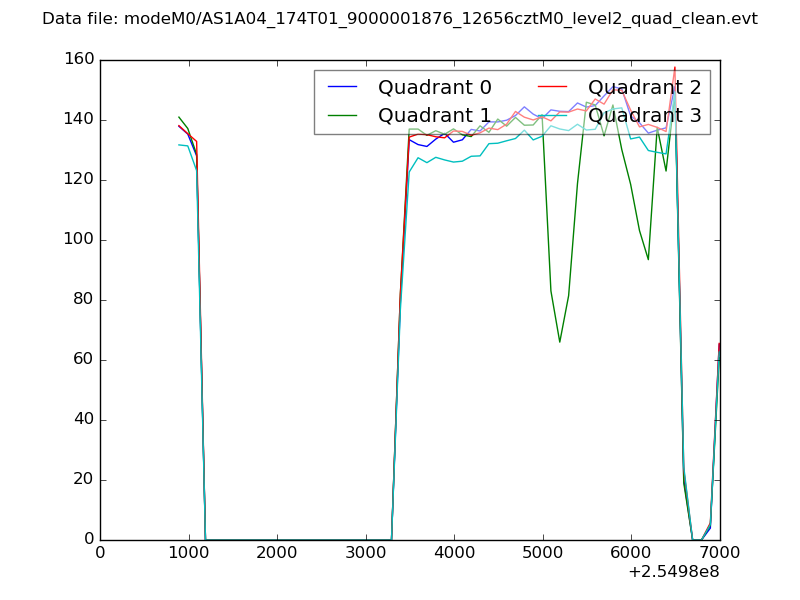 |
|
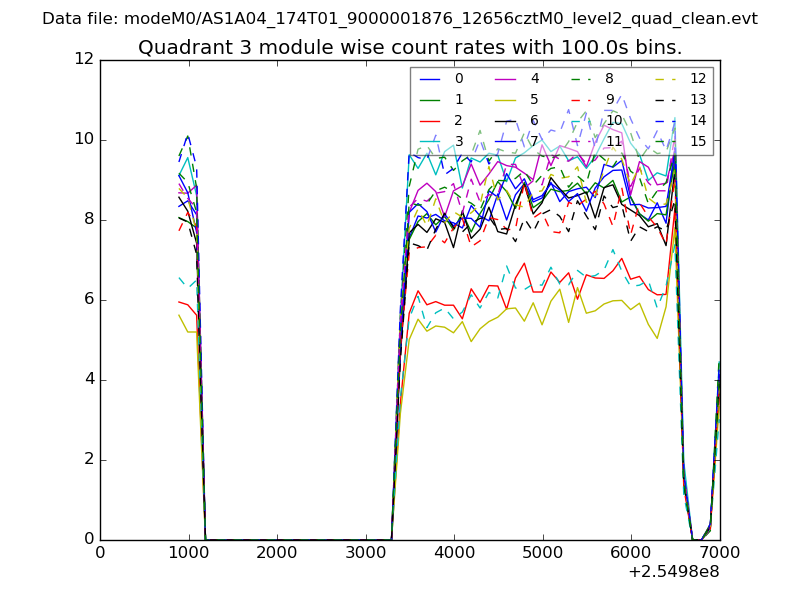
| Module-wise count rates for Quadrant A Data is divided into 100 sec bins |
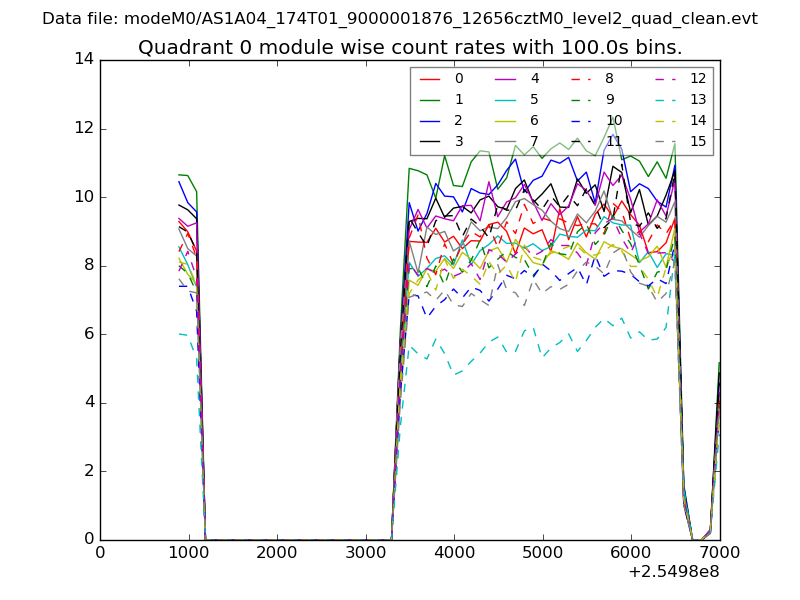 |
 |
| Module-wise count rates for Quadrant B Data is divided into 100 sec bins |
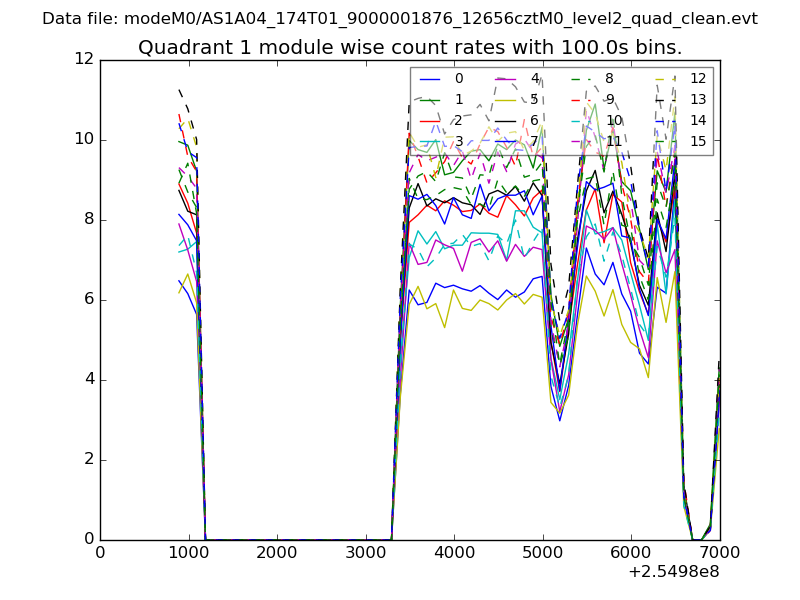 |
 |
| Module-wise count rates for Quadrant C Data is divided into 100 sec bins |
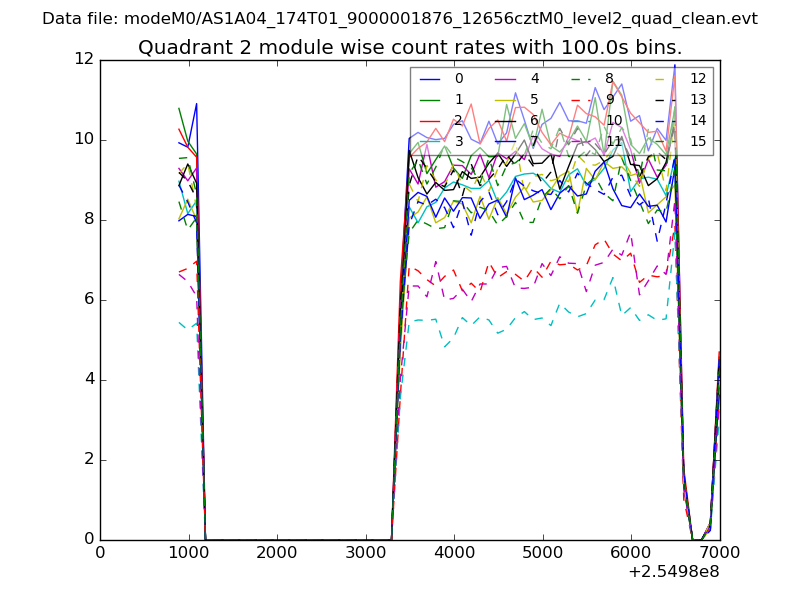 |
 |
| Module-wise count rates for Quadrant D Data is divided into 100 sec bins |
 |
 |
| Parameter | Plot |
|---|---|
| CZT HV Monitor | 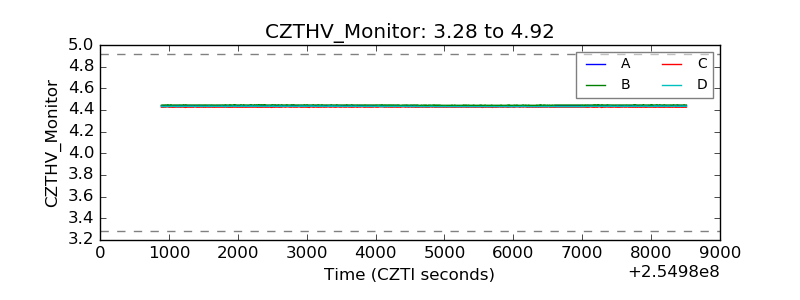 |
| D_VDD | 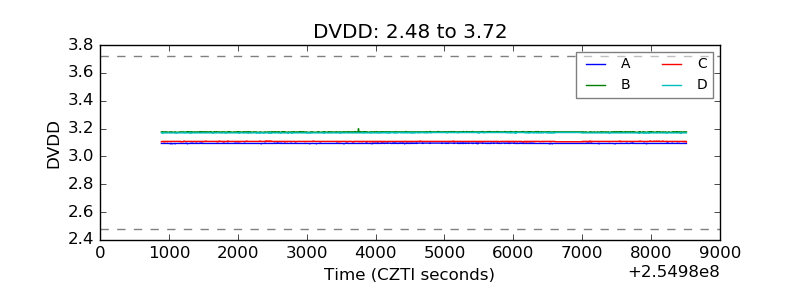 |
| Temperature 1 | 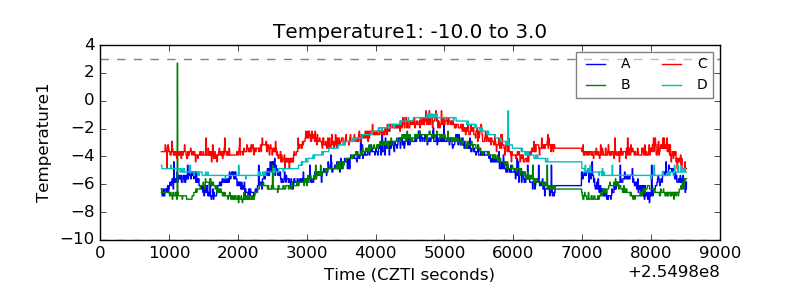 |
| Veto HV Monitor | 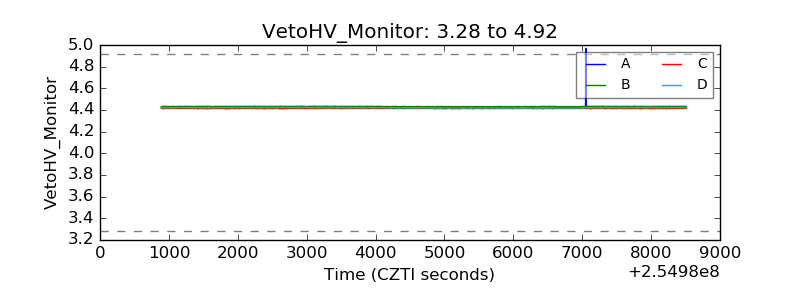 |
| Veto LLD | 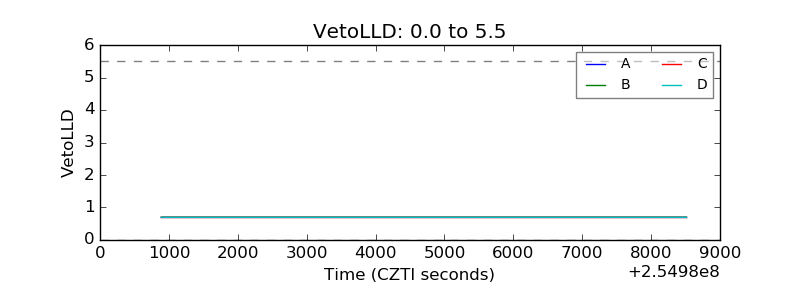 |
| Alpha Counter | 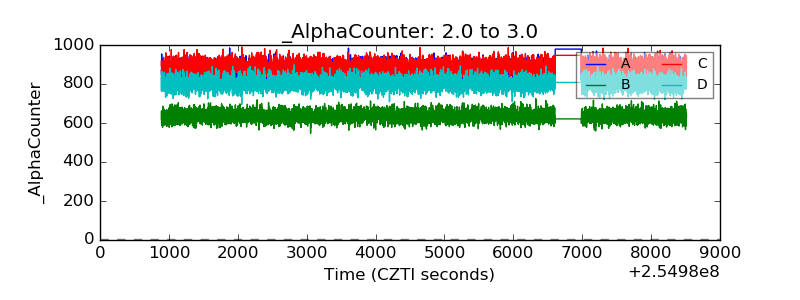 |
| _CPM_Rate | 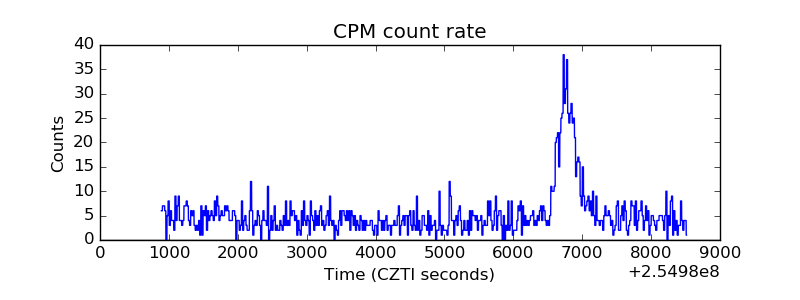 |
| CZT Counter |  |
| +2.5 Volts monitor |  |
| +5 Volts monitor |  |
| _ROLL_ROT | 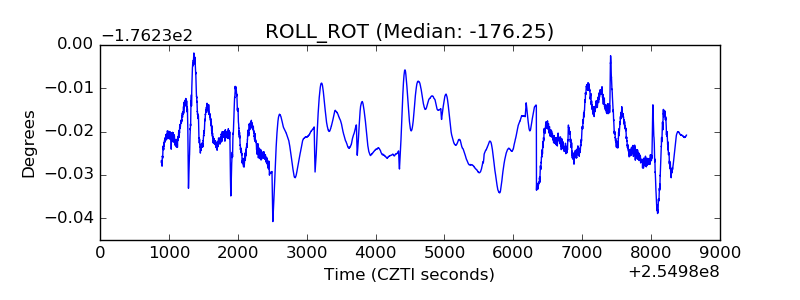 |
| _Roll_DEC | 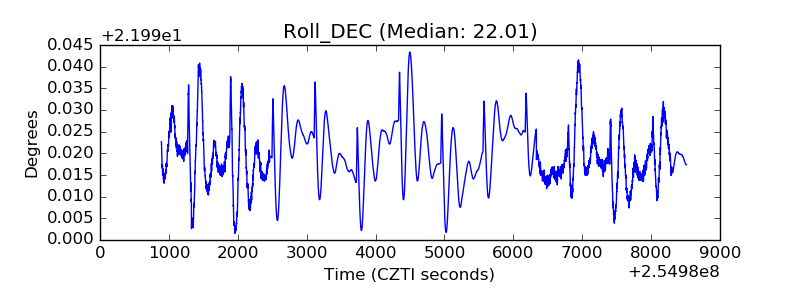 |
| _Roll_RA | 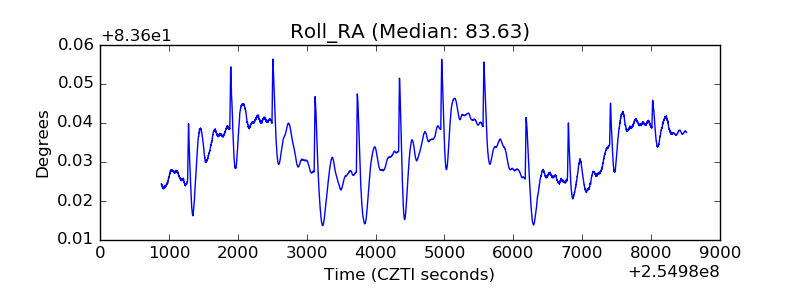 |
| Veto Counter | 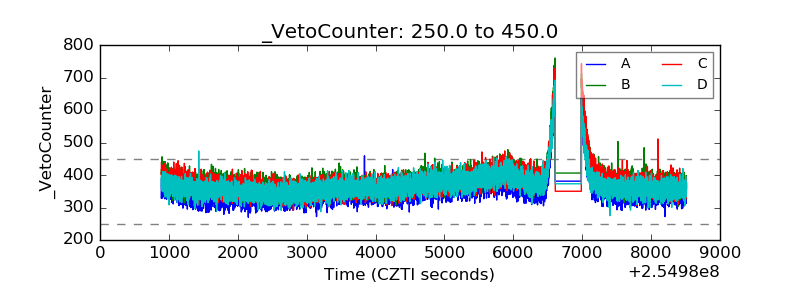 |