| Param | Original file | Final file |
|---|---|---|
| Filename | modeM0/AS1A04_174T01_9000001876_12658cztM0_level2.evt | modeM0/AS1A04_174T01_9000001876_12658cztM0_level2_quad_clean.evt |
| Size (bytes) | 981,325,440 | 169,920,000 |
| Size | 935.9 MB | 162.0 MB |
| Events in quadrant A | 6,374,778 | 1,071,117 |
| Events in quadrant B | 8,298,797 | 1,050,025 |
| Events in quadrant C | 6,621,314 | 1,075,926 |
| Events in quadrant D | 7,514,128 | 1,019,203 |
| Mode M9 | |||
|---|---|---|---|
| Quadrant | BADHDUFLAG | Total packets | Discarded packets |
| A | 0 | 15 | 0 |
| B | 0 | 15 | 0 |
| C | 0 | 15 | 0 |
| D | 0 | 15 | 0 |
| Mode M0 | |||
|---|---|---|---|
| Quadrant | BADHDUFLAG | Total packets | Discarded packets |
| A | 0 | 27590 | 4 |
| B | 0 | 32981 | 3 |
| C | 0 | 28584 | 3 |
| D | 0 | 31337 | 3 |
| Mode SS | |||
|---|---|---|---|
| Quadrant | BADHDUFLAG | Total packets | Discarded packets |
| A | 0 | 276 | 0 |
| B | 0 | 276 | 0 |
| C | 0 | 276 | 0 |
| D | 0 | 276 | 0 |
| Quadrant | Total seconds | Saturated seconds | Saturation percentage |
|---|---|---|---|
| A | 13453 | 223 | 1.657623% |
| B | 13453 | 711 | 5.285067% |
| C | 13453 | 232 | 1.724522% |
| D | 13453 | 322 | 2.393518% |
Noise dominated data is calculated using 1-second bins in cleaned event files. If a bin has >2000 counts, and if more than 50% of those come from <1% of pixels, then it is considered to be noise-dominated and hence unusable.
| Quadrant | # 1 sec bins | Bins with >0 counts | Bins with >2000 counts | High rate bins dominated by noise | Noise dominated (total time) | Noise dominated (detector-on time) | Marked lightcurve |
|---|---|---|---|---|---|---|---|
| A | 15004 | 13455 | 0 | 0 | 0.00% | 0.00% | 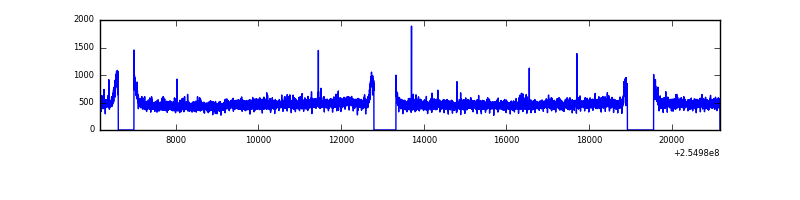 |
| B | 15004 | 13455 | 341 | 341 | 2.27% | 2.53% | 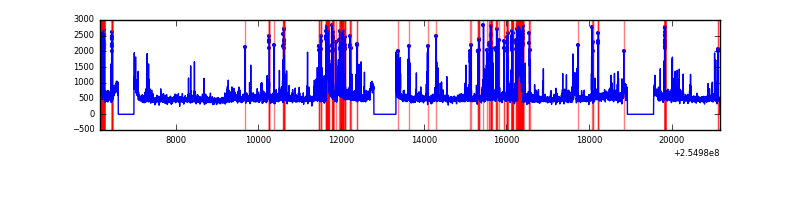 |
| C | 15004 | 13455 | 51 | 51 | 0.34% | 0.38% | 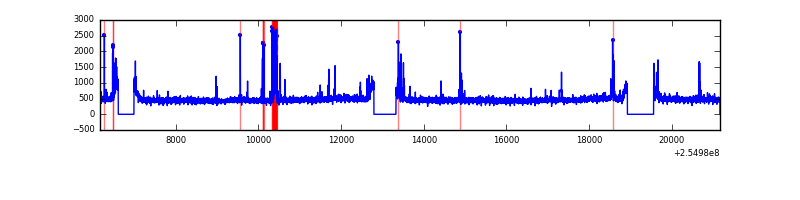 |
| D | 15004 | 13455 | 125 | 125 | 0.83% | 0.93% | 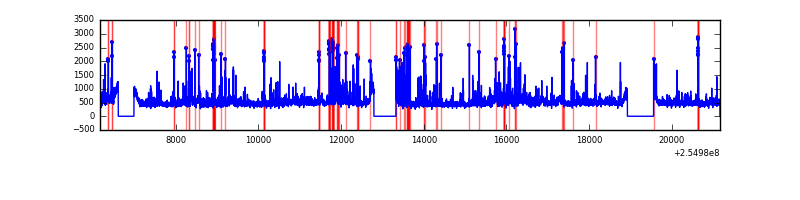 |
Top three noisy pixels from each quadrant. If the there are fewer than three noisy pixels in the level2.evt file, extra rows are filled as -1
| Pixel properties | Quadrant properties | ||||||
|---|---|---|---|---|---|---|---|
| Quadrant | DetID | PixID | Counts | Sigma | Mean | Median | Sigma |
| A | 12 | 189 | 39994 | 113.77 | 1639 | 1603 | 337.4 |
| A | 8 | 15 | 23818 | 65.83 | 1639 | 1603 | 337.4 |
| A | 0 | 226 | 14638 | 38.63 | 1639 | 1603 | 337.4 |
| B | 4 | 239 | 1348909 | 4304.25 | 1617 | 1577 | 313.0 |
| B | 3 | 64 | 295807 | 939.96 | 1617 | 1577 | 313.0 |
| B | 11 | 51 | 149304 | 471.94 | 1617 | 1577 | 313.0 |
| C | 15 | 208 | 364286 | 974.23 | 1602 | 1613 | 372.3 |
| C | 13 | 61 | 11748 | 27.23 | 1602 | 1613 | 372.3 |
| C | 8 | 222 | 9972 | 22.45 | 1602 | 1613 | 372.3 |
| D | 1 | 52 | 813967 | 2129.2 | 1583 | 1542 | 381.6 |
| D | 10 | 157 | 393687 | 1027.73 | 1583 | 1542 | 381.6 |
| D | 13 | 249 | 152980 | 396.89 | 1583 | 1542 | 381.6 |
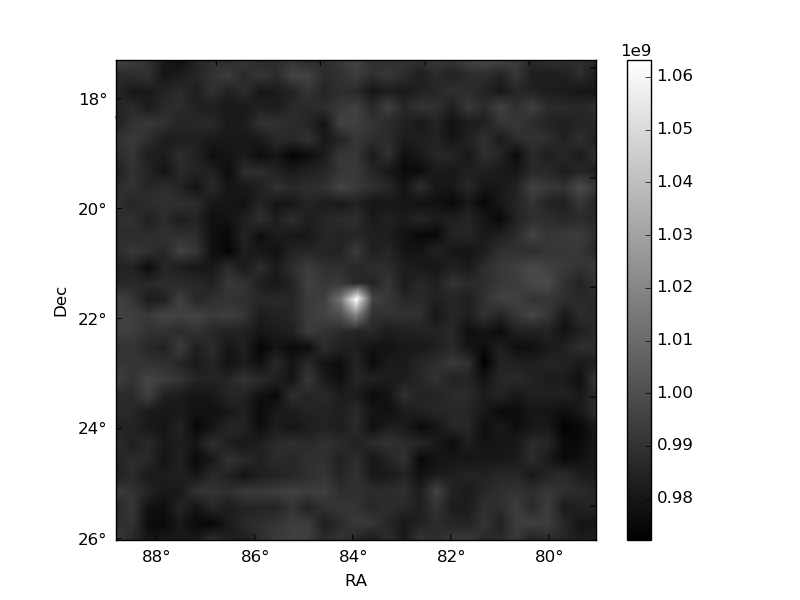
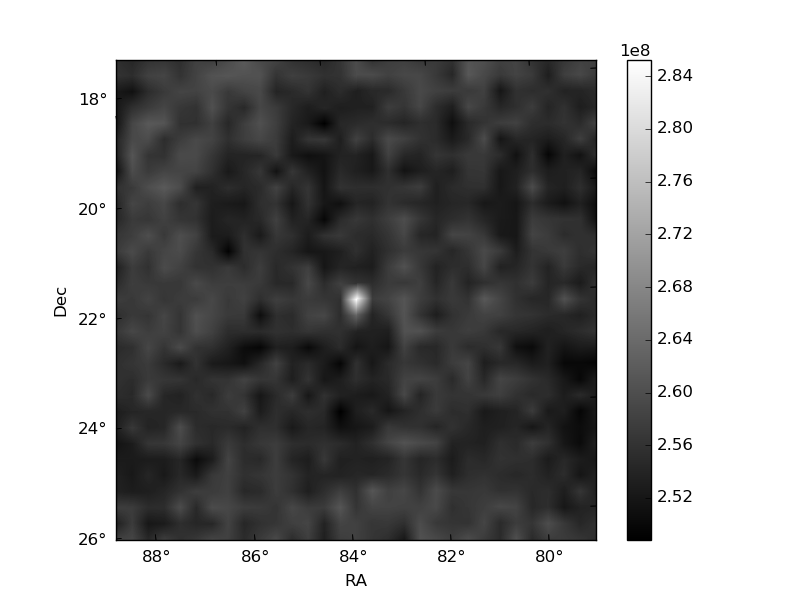
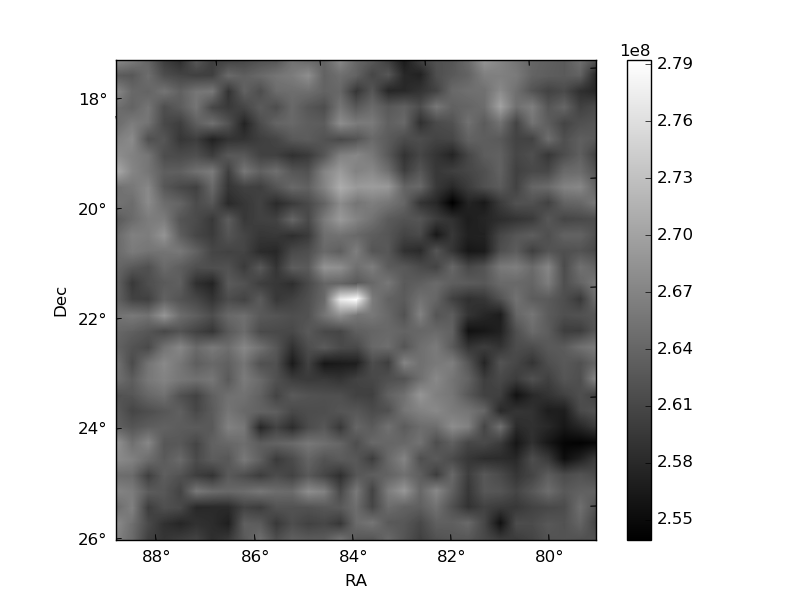
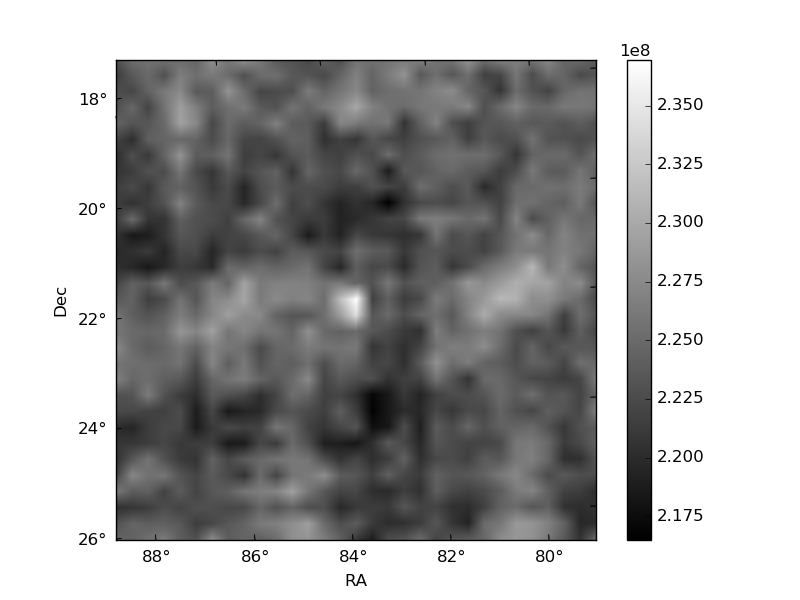
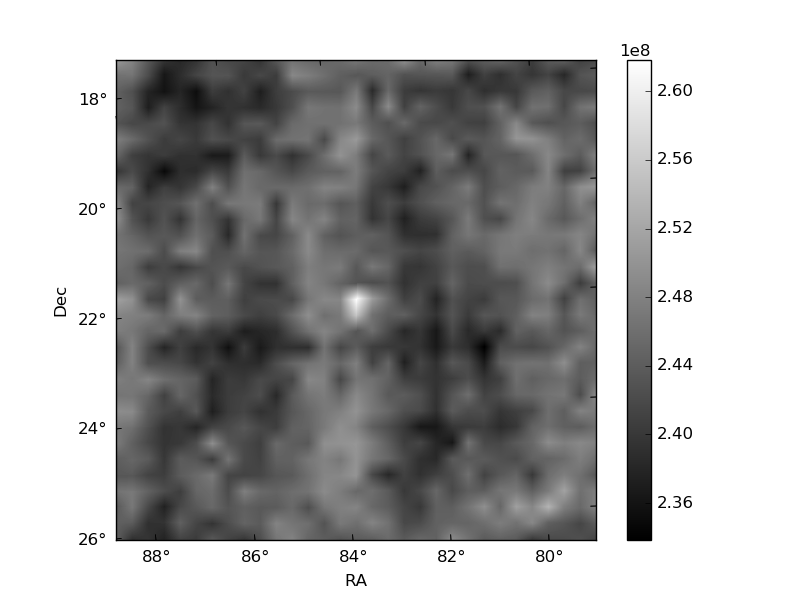
Histogram calculated using DETX and DETY for each event in the final _common_clean file
| Quadrant A | 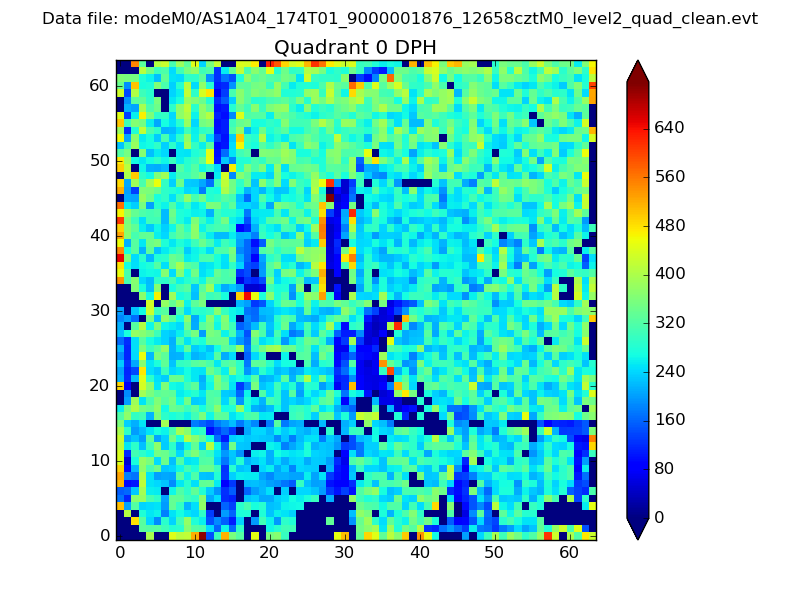 |
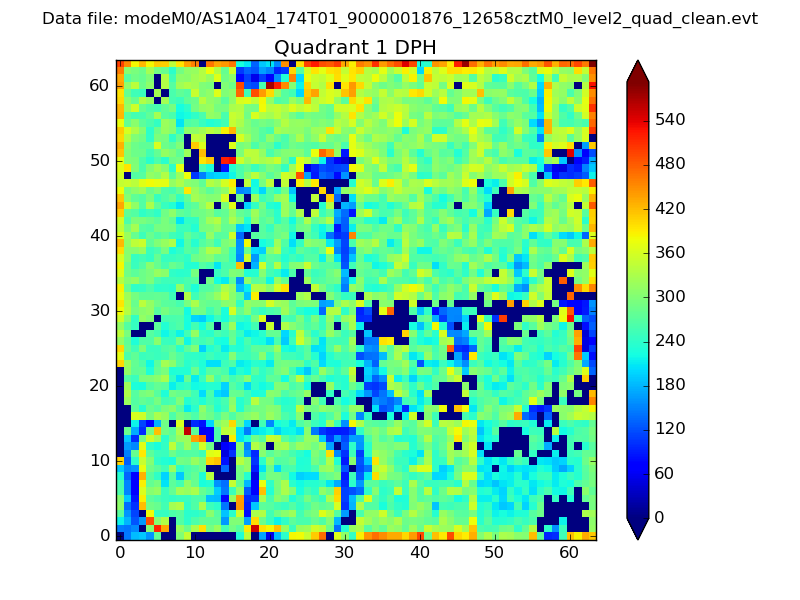 |
Quadrant B |
|---|---|---|---|
| Quadrant D | 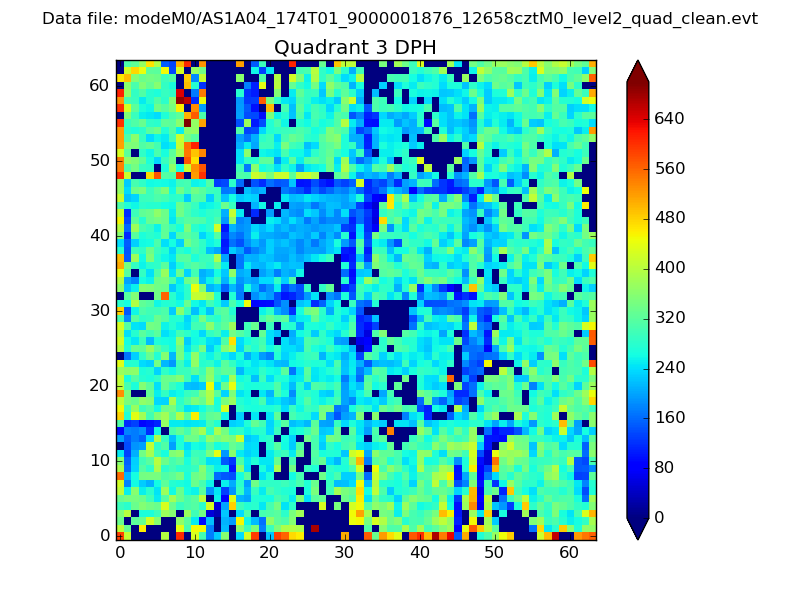 |
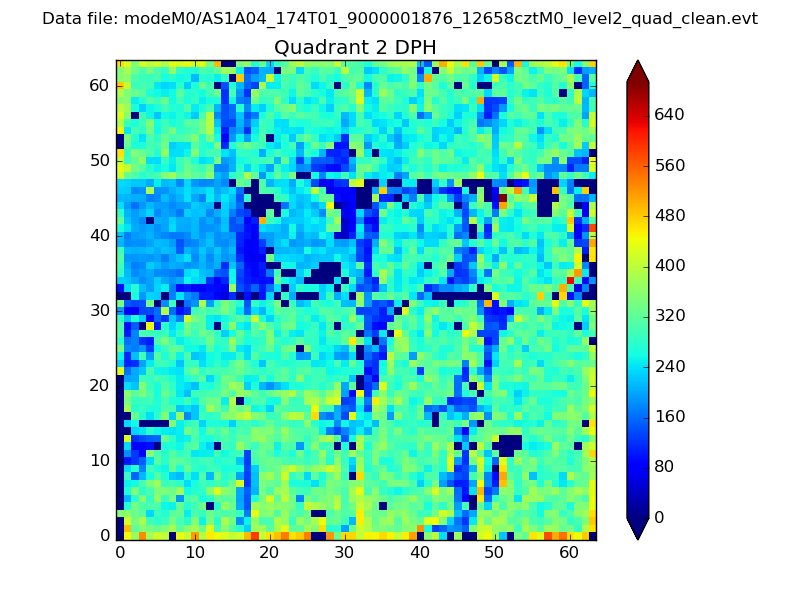 |
Quadrant C |
| Plot type | Count rate plots | Images |
|---|---|---|
| Comparison with Poisson distribution Blue bars denote a histogram of data divided into 1 sec bins. Red curve is a Poisson curve with rate = median count rate of data. |
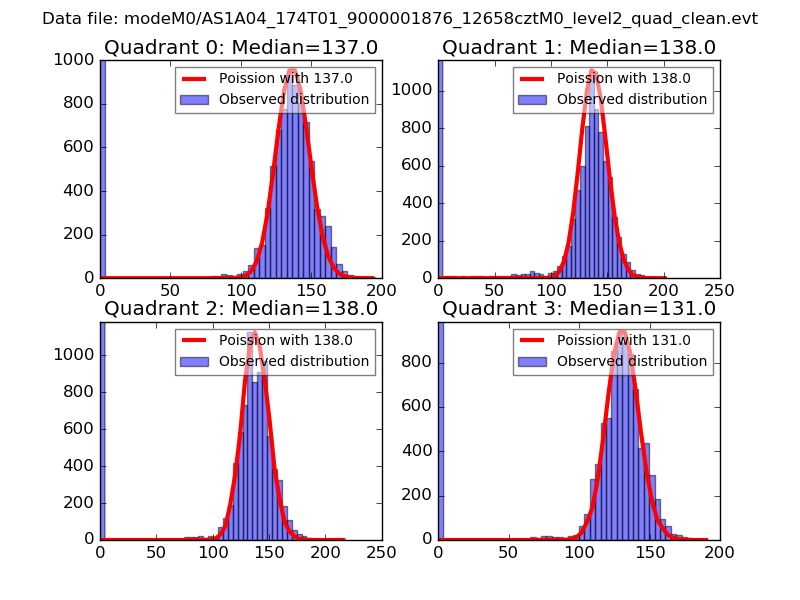 |
 |
| Quadrant-wise count rates Data is divided into 100 sec bins |
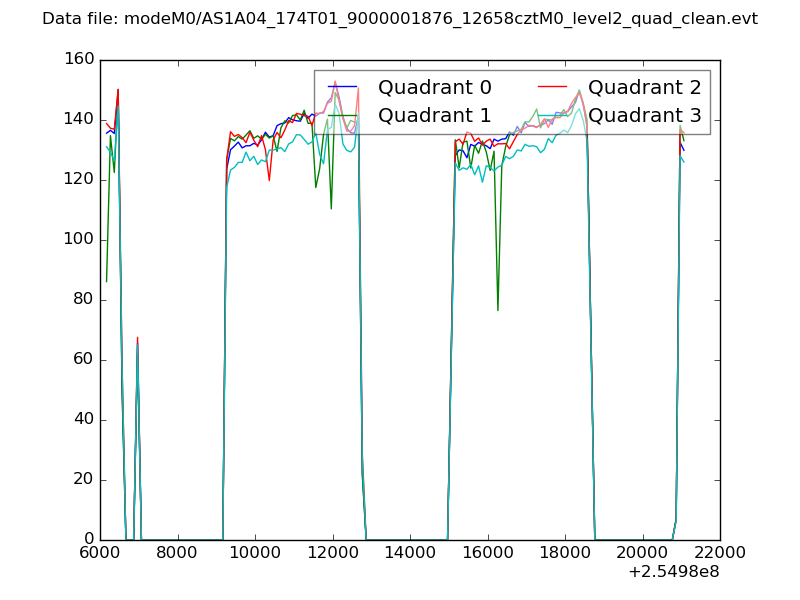 |
|
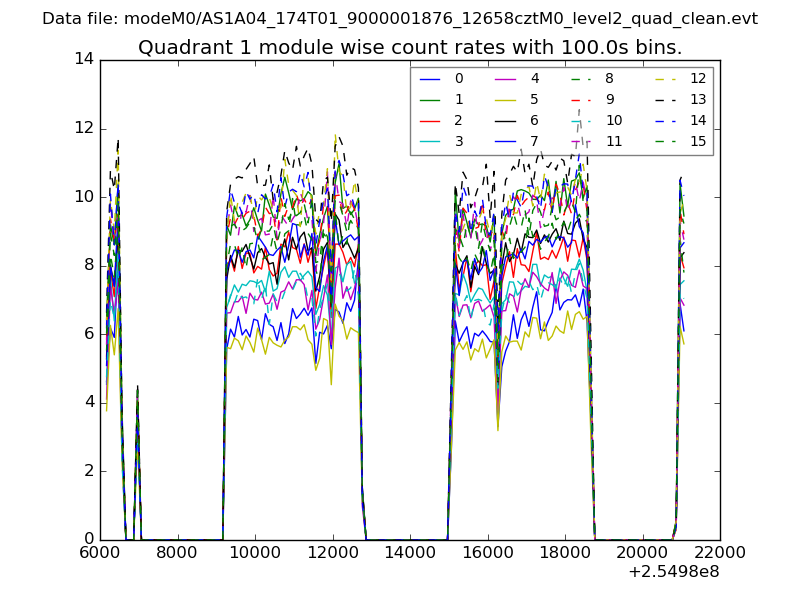
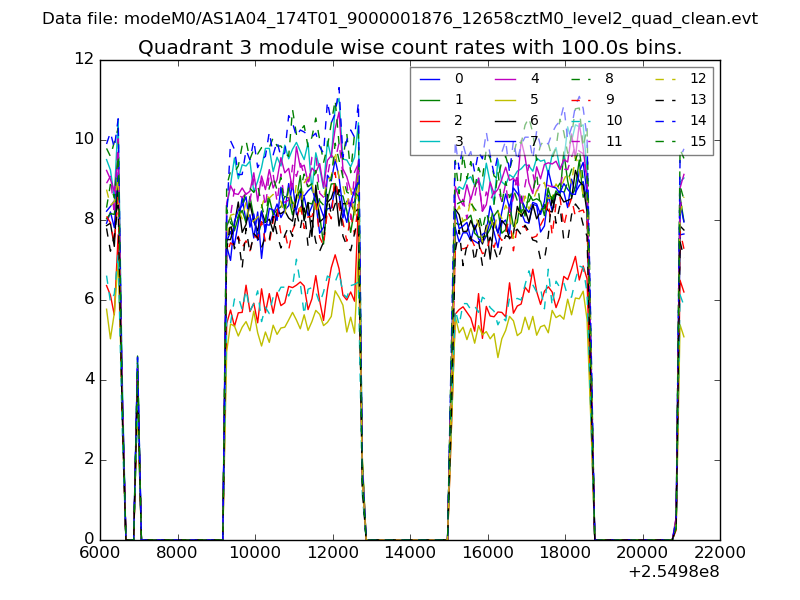
| Module-wise count rates for Quadrant A Data is divided into 100 sec bins |
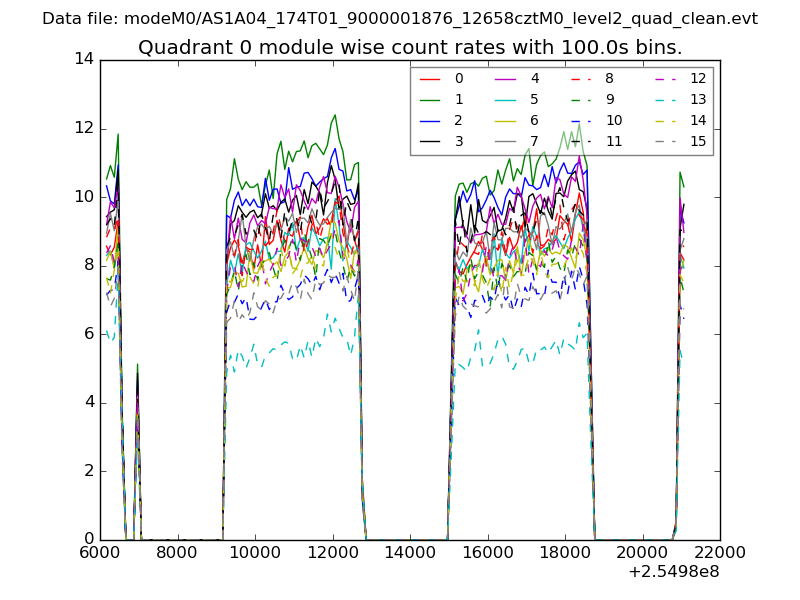 |
 |
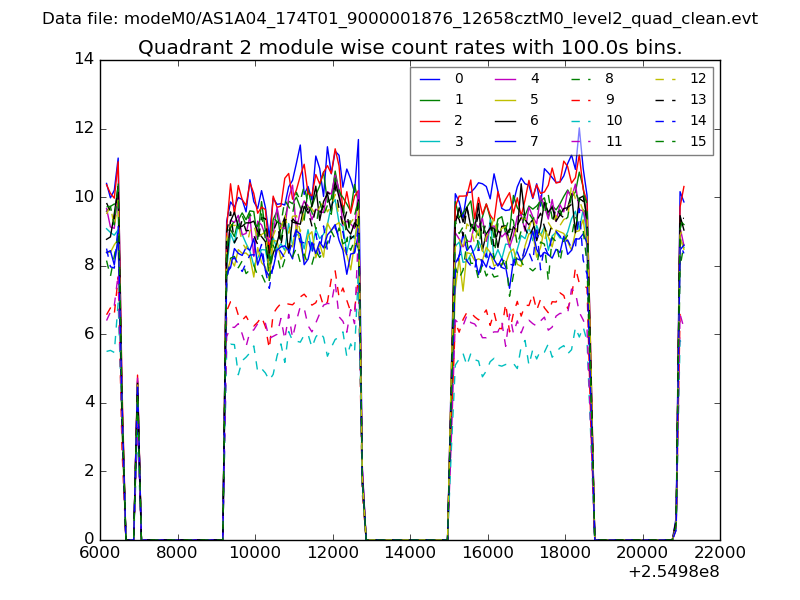
| Module-wise count rates for Quadrant B Data is divided into 100 sec bins |
 |
 |
| Module-wise count rates for Quadrant C Data is divided into 100 sec bins |
 |
 |
| Module-wise count rates for Quadrant D Data is divided into 100 sec bins |
 |
 |
| Parameter | Plot |
|---|---|
| CZT HV Monitor | 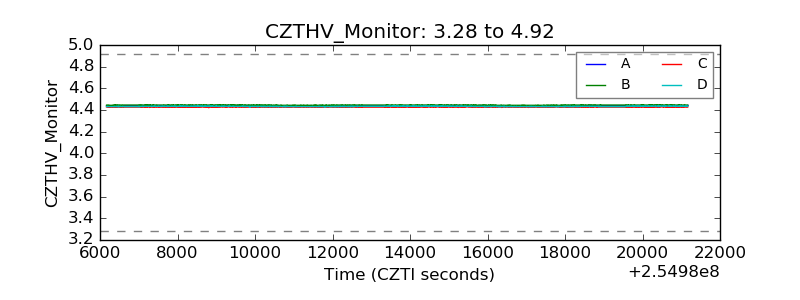 |
| D_VDD | 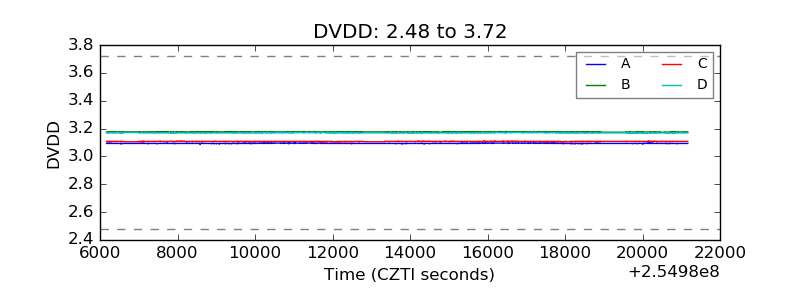 |
| Temperature 1 | 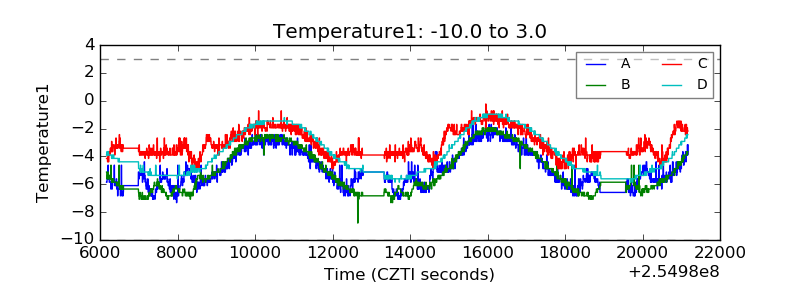 |
| Veto HV Monitor | 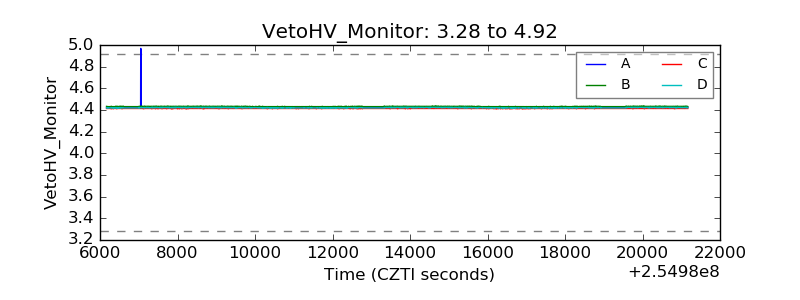 |
| Veto LLD | 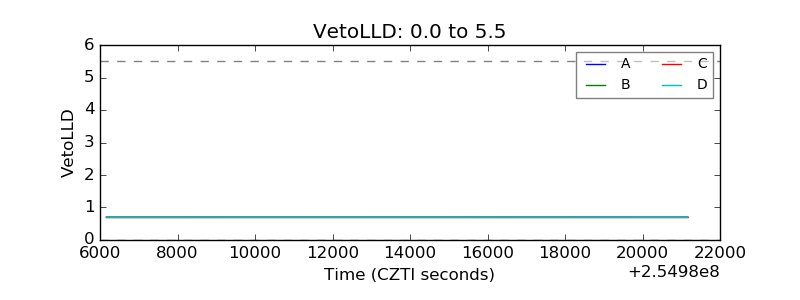 |
| Alpha Counter | 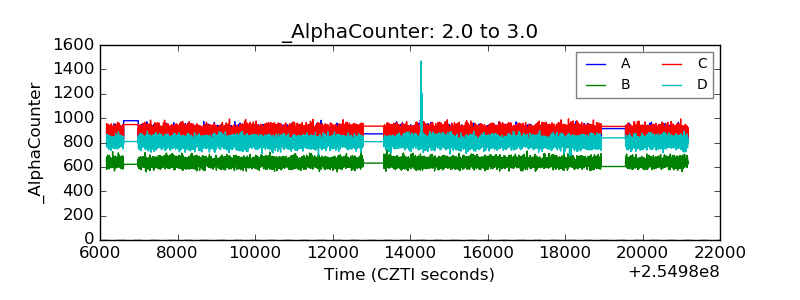 |
| _CPM_Rate | 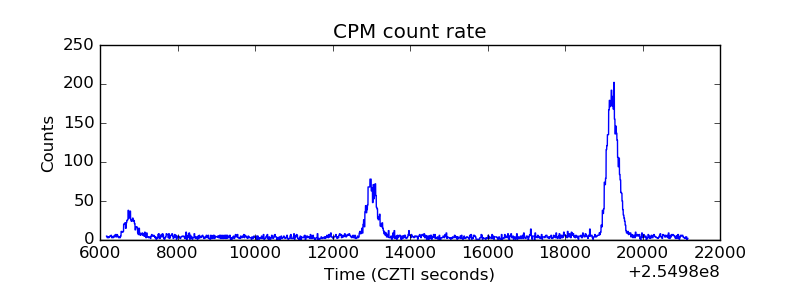 |
| CZT Counter | 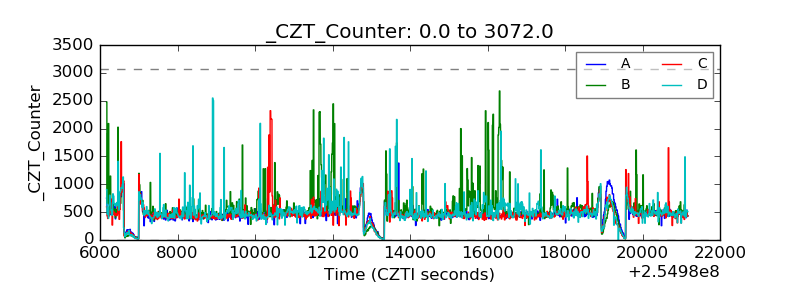 |
| +2.5 Volts monitor |  |
| +5 Volts monitor |  |
| _ROLL_ROT | 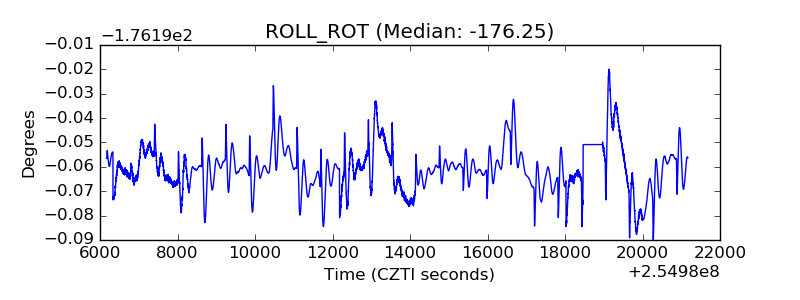 |
| _Roll_DEC | 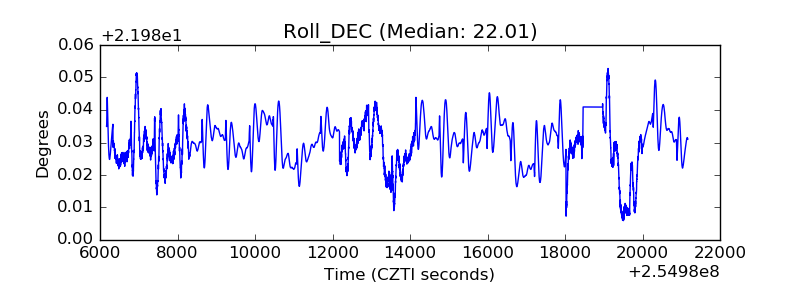 |
| _Roll_RA | 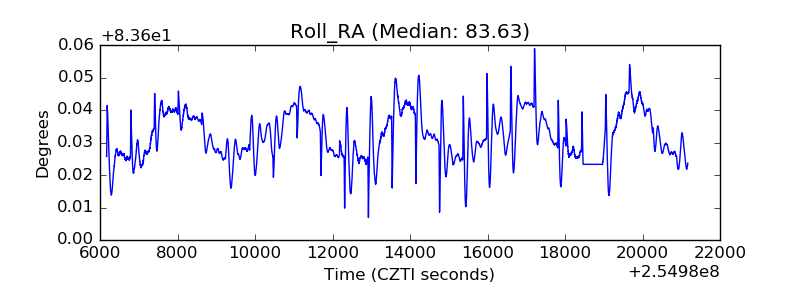 |
| Veto Counter | 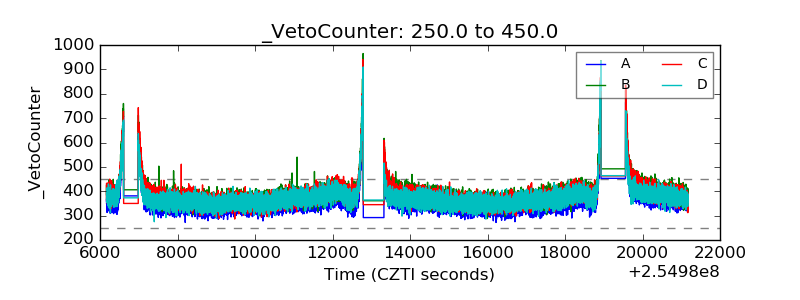 |