| Param | Original file | Final file |
|---|---|---|
| Filename | modeM0/AS1A04_174T01_9000001876_12659cztM0_level2.evt | modeM0/AS1A04_174T01_9000001876_12659cztM0_level2_quad_clean.evt |
| Size (bytes) | 550,203,840 | 88,848,000 |
| Size | 524.7 MB | 84.7 MB |
| Events in quadrant A | 3,337,453 | 568,189 |
| Events in quadrant B | 5,058,045 | 534,430 |
| Events in quadrant C | 3,345,838 | 569,042 |
| Events in quadrant D | 4,447,672 | 531,797 |
| Mode M9 | |||
|---|---|---|---|
| Quadrant | BADHDUFLAG | Total packets | Discarded packets |
| A | 0 | 11 | 0 |
| B | 0 | 11 | 0 |
| C | 0 | 11 | 0 |
| D | 0 | 12 | 0 |
| Mode M0 | |||
|---|---|---|---|
| Quadrant | BADHDUFLAG | Total packets | Discarded packets |
| A | 0 | 14285 | 3 |
| B | 0 | 19250 | 2 |
| C | 0 | 14416 | 2 |
| D | 0 | 17952 | 2 |
| Mode SS | |||
|---|---|---|---|
| Quadrant | BADHDUFLAG | Total packets | Discarded packets |
| A | 0 | 142 | 0 |
| B | 0 | 142 | 0 |
| C | 0 | 142 | 0 |
| D | 0 | 142 | 0 |
| Quadrant | Total seconds | Saturated seconds | Saturation percentage |
|---|---|---|---|
| A | 6988 | 98 | 1.402404% |
| B | 6988 | 649 | 9.287350% |
| C | 6988 | 77 | 1.101889% |
| D | 6988 | 263 | 3.763595% |
Noise dominated data is calculated using 1-second bins in cleaned event files. If a bin has >2000 counts, and if more than 50% of those come from <1% of pixels, then it is considered to be noise-dominated and hence unusable.
| Quadrant | # 1 sec bins | Bins with >0 counts | Bins with >2000 counts | High rate bins dominated by noise | Noise dominated (total time) | Noise dominated (detector-on time) | Marked lightcurve |
|---|---|---|---|---|---|---|---|
| A | 7819 | 6989 | 0 | 0 | 0.00% | 0.00% | 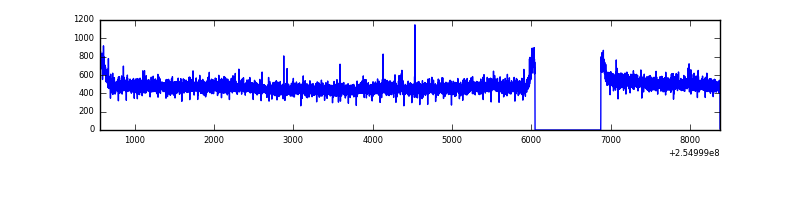 |
| B | 7819 | 6989 | 479 | 479 | 6.13% | 6.85% | 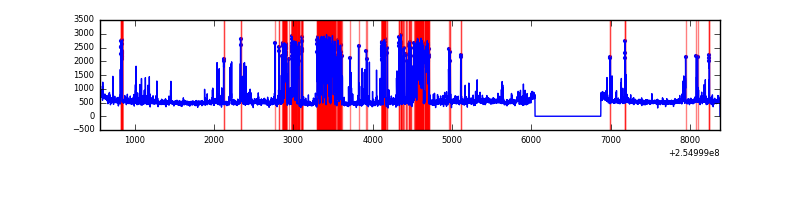 |
| C | 7819 | 6989 | 3 | 3 | 0.04% | 0.04% |  |
| D | 7819 | 6989 | 190 | 190 | 2.43% | 2.72% | 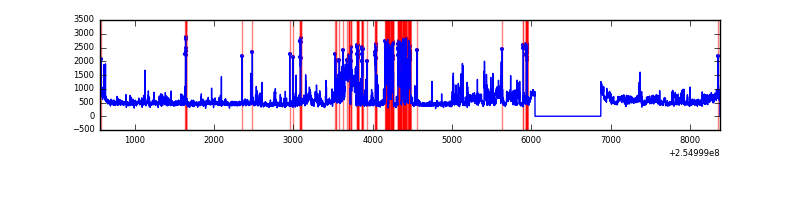 |
Top three noisy pixels from each quadrant. If the there are fewer than three noisy pixels in the level2.evt file, extra rows are filled as -1
| Pixel properties | Quadrant properties | ||||||
|---|---|---|---|---|---|---|---|
| Quadrant | DetID | PixID | Counts | Sigma | Mean | Median | Sigma |
| A | 8 | 15 | 11637 | 61.16 | 862 | 846 | 176.4 |
| A | 12 | 189 | 8607 | 43.99 | 862 | 846 | 176.4 |
| A | 0 | 226 | 7666 | 38.65 | 862 | 846 | 176.4 |
| B | 4 | 239 | 1561857 | 9709.6 | 833 | 811 | 160.8 |
| B | 11 | 51 | 120954 | 747.28 | 833 | 811 | 160.8 |
| B | 3 | 64 | 73468 | 451.92 | 833 | 811 | 160.8 |
| C | 15 | 208 | 53683 | 270.88 | 839 | 844 | 195.1 |
| C | 14 | 234 | 19082 | 93.5 | 839 | 844 | 195.1 |
| C | 13 | 61 | 6263 | 27.78 | 839 | 844 | 195.1 |
| D | 1 | 52 | 890282 | 4438.88 | 827 | 806 | 200.4 |
| D | 10 | 157 | 320238 | 1594.11 | 827 | 806 | 200.4 |
| D | 13 | 249 | 38291 | 187.07 | 827 | 806 | 200.4 |
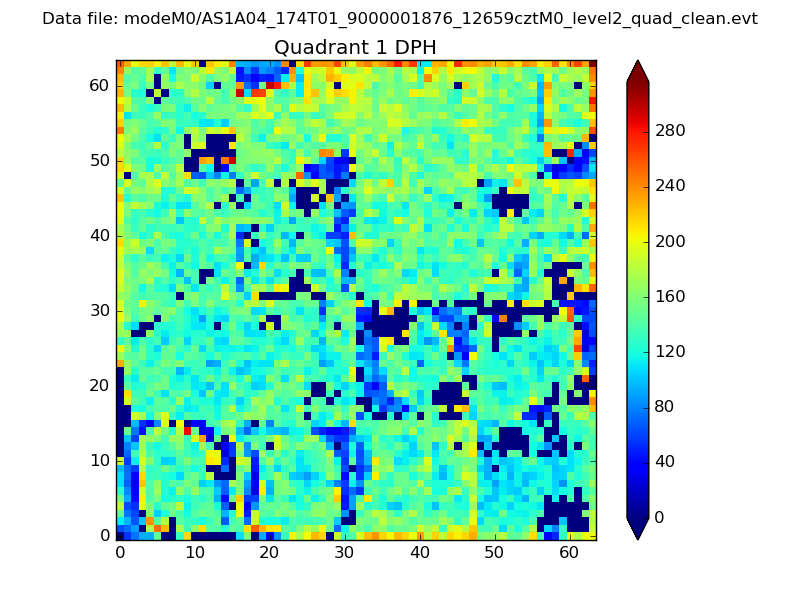
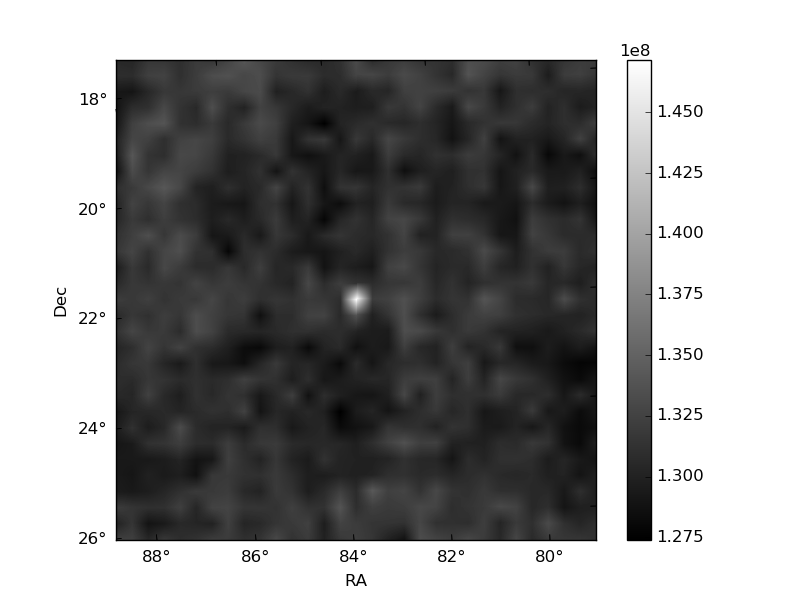
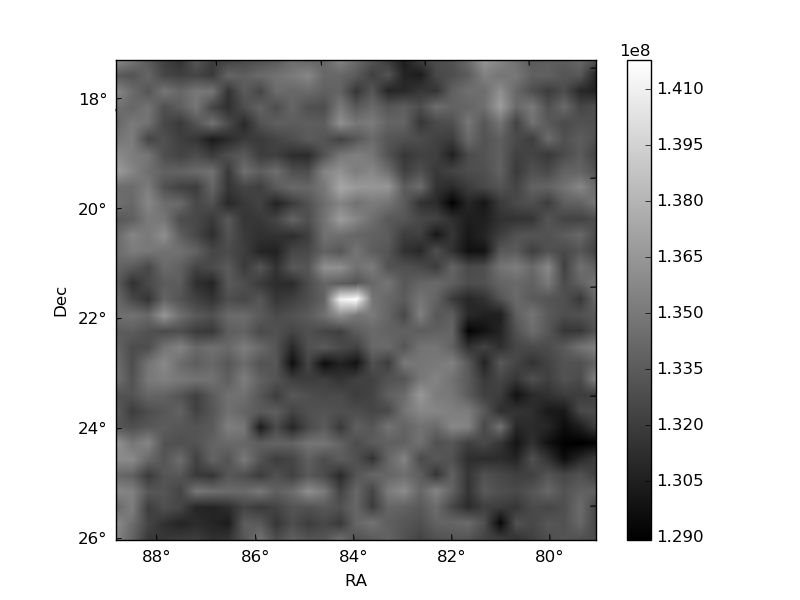
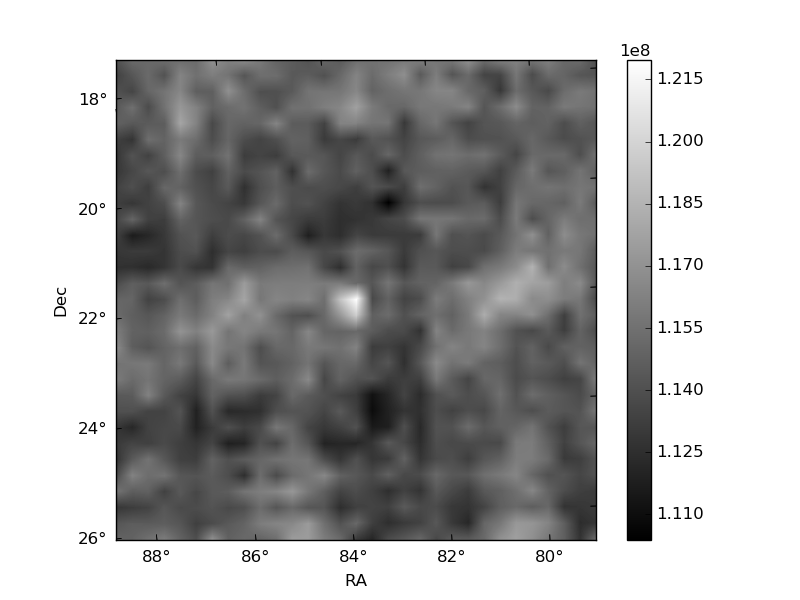
Histogram calculated using DETX and DETY for each event in the final _common_clean file
| Quadrant A | 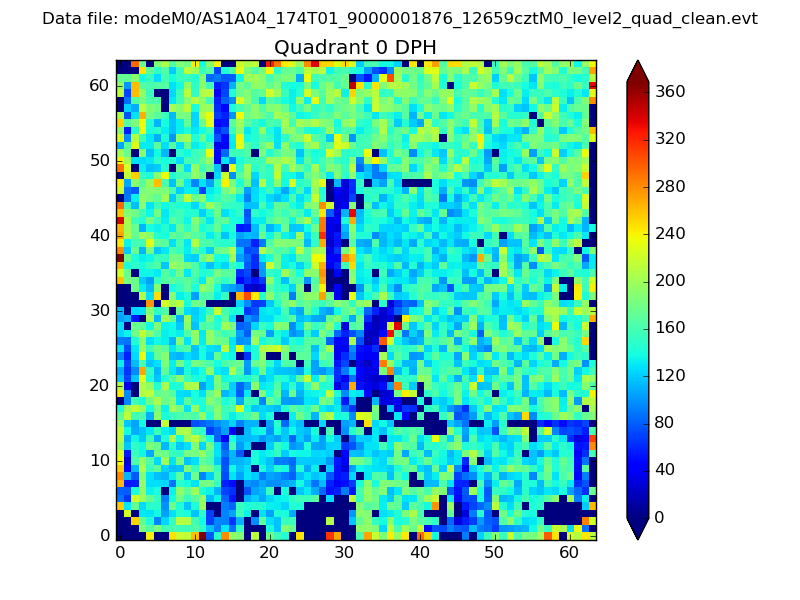 |
 |
Quadrant B |
|---|---|---|---|
| Quadrant D | 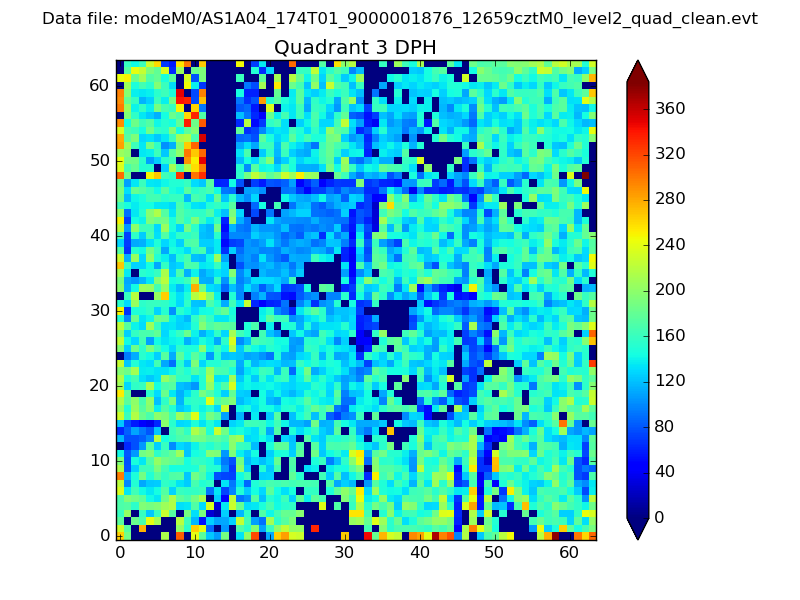 |
 |
Quadrant C |
| Plot type | Count rate plots | Images |
|---|---|---|
| Comparison with Poisson distribution Blue bars denote a histogram of data divided into 1 sec bins. Red curve is a Poisson curve with rate = median count rate of data. |
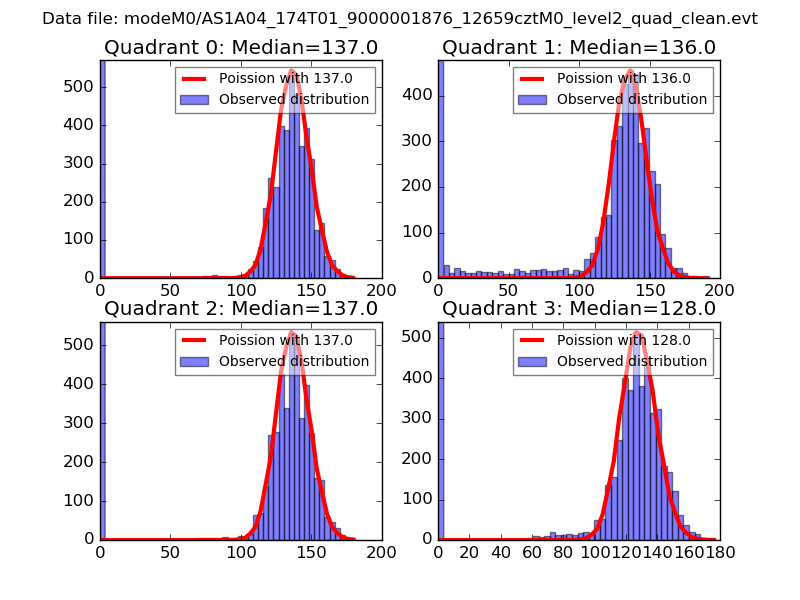 |
 |
| Quadrant-wise count rates Data is divided into 100 sec bins |
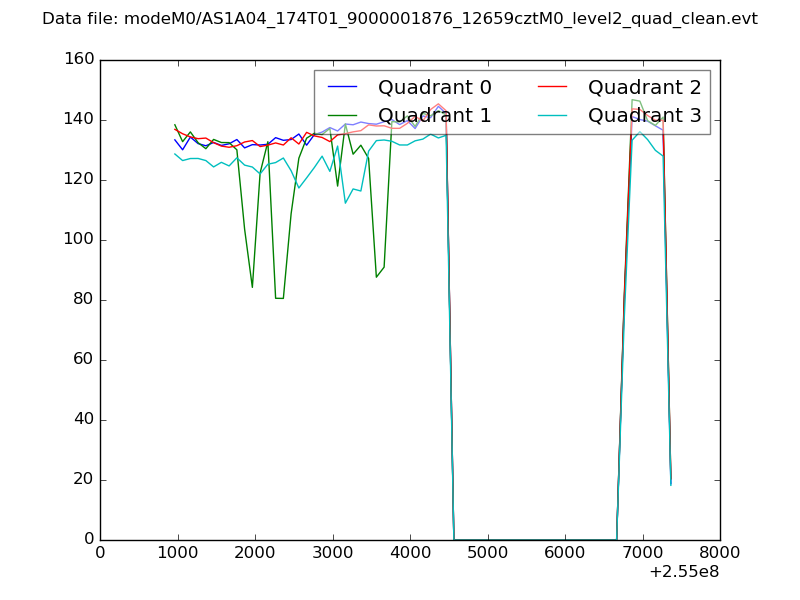 |
|
| Module-wise count rates for Quadrant A Data is divided into 100 sec bins |
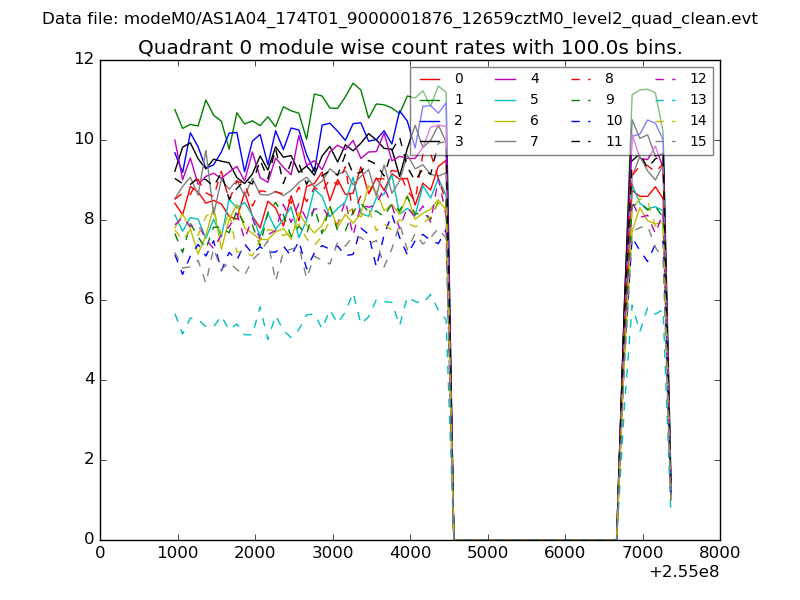 |
 |
| Module-wise count rates for Quadrant B Data is divided into 100 sec bins |
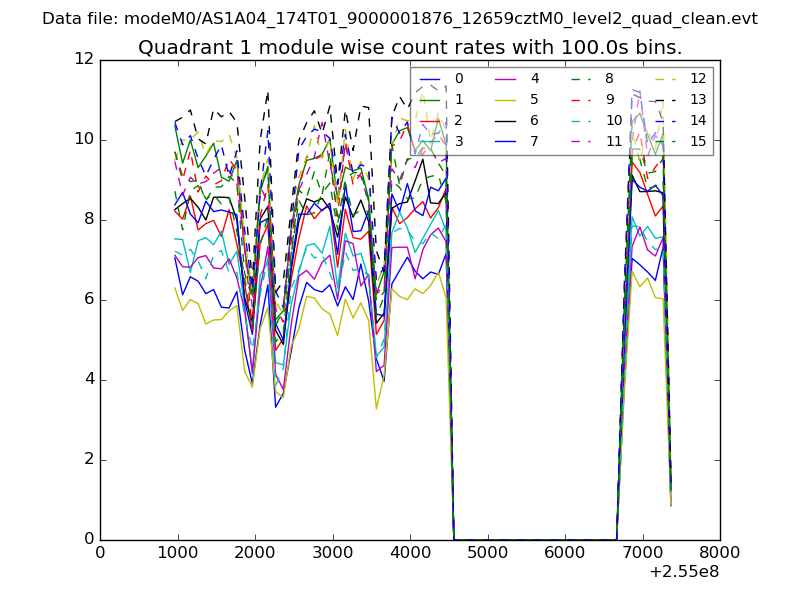 |
 |
| Module-wise count rates for Quadrant C Data is divided into 100 sec bins |
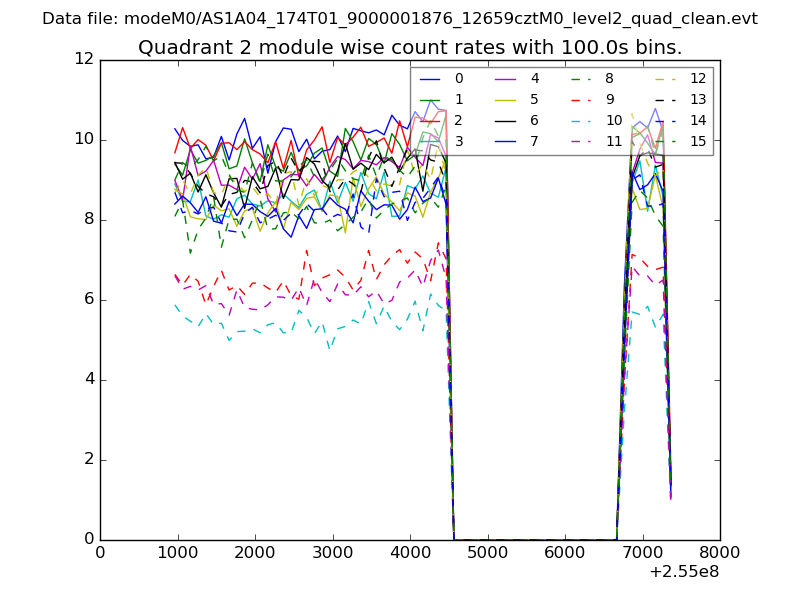 |
 |
| Module-wise count rates for Quadrant D Data is divided into 100 sec bins |
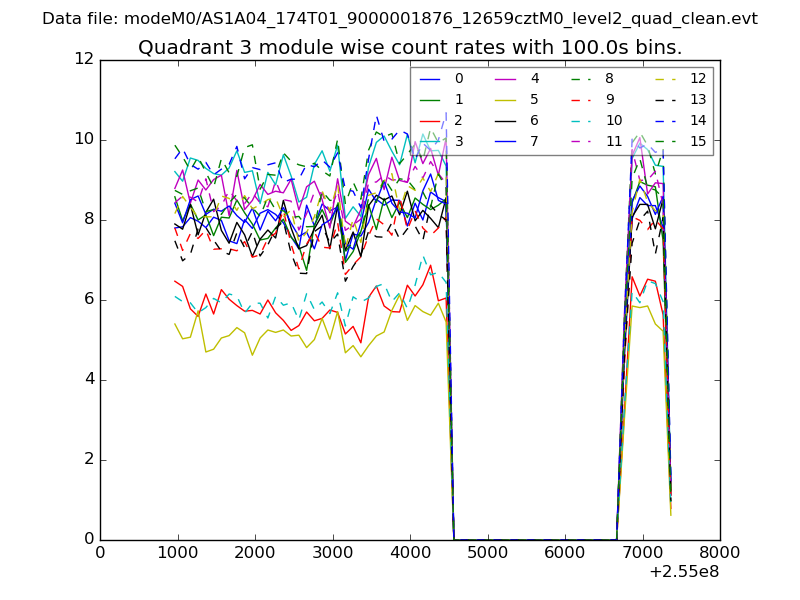 |
 |
| Parameter | Plot |
|---|---|
| CZT HV Monitor | 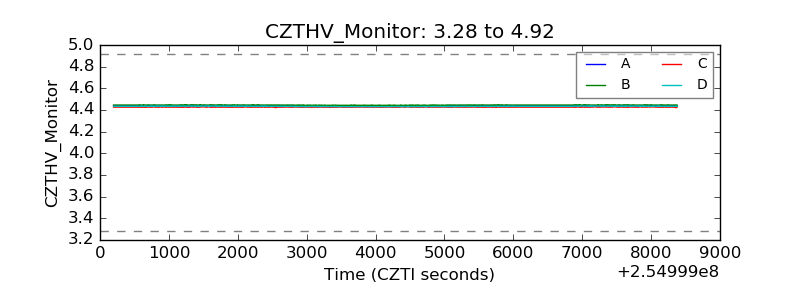 |
| D_VDD | 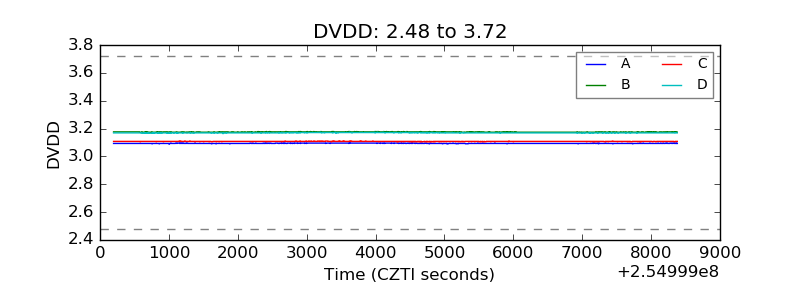 |
| Temperature 1 | 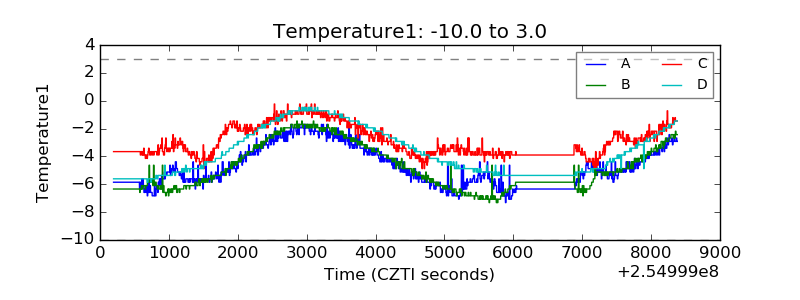 |
| Veto HV Monitor | 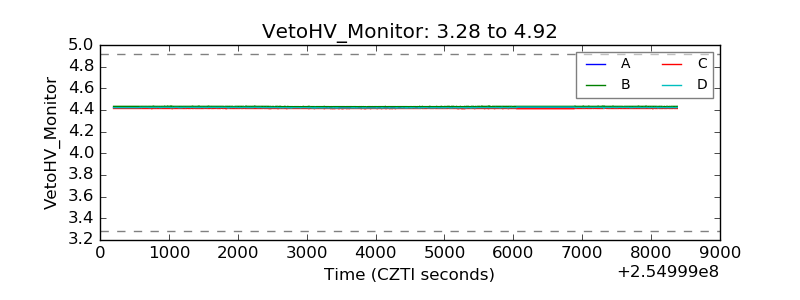 |
| Veto LLD | 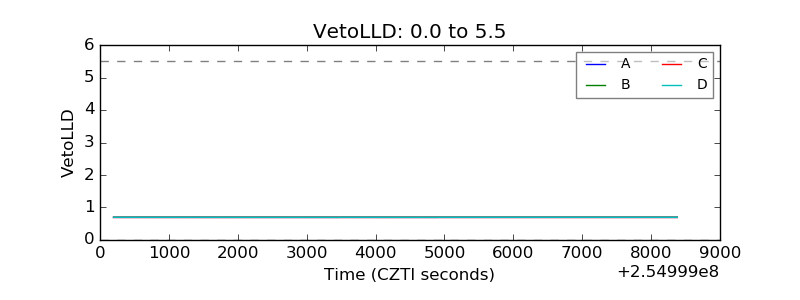 |
| Alpha Counter | 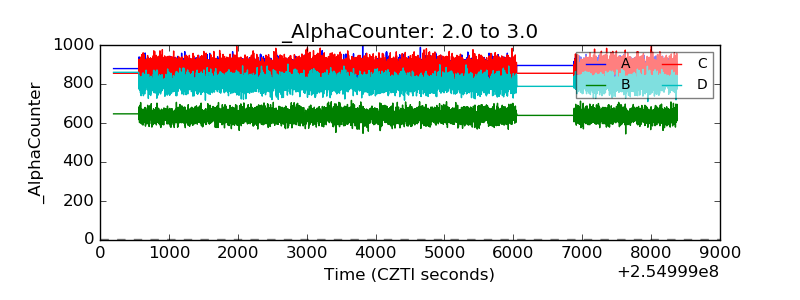 |
| _CPM_Rate | 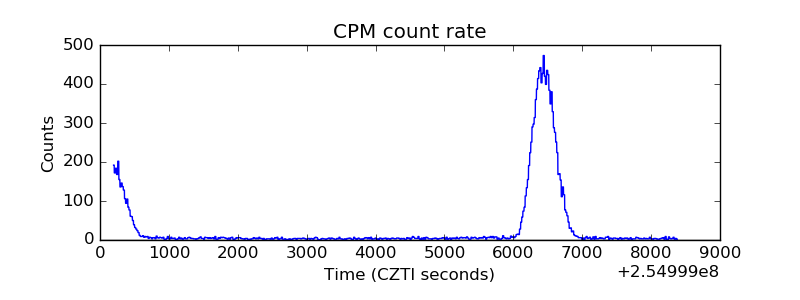 |
| CZT Counter |  |
| +2.5 Volts monitor |  |
| +5 Volts monitor |  |
| _ROLL_ROT | 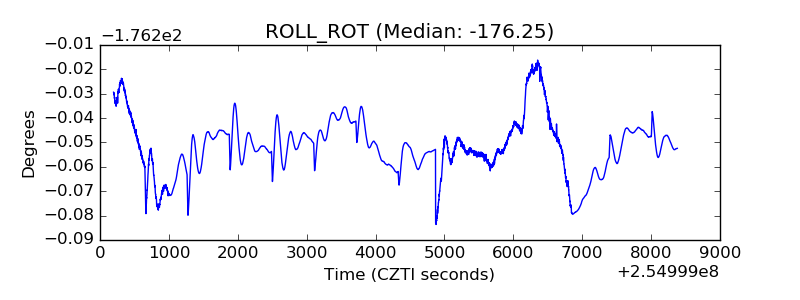 |
| _Roll_DEC | 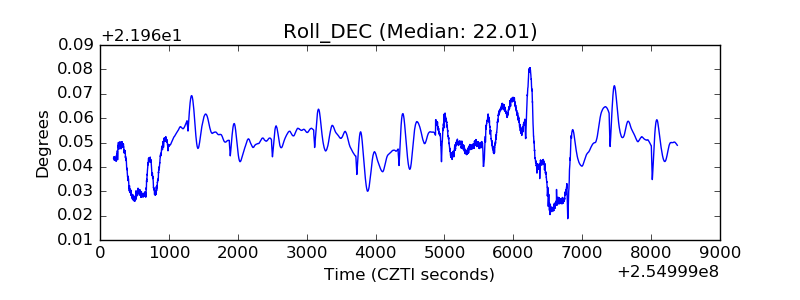 |
| _Roll_RA | 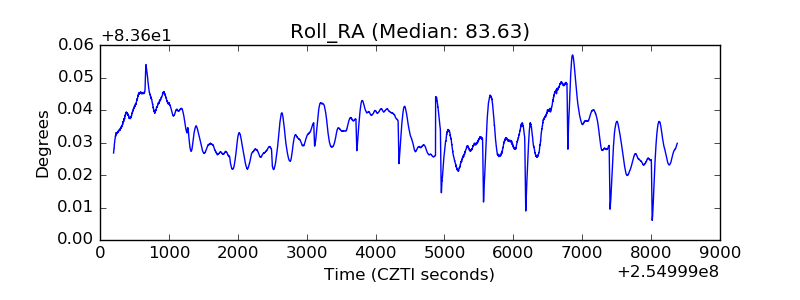 |
| Veto Counter | 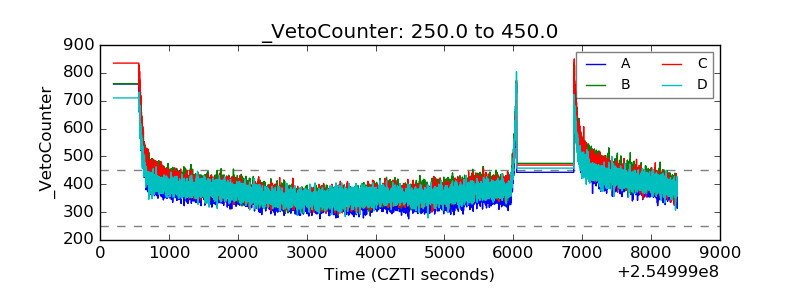 |