| Param | Original file | Final file |
|---|---|---|
| Filename | modeM0/AS1A04_174T01_9000001876_12660cztM0_level2.evt | modeM0/AS1A04_174T01_9000001876_12660cztM0_level2_quad_clean.evt |
| Size (bytes) | 524,753,280 | 96,399,360 |
| Size | 500.4 MB | 91.9 MB |
| Events in quadrant A | 3,288,353 | 632,802 |
| Events in quadrant B | 5,091,089 | 591,046 |
| Events in quadrant C | 3,521,099 | 625,471 |
| Events in quadrant D | 3,535,806 | 601,780 |
| Mode M9 | |||
|---|---|---|---|
| Quadrant | BADHDUFLAG | Total packets | Discarded packets |
| A | 0 | 15 | 0 |
| B | 0 | 15 | 0 |
| C | 0 | 15 | 0 |
| D | 0 | 16 | 0 |
| Mode M0 | |||
|---|---|---|---|
| Quadrant | BADHDUFLAG | Total packets | Discarded packets |
| A | 0 | 13953 | 3 |
| B | 0 | 19310 | 2 |
| C | 0 | 14762 | 2 |
| D | 0 | 15081 | 2 |
| Mode SS | |||
|---|---|---|---|
| Quadrant | BADHDUFLAG | Total packets | Discarded packets |
| A | 0 | 138 | 0 |
| B | 0 | 138 | 0 |
| C | 0 | 138 | 0 |
| D | 0 | 138 | 0 |
| Quadrant | Total seconds | Saturated seconds | Saturation percentage |
|---|---|---|---|
| A | 6709 | 96 | 1.430914% |
| B | 6709 | 711 | 10.597705% |
| C | 6709 | 131 | 1.952601% |
| D | 6709 | 88 | 1.311671% |
Noise dominated data is calculated using 1-second bins in cleaned event files. If a bin has >2000 counts, and if more than 50% of those come from <1% of pixels, then it is considered to be noise-dominated and hence unusable.
| Quadrant | # 1 sec bins | Bins with >0 counts | Bins with >2000 counts | High rate bins dominated by noise | Noise dominated (total time) | Noise dominated (detector-on time) | Marked lightcurve |
|---|---|---|---|---|---|---|---|
| A | 7690 | 6710 | 0 | 0 | 0.00% | 0.00% | 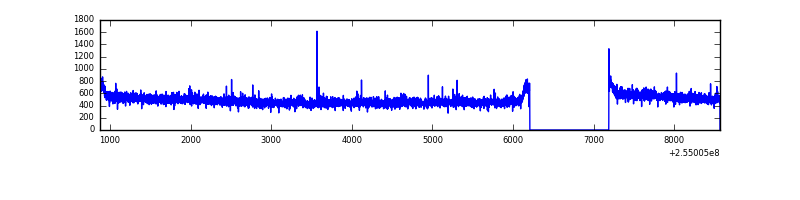 |
| B | 7690 | 6710 | 528 | 528 | 6.87% | 7.87% | 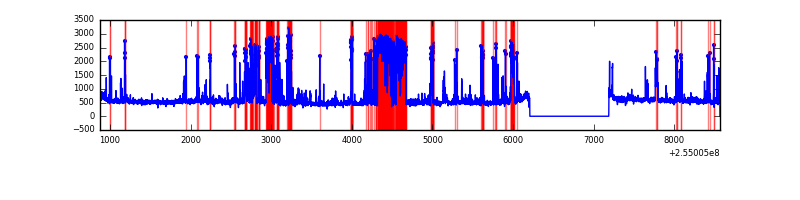 |
| C | 7690 | 6710 | 60 | 60 | 0.78% | 0.89% | 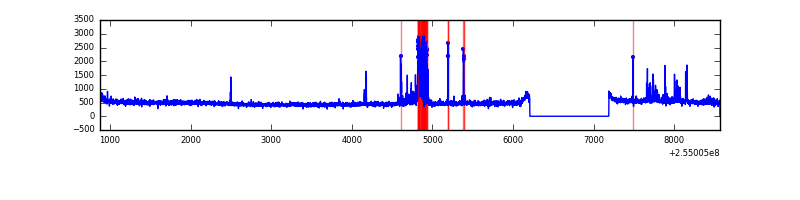 |
| D | 7690 | 6710 | 7 | 7 | 0.09% | 0.10% |  |
Top three noisy pixels from each quadrant. If the there are fewer than three noisy pixels in the level2.evt file, extra rows are filled as -1
| Pixel properties | Quadrant properties | ||||||
|---|---|---|---|---|---|---|---|
| Quadrant | DetID | PixID | Counts | Sigma | Mean | Median | Sigma |
| A | 8 | 15 | 27022 | 150.17 | 847 | 831 | 174.4 |
| A | 12 | 189 | 8574 | 44.4 | 847 | 831 | 174.4 |
| A | 0 | 226 | 7500 | 38.24 | 847 | 831 | 174.4 |
| B | 4 | 239 | 1742422 | 11213.18 | 807 | 789 | 155.3 |
| B | 11 | 51 | 92880 | 592.91 | 807 | 789 | 155.3 |
| B | 3 | 64 | 34771 | 218.79 | 807 | 789 | 155.3 |
| C | 15 | 208 | 327583 | 1732.46 | 815 | 823 | 188.6 |
| C | 14 | 234 | 12715 | 63.05 | 815 | 823 | 188.6 |
| C | 13 | 61 | 5980 | 27.34 | 815 | 823 | 188.6 |
| D | 10 | 157 | 300416 | 1521.48 | 816 | 794 | 196.9 |
| D | 1 | 52 | 42229 | 210.41 | 816 | 794 | 196.9 |
| D | 13 | 104 | 35425 | 175.86 | 816 | 794 | 196.9 |
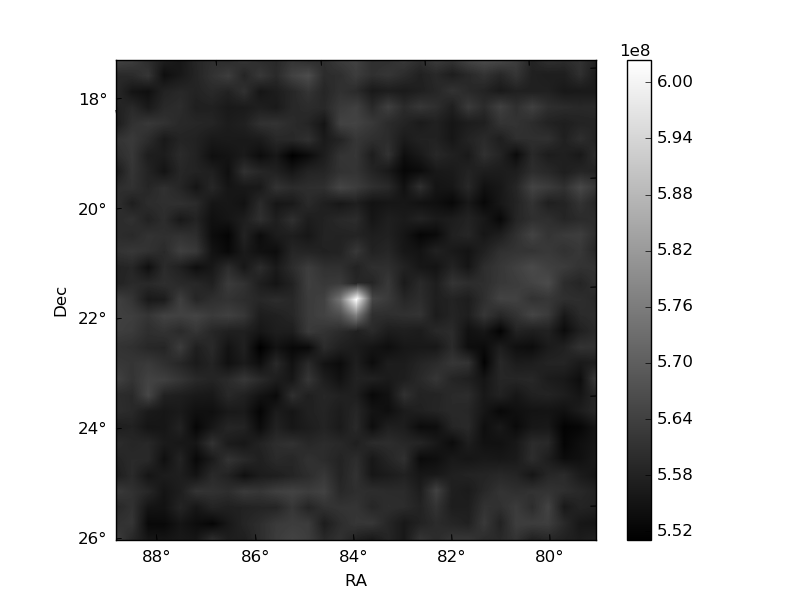
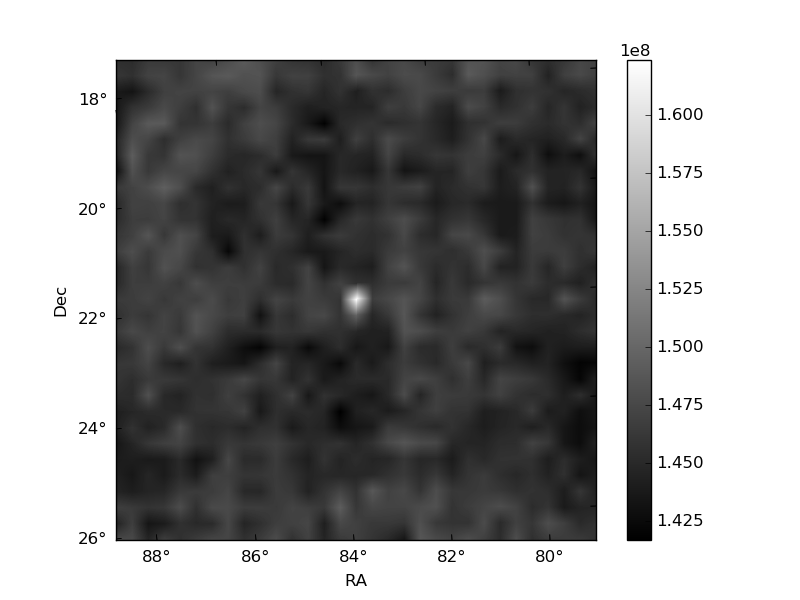
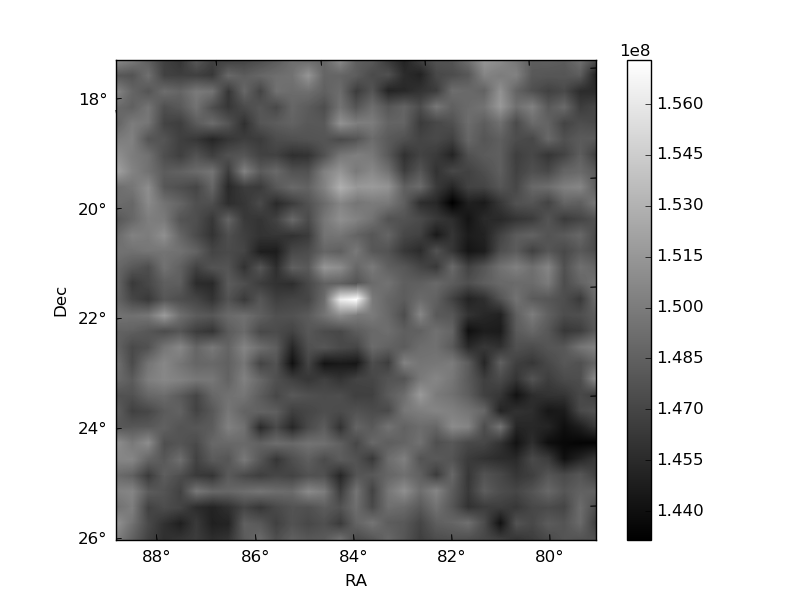
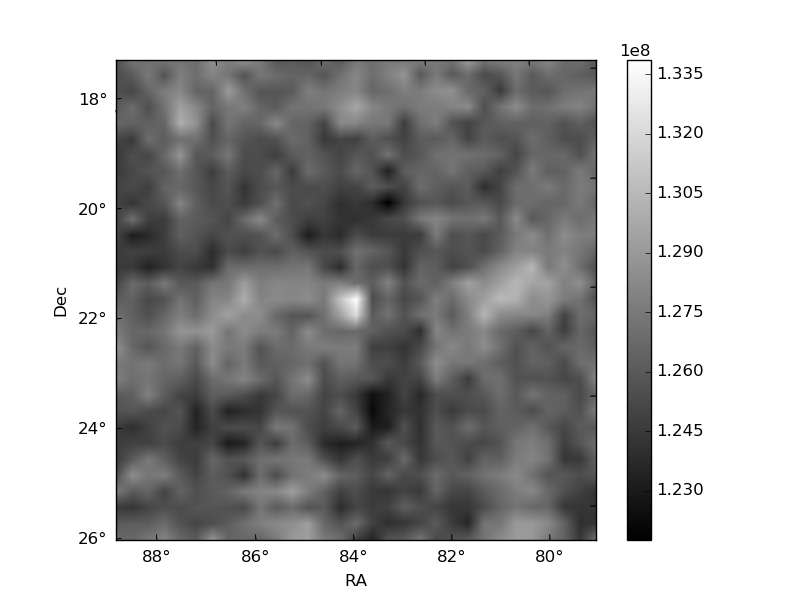
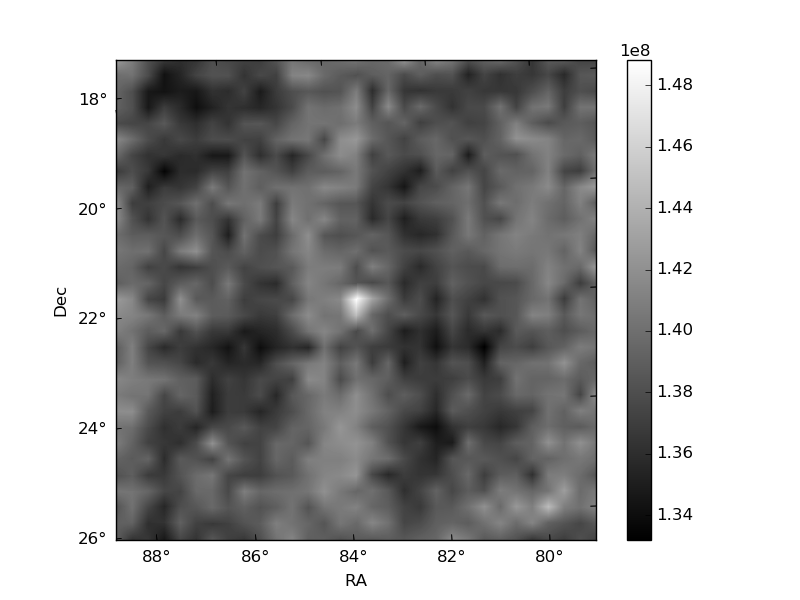
Histogram calculated using DETX and DETY for each event in the final _common_clean file
| Quadrant A |  |
 |
Quadrant B |
|---|---|---|---|
| Quadrant D |  |
 |
Quadrant C |
| Plot type | Count rate plots | Images |
|---|---|---|
| Comparison with Poisson distribution Blue bars denote a histogram of data divided into 1 sec bins. Red curve is a Poisson curve with rate = median count rate of data. |
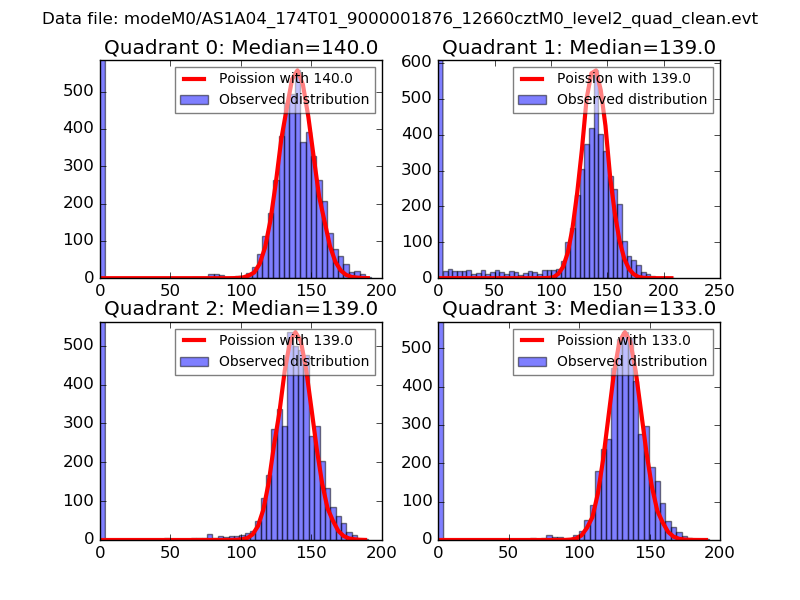 |
 |
| Quadrant-wise count rates Data is divided into 100 sec bins |
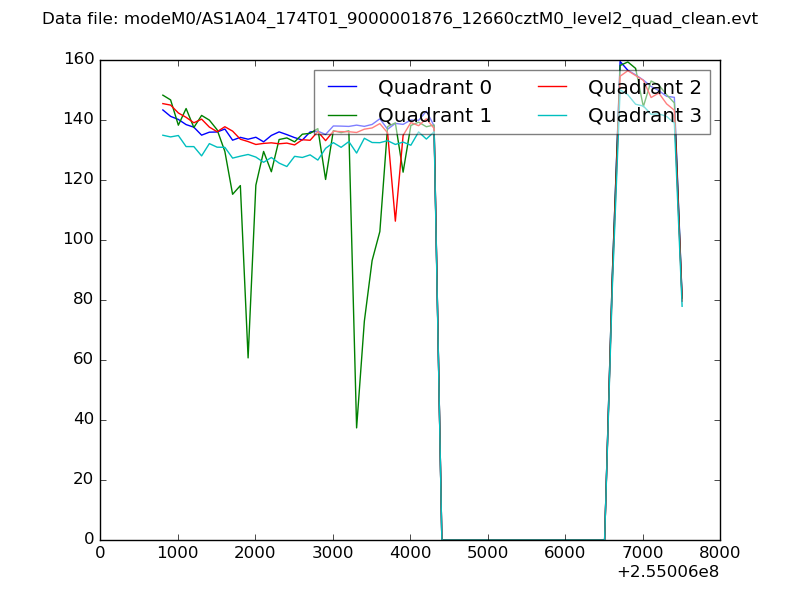 |
|
| Module-wise count rates for Quadrant A Data is divided into 100 sec bins |
 |
 |
| Module-wise count rates for Quadrant B Data is divided into 100 sec bins |
 |
 |
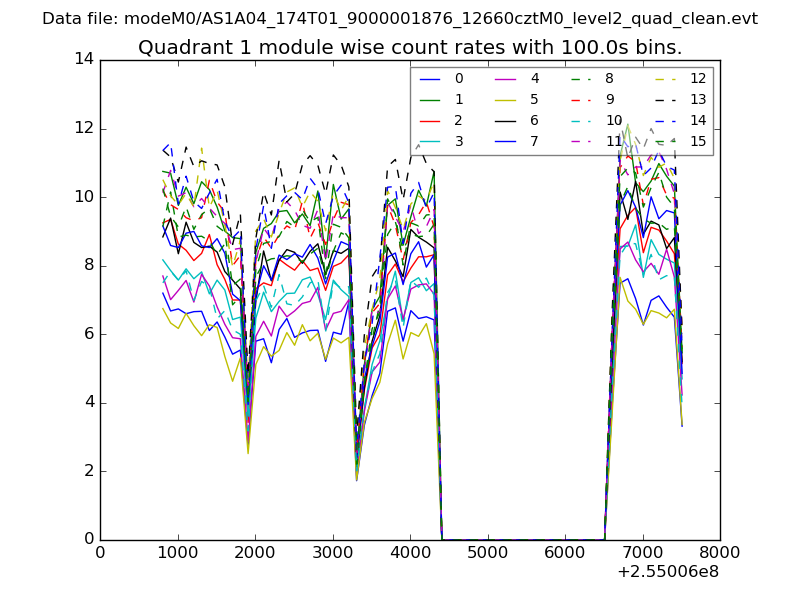
| Module-wise count rates for Quadrant C Data is divided into 100 sec bins |
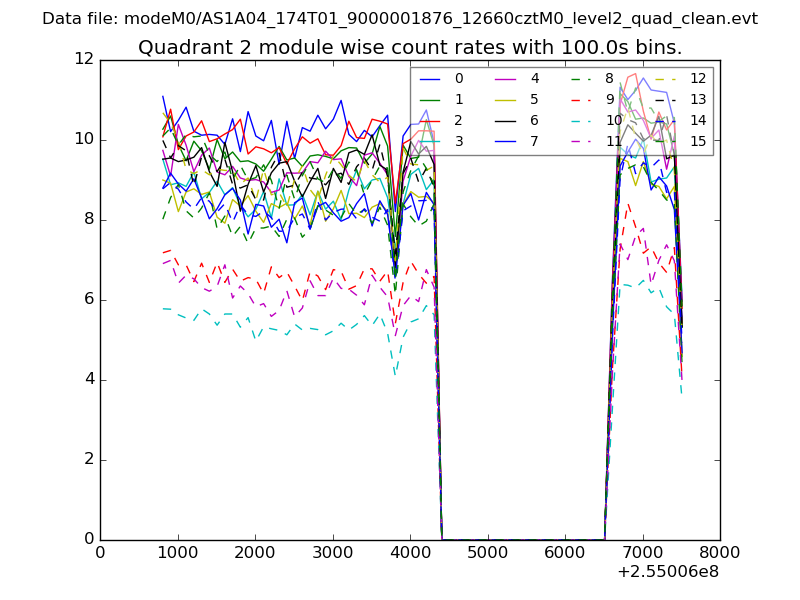 |
 |
| Module-wise count rates for Quadrant D Data is divided into 100 sec bins |
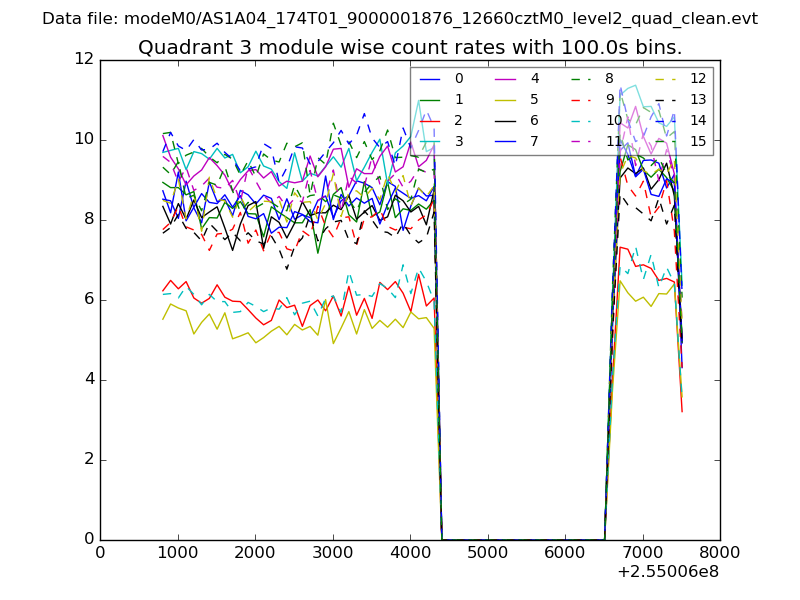 |
 |
| Parameter | Plot |
|---|---|
| CZT HV Monitor | 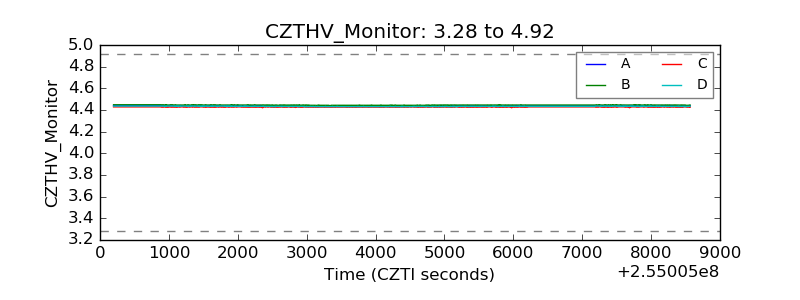 |
| D_VDD | 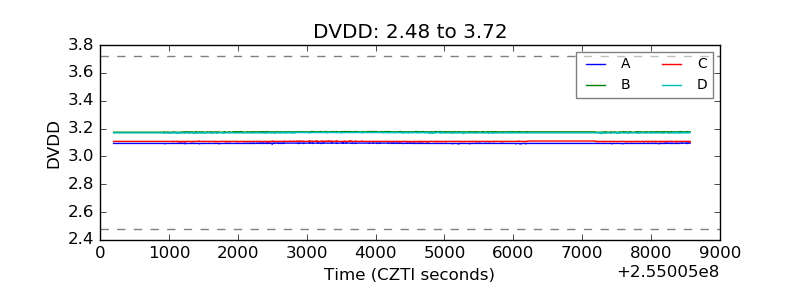 |
| Temperature 1 | 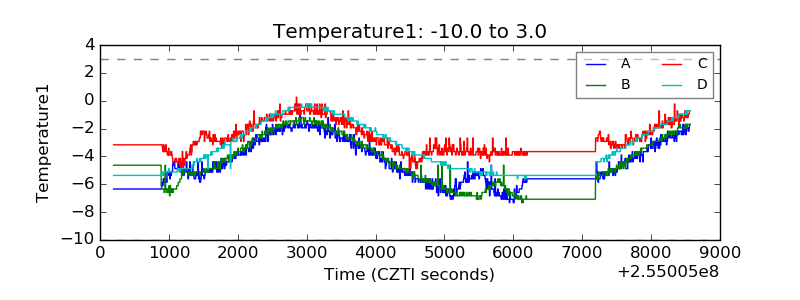 |
| Veto HV Monitor | 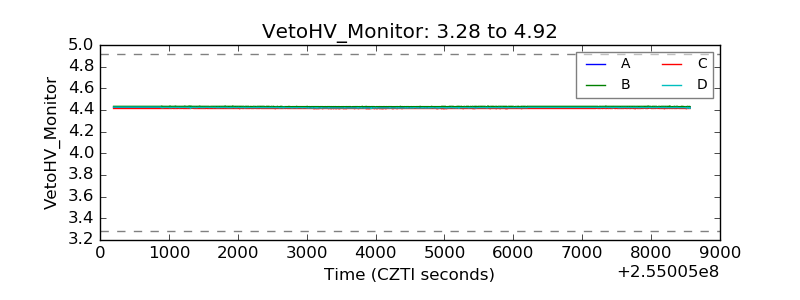 |
| Veto LLD | 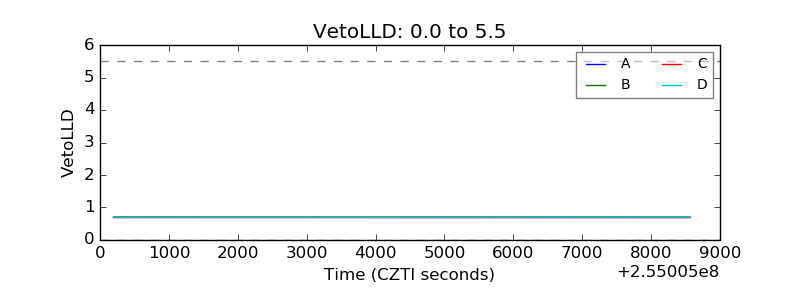 |
| Alpha Counter | 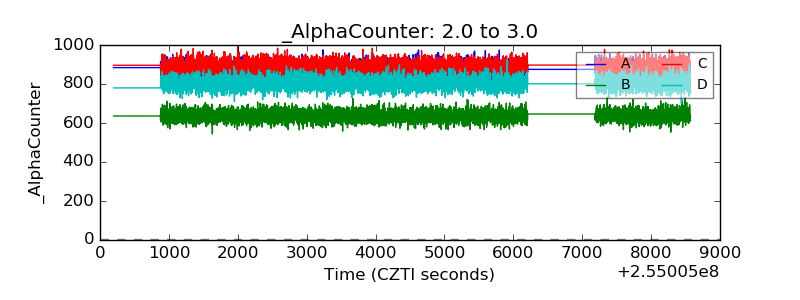 |
| _CPM_Rate | 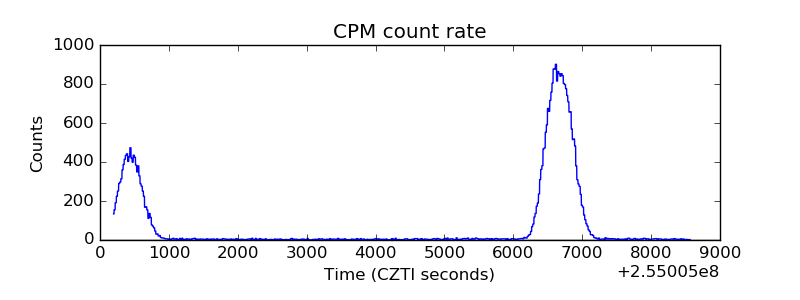 |
| CZT Counter |  |
| +2.5 Volts monitor |  |
| +5 Volts monitor |  |
| _ROLL_ROT | 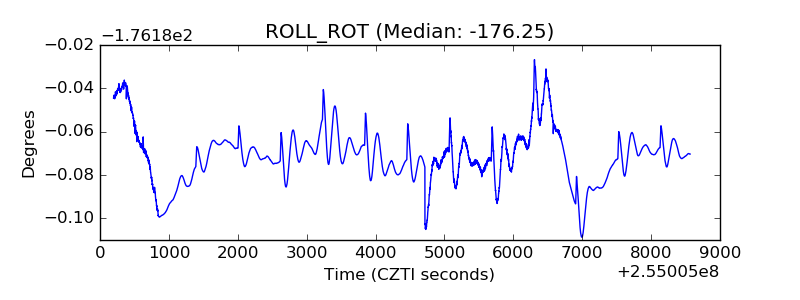 |
| _Roll_DEC | 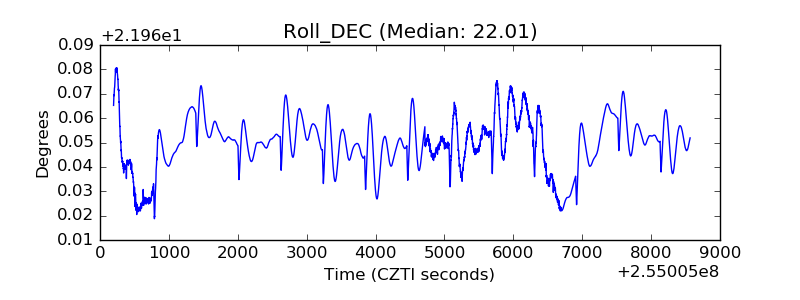 |
| _Roll_RA | 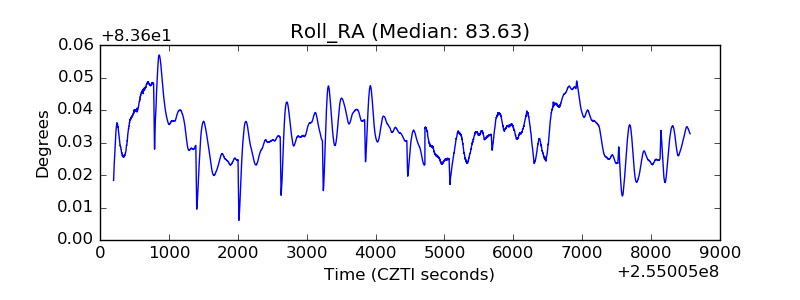 |
| Veto Counter | 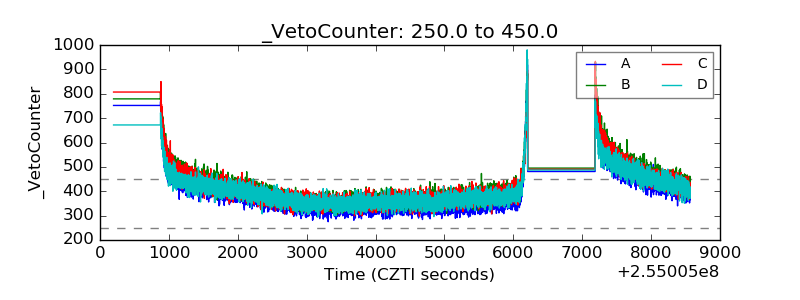 |