| Param | Original file | Final file |
|---|---|---|
| Filename | modeM0/AS1A04_174T01_9000001876_12664cztM0_level2.evt | modeM0/AS1A04_174T01_9000001876_12664cztM0_level2_quad_clean.evt |
| Size (bytes) | 459,518,400 | 93,401,280 |
| Size | 438.2 MB | 89.1 MB |
| Events in quadrant A | 2,953,758 | 637,785 |
| Events in quadrant B | 4,828,079 | 567,687 |
| Events in quadrant C | 2,853,280 | 621,639 |
| Events in quadrant D | 2,890,843 | 599,549 |
| Mode M9 | |||
|---|---|---|---|
| Quadrant | BADHDUFLAG | Total packets | Discarded packets |
| A | 0 | 12 | 0 |
| B | 0 | 12 | 0 |
| C | 0 | 12 | 0 |
| D | 0 | 12 | 0 |
| Mode M0 | |||
|---|---|---|---|
| Quadrant | BADHDUFLAG | Total packets | Discarded packets |
| A | 0 | 12316 | 2 |
| B | 0 | 18077 | 1 |
| C | 0 | 12023 | 1 |
| D | 0 | 12342 | 1 |
| Mode SS | |||
|---|---|---|---|
| Quadrant | BADHDUFLAG | Total packets | Discarded packets |
| A | 0 | 118 | 0 |
| B | 0 | 118 | 0 |
| C | 0 | 118 | 0 |
| D | 0 | 118 | 0 |
| Quadrant | Total seconds | Saturated seconds | Saturation percentage |
|---|---|---|---|
| A | 5745 | 75 | 1.305483% |
| B | 5745 | 762 | 13.263708% |
| C | 5745 | 53 | 0.922541% |
| D | 5745 | 75 | 1.305483% |
Noise dominated data is calculated using 1-second bins in cleaned event files. If a bin has >2000 counts, and if more than 50% of those come from <1% of pixels, then it is considered to be noise-dominated and hence unusable.
| Quadrant | # 1 sec bins | Bins with >0 counts | Bins with >2000 counts | High rate bins dominated by noise | Noise dominated (total time) | Noise dominated (detector-on time) | Marked lightcurve |
|---|---|---|---|---|---|---|---|
| A | 7036 | 5746 | 0 | 0 | 0.00% | 0.00% | 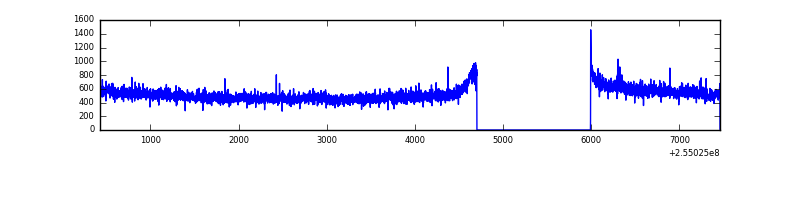 |
| B | 7036 | 5746 | 605 | 605 | 8.60% | 10.53% | 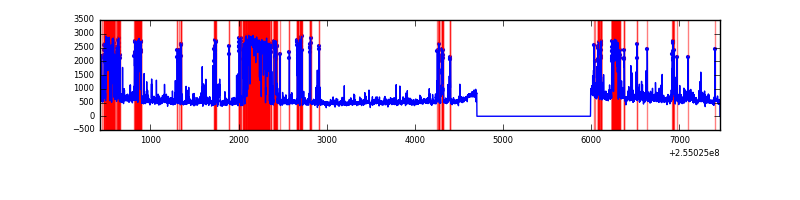 |
| C | 7036 | 5746 | 5 | 5 | 0.07% | 0.09% | 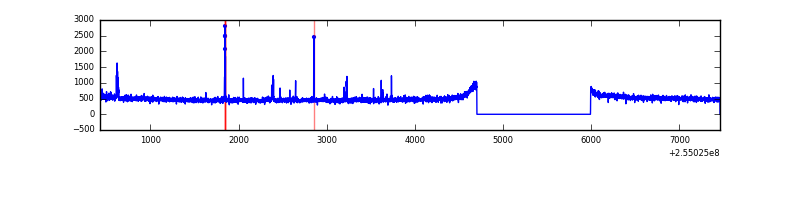 |
| D | 7036 | 5746 | 15 | 15 | 0.21% | 0.26% | 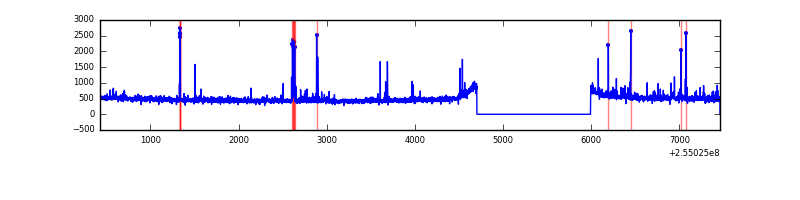 |
Top three noisy pixels from each quadrant. If the there are fewer than three noisy pixels in the level2.evt file, extra rows are filled as -1
| Pixel properties | Quadrant properties | ||||||
|---|---|---|---|---|---|---|---|
| Quadrant | DetID | PixID | Counts | Sigma | Mean | Median | Sigma |
| A | 8 | 15 | 66505 | 434.93 | 744 | 731 | 151.2 |
| A | 12 | 189 | 25047 | 160.79 | 744 | 731 | 151.2 |
| A | 0 | 226 | 6968 | 41.24 | 744 | 731 | 151.2 |
| B | 4 | 239 | 1801816 | 13816.55 | 691 | 677 | 130.4 |
| B | 11 | 51 | 102520 | 781.24 | 691 | 677 | 130.4 |
| B | 3 | 209 | 77709 | 590.91 | 691 | 677 | 130.4 |
| C | 15 | 208 | 46629 | 280.07 | 715 | 724 | 163.9 |
| C | 14 | 234 | 16445 | 95.91 | 715 | 724 | 163.9 |
| C | 13 | 61 | 5373 | 28.36 | 715 | 724 | 163.9 |
| D | 13 | 249 | 46330 | 245.84 | 713 | 700 | 185.6 |
| D | 1 | 52 | 37527 | 198.42 | 713 | 700 | 185.6 |
| D | 13 | 104 | 27166 | 142.59 | 713 | 700 | 185.6 |
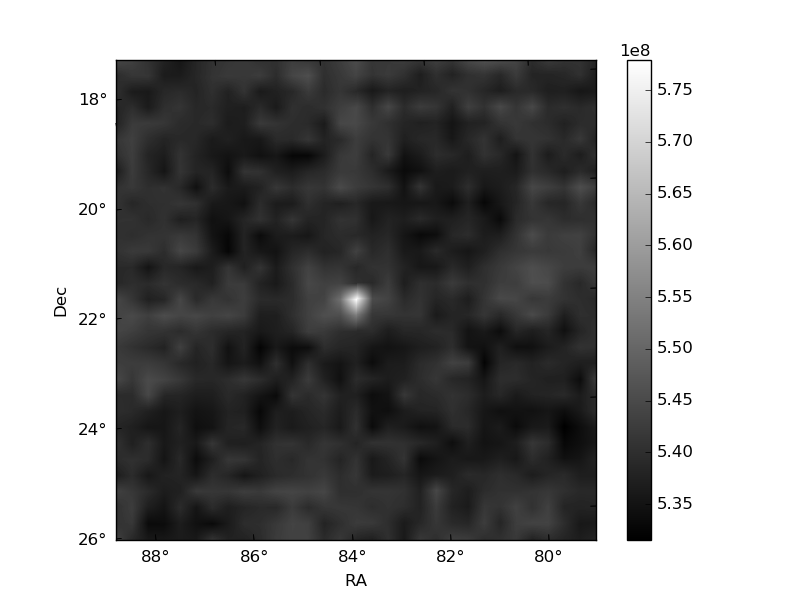
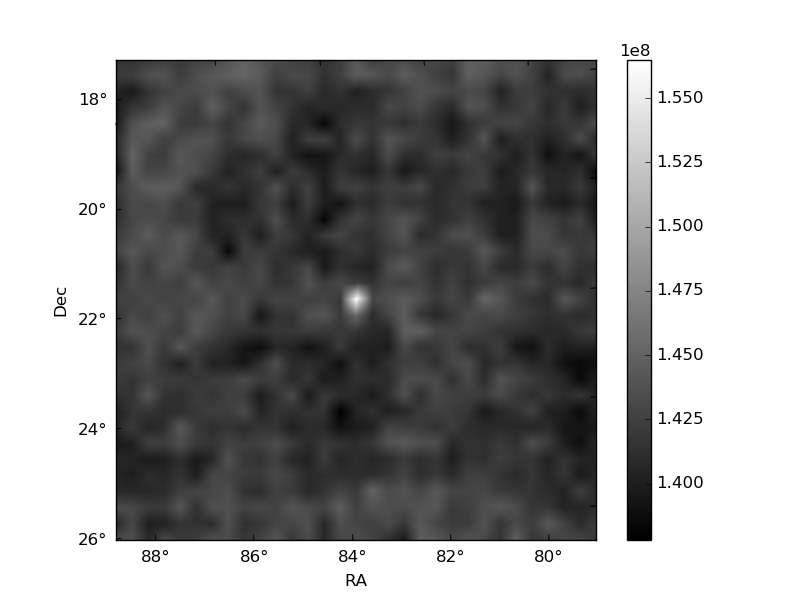
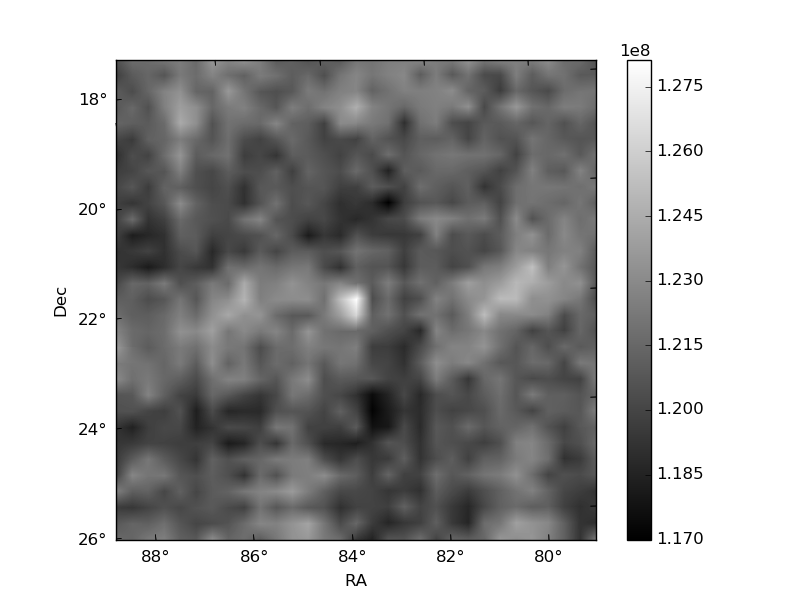
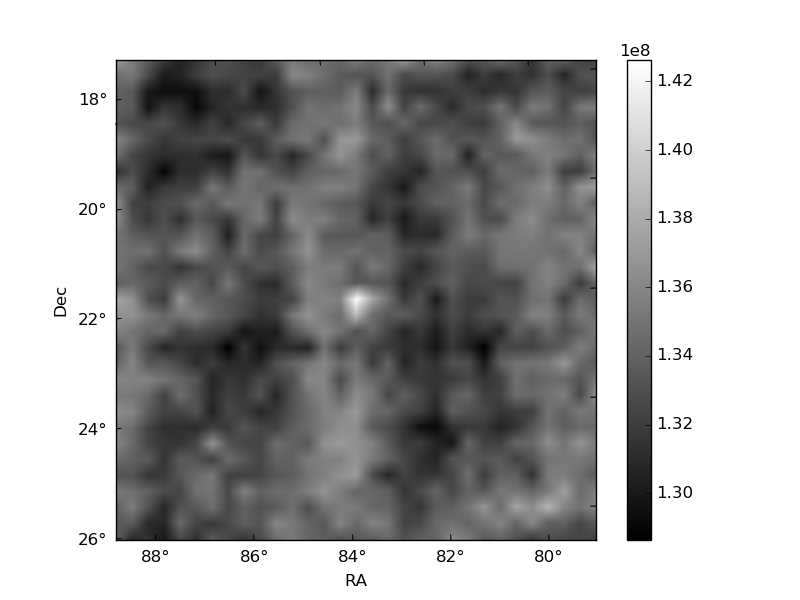
Histogram calculated using DETX and DETY for each event in the final _common_clean file
| Quadrant A | 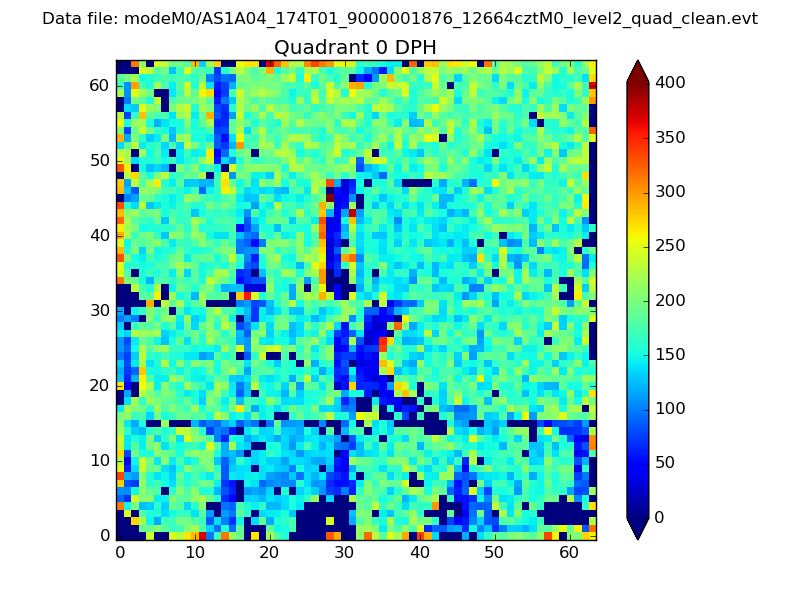 |
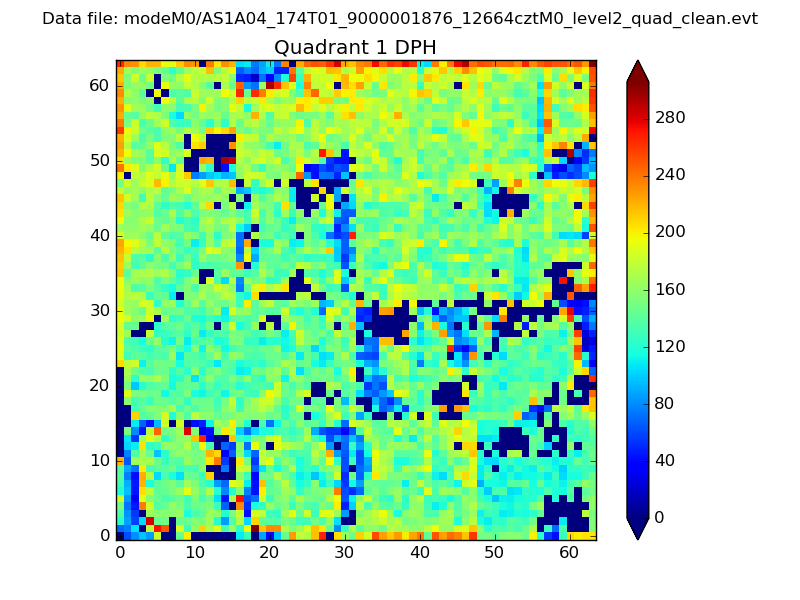 |
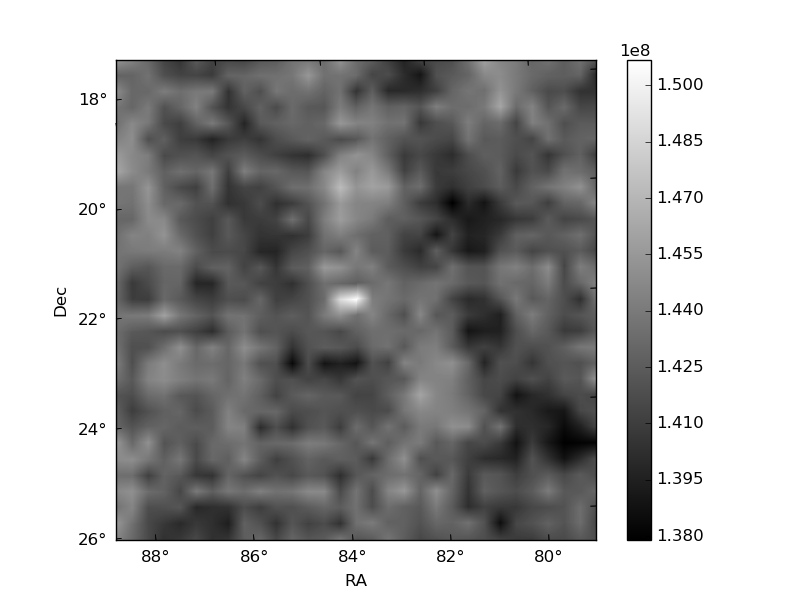
Quadrant B |
|---|---|---|---|
| Quadrant D | 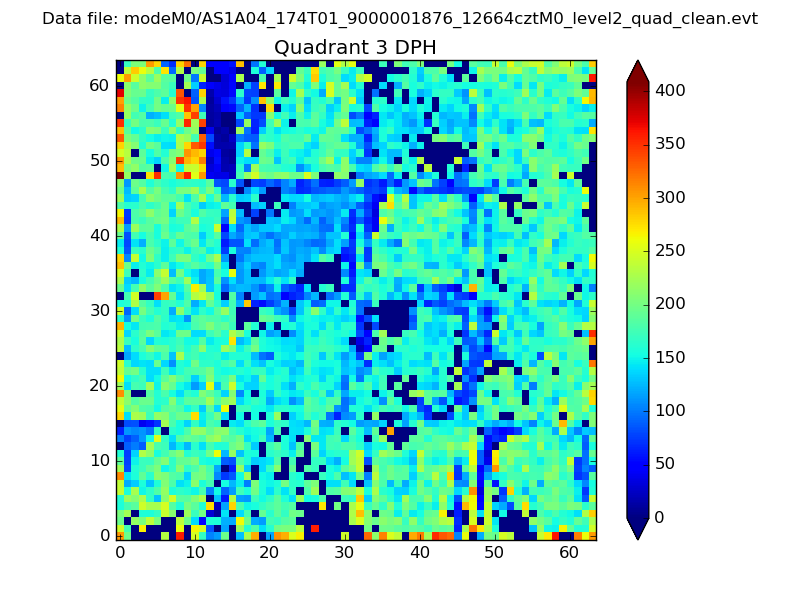 |
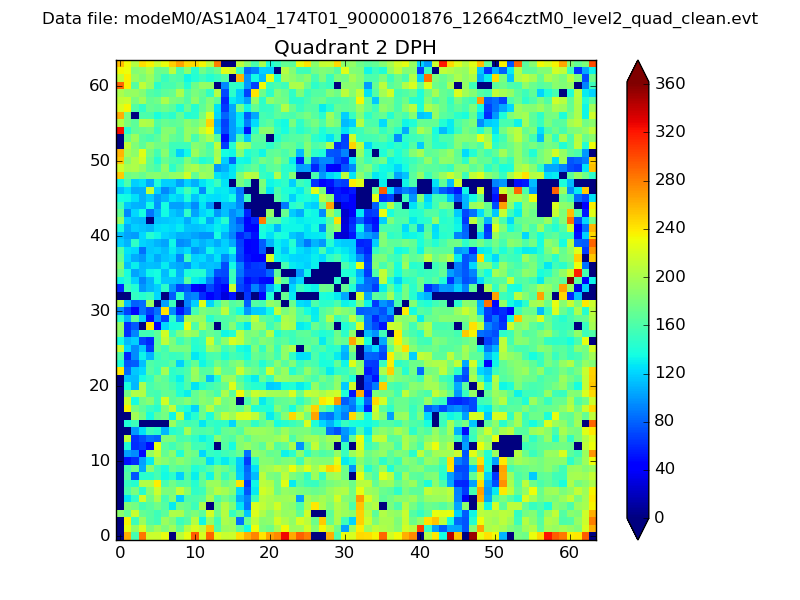 |
Quadrant C |
| Plot type | Count rate plots | Images |
|---|---|---|
| Comparison with Poisson distribution Blue bars denote a histogram of data divided into 1 sec bins. Red curve is a Poisson curve with rate = median count rate of data. |
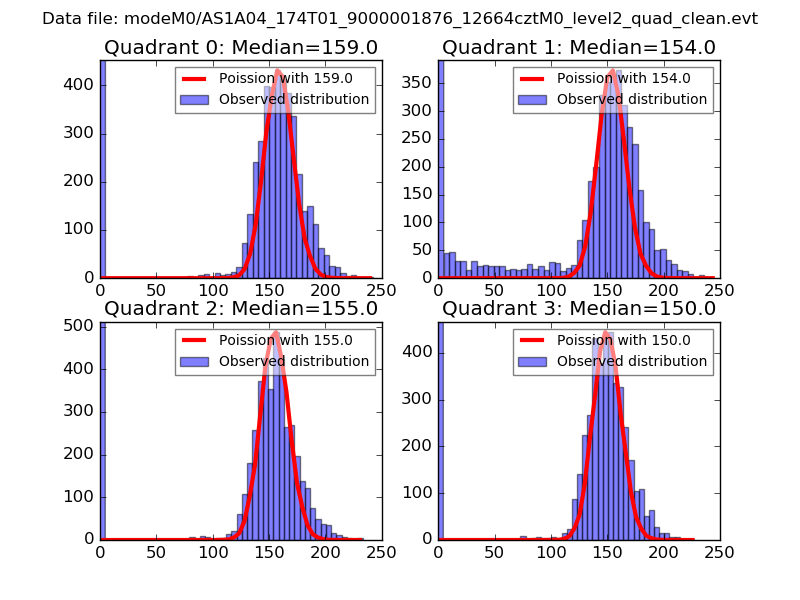 |
 |
| Quadrant-wise count rates Data is divided into 100 sec bins |
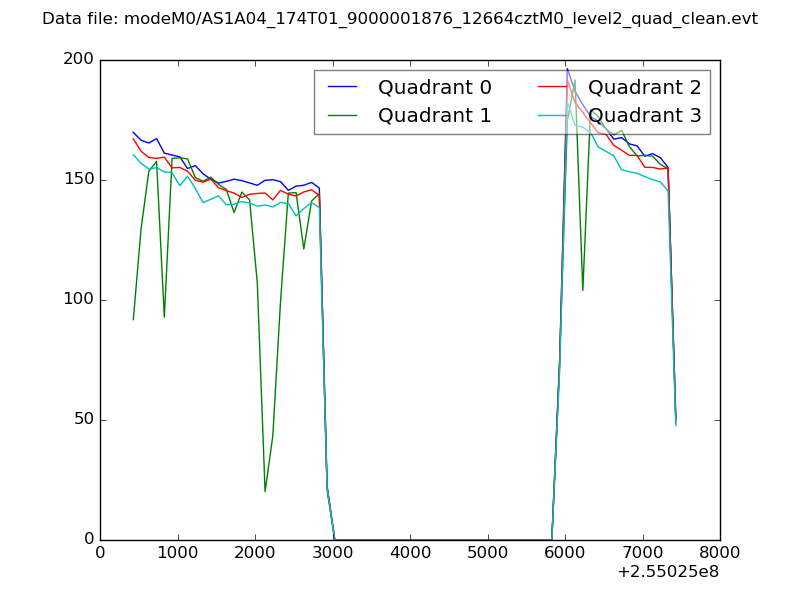 |
|
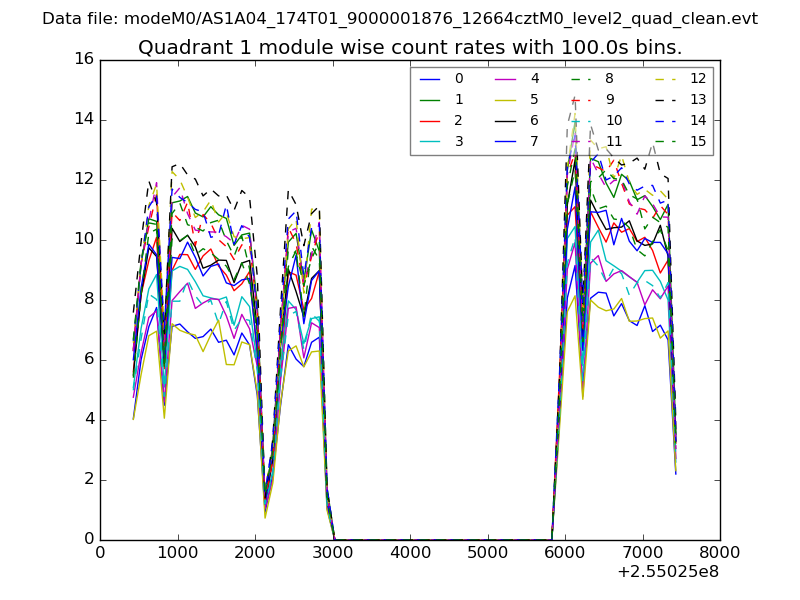
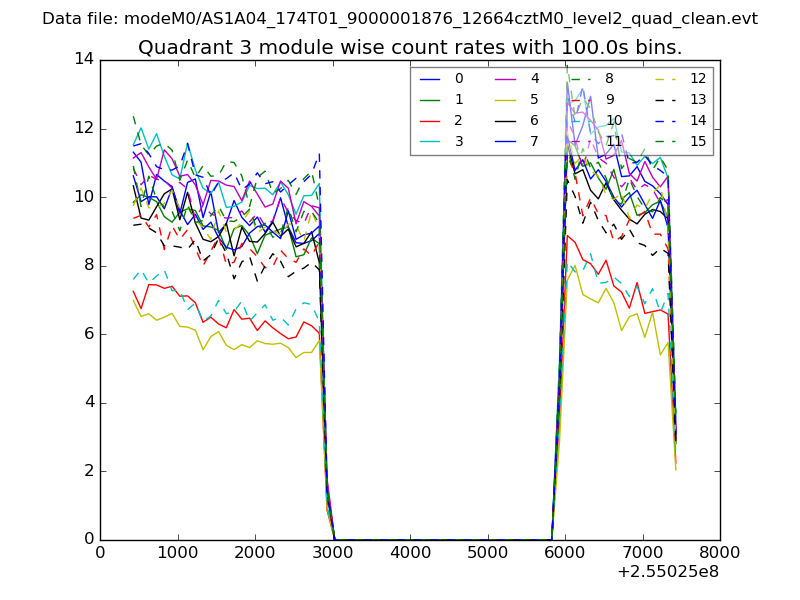
| Module-wise count rates for Quadrant A Data is divided into 100 sec bins |
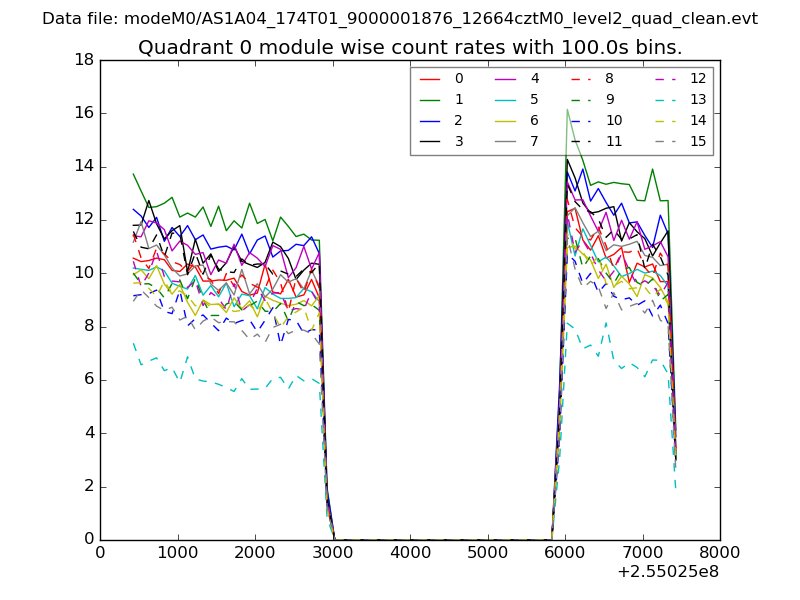 |
 |
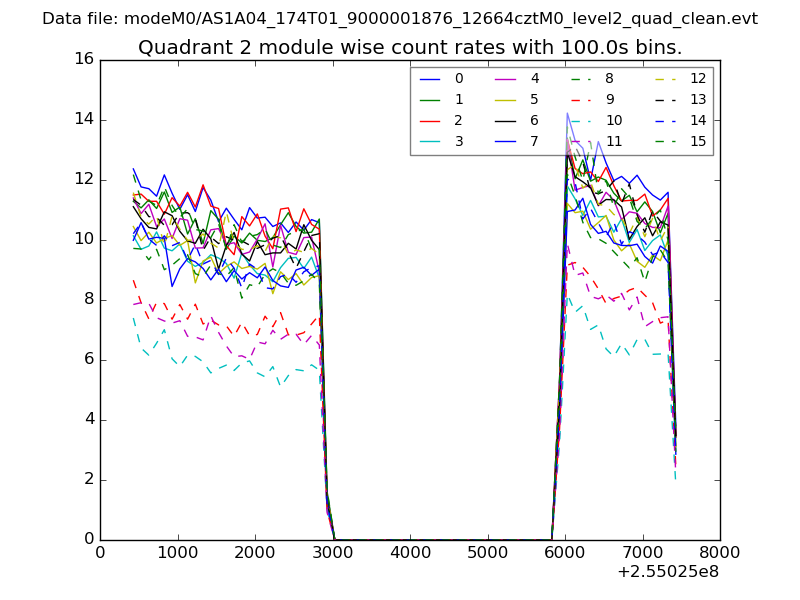
| Module-wise count rates for Quadrant B Data is divided into 100 sec bins |
 |
 |
| Module-wise count rates for Quadrant C Data is divided into 100 sec bins |
 |
 |
| Module-wise count rates for Quadrant D Data is divided into 100 sec bins |
 |
 |
| Parameter | Plot |
|---|---|
| CZT HV Monitor | 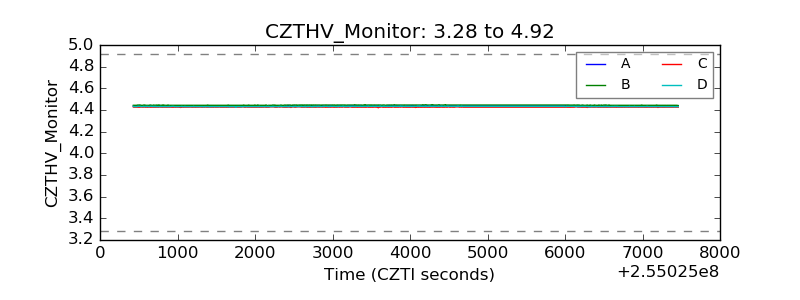 |
| D_VDD | 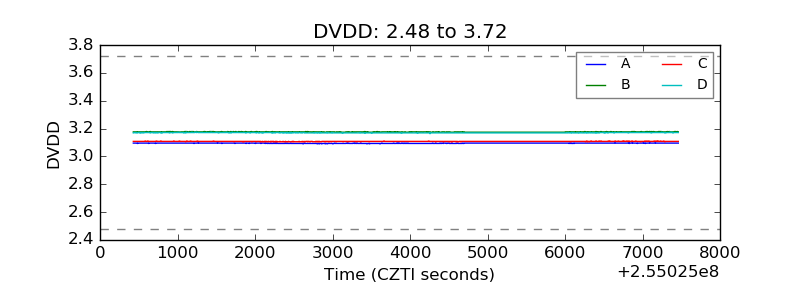 |
| Temperature 1 | 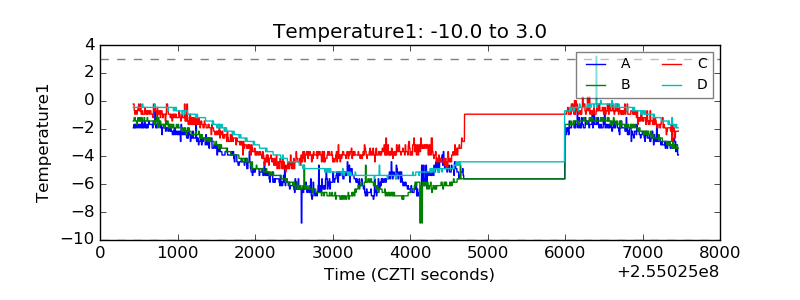 |
| Veto HV Monitor | 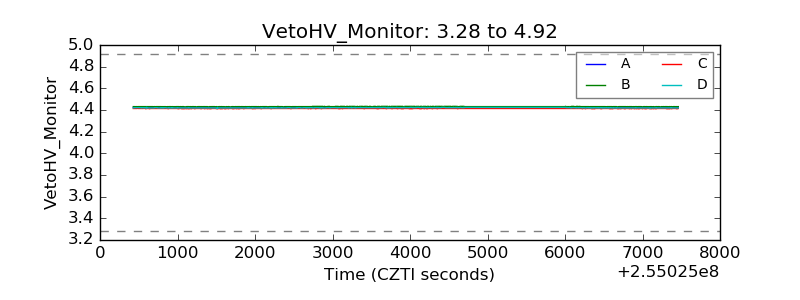 |
| Veto LLD | 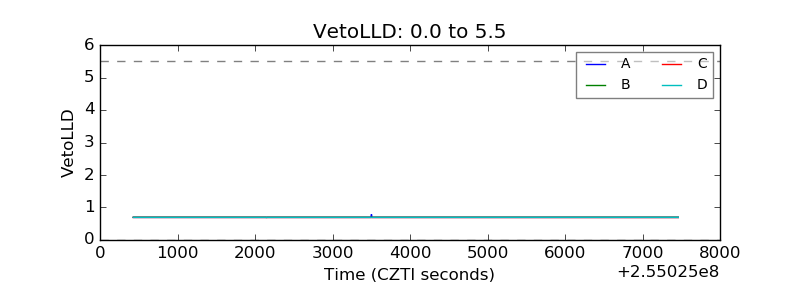 |
| Alpha Counter | 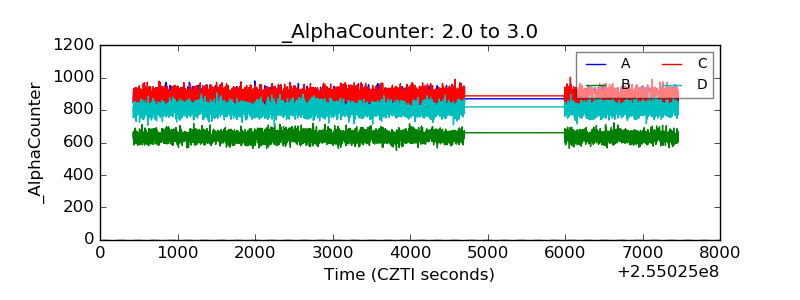 |
| _CPM_Rate | 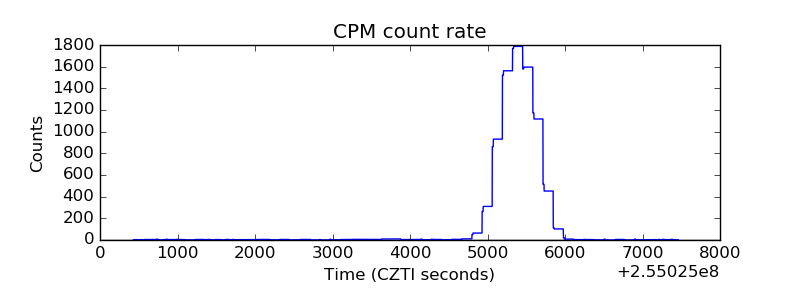 |
| CZT Counter | 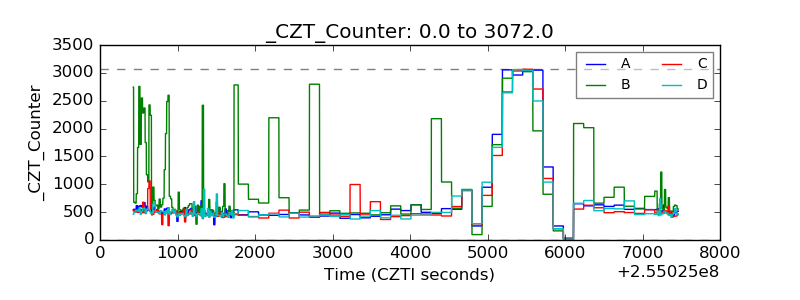 |
| +2.5 Volts monitor |  |
| +5 Volts monitor | 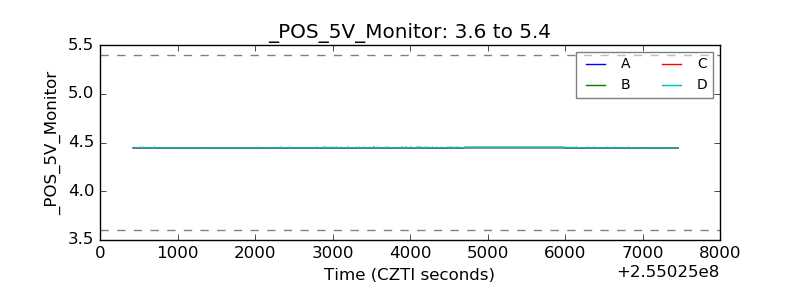 |
| _ROLL_ROT | 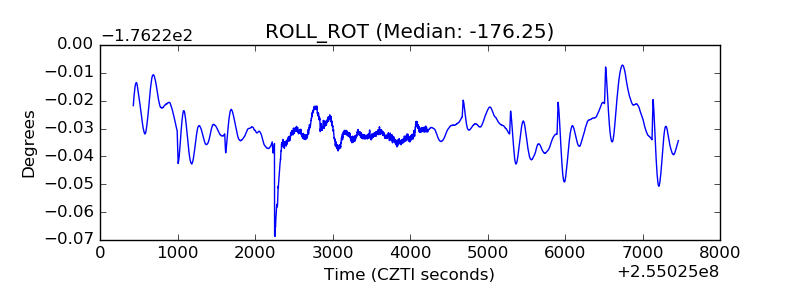 |
| _Roll_DEC | 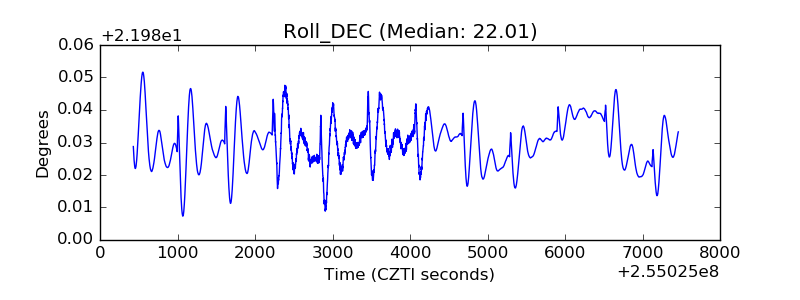 |
| _Roll_RA | 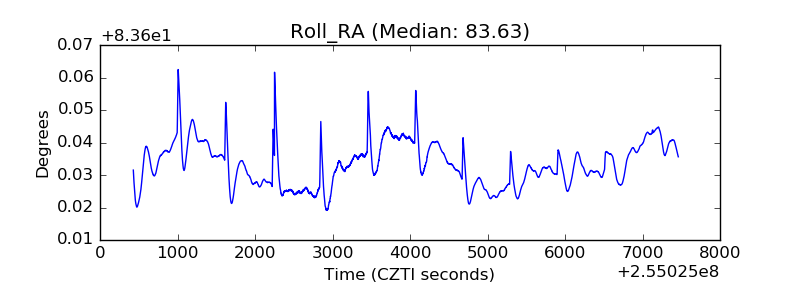 |
| Veto Counter | 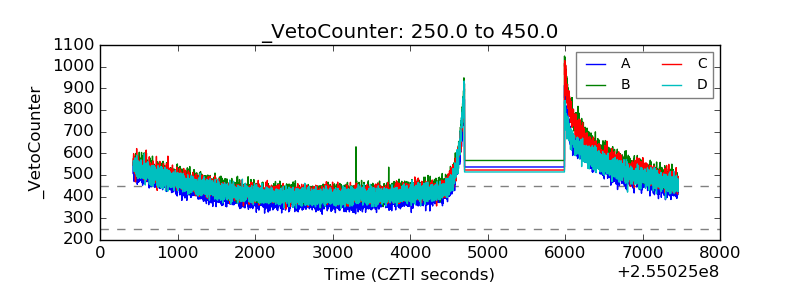 |