| Param | Original file | Final file |
|---|---|---|
| Filename | modeM0/AS1A04_174T01_9000001876_12665cztM0_level2.evt | modeM0/AS1A04_174T01_9000001876_12665cztM0_level2_quad_clean.evt |
| Size (bytes) | 492,022,080 | 91,800,000 |
| Size | 469.2 MB | 87.5 MB |
| Events in quadrant A | 3,595,163 | 610,054 |
| Events in quadrant B | 4,707,837 | 571,408 |
| Events in quadrant C | 3,060,239 | 598,066 |
| Events in quadrant D | 3,126,484 | 577,343 |
| Mode M9 | |||
|---|---|---|---|
| Quadrant | BADHDUFLAG | Total packets | Discarded packets |
| A | 0 | 13 | 0 |
| B | 0 | 13 | 0 |
| C | 0 | 13 | 0 |
| D | 0 | 13 | 0 |
| Mode M0 | |||
|---|---|---|---|
| Quadrant | BADHDUFLAG | Total packets | Discarded packets |
| A | 0 | 14436 | 2 |
| B | 0 | 17974 | 1 |
| C | 0 | 12886 | 1 |
| D | 0 | 13231 | 1 |
| Mode SS | |||
|---|---|---|---|
| Quadrant | BADHDUFLAG | Total packets | Discarded packets |
| A | 0 | 122 | 0 |
| B | 0 | 122 | 0 |
| C | 0 | 122 | 0 |
| D | 0 | 122 | 0 |
| Quadrant | Total seconds | Saturated seconds | Saturation percentage |
|---|---|---|---|
| A | 6061 | 133 | 2.194357% |
| B | 6061 | 637 | 10.509817% |
| C | 6061 | 102 | 1.682891% |
| D | 6061 | 106 | 1.748886% |
Noise dominated data is calculated using 1-second bins in cleaned event files. If a bin has >2000 counts, and if more than 50% of those come from <1% of pixels, then it is considered to be noise-dominated and hence unusable.
| Quadrant | # 1 sec bins | Bins with >0 counts | Bins with >2000 counts | High rate bins dominated by noise | Noise dominated (total time) | Noise dominated (detector-on time) | Marked lightcurve |
|---|---|---|---|---|---|---|---|
| A | 7323 | 6063 | 4 | 4 | 0.05% | 0.07% | 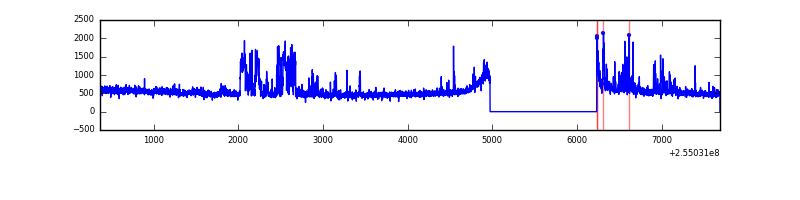 |
| B | 7322 | 6062 | 460 | 460 | 6.28% | 7.59% | 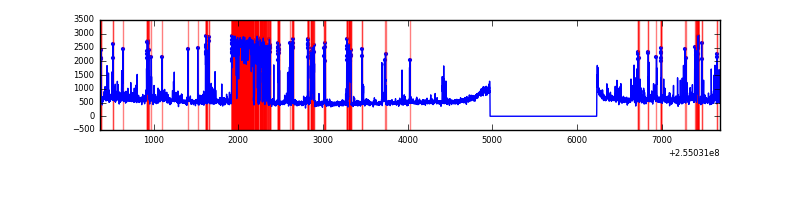 |
| C | 7323 | 6063 | 15 | 15 | 0.20% | 0.25% |  |
| D | 7323 | 6063 | 13 | 13 | 0.18% | 0.21% | 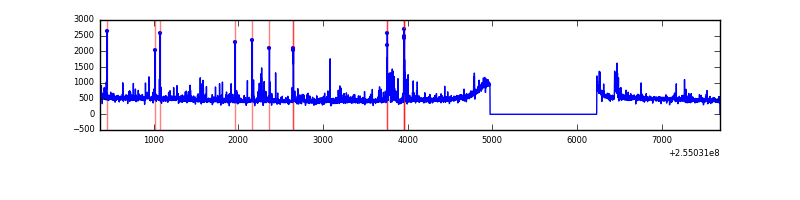 |
Top three noisy pixels from each quadrant. If the there are fewer than three noisy pixels in the level2.evt file, extra rows are filled as -1
| Pixel properties | Quadrant properties | ||||||
|---|---|---|---|---|---|---|---|
| Quadrant | DetID | PixID | Counts | Sigma | Mean | Median | Sigma |
| A | 5 | 112 | 494358 | 3103.57 | 780 | 767 | 159.0 |
| A | 8 | 15 | 54796 | 339.72 | 780 | 767 | 159.0 |
| A | 12 | 189 | 44933 | 277.7 | 780 | 767 | 159.0 |
| B | 4 | 239 | 1440867 | 10279.91 | 748 | 732 | 140.1 |
| B | 3 | 64 | 110522 | 783.7 | 748 | 732 | 140.1 |
| B | 11 | 51 | 82811 | 585.89 | 748 | 732 | 140.1 |
| C | 15 | 208 | 94915 | 535.07 | 759 | 766 | 176.0 |
| C | 14 | 234 | 6854 | 34.6 | 759 | 766 | 176.0 |
| C | 13 | 61 | 5615 | 27.56 | 759 | 766 | 176.0 |
| D | 1 | 52 | 76205 | 382.59 | 754 | 742 | 197.2 |
| D | 2 | 14 | 54307 | 271.57 | 754 | 742 | 197.2 |
| D | 13 | 104 | 46803 | 233.52 | 754 | 742 | 197.2 |
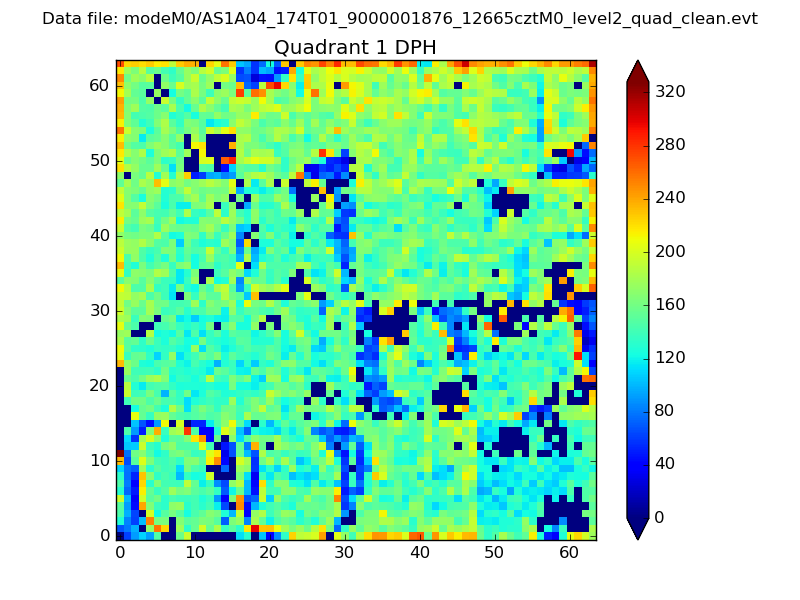
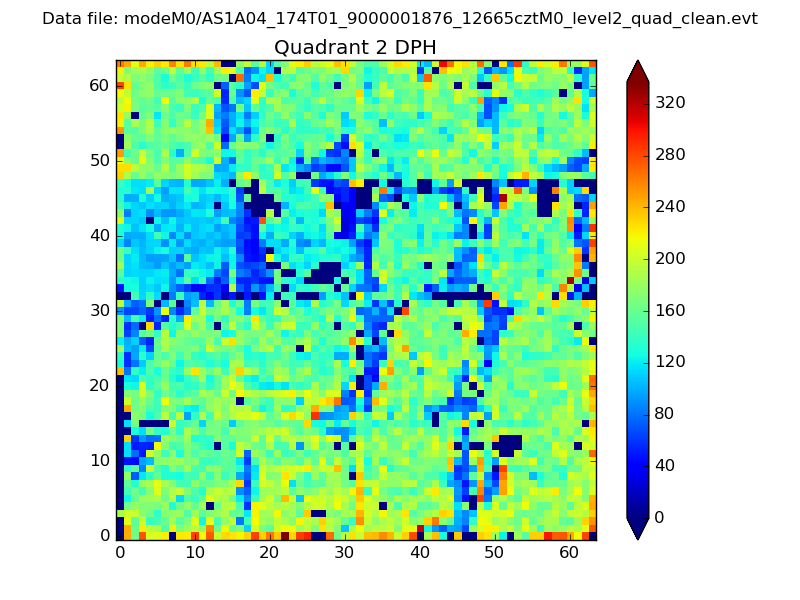
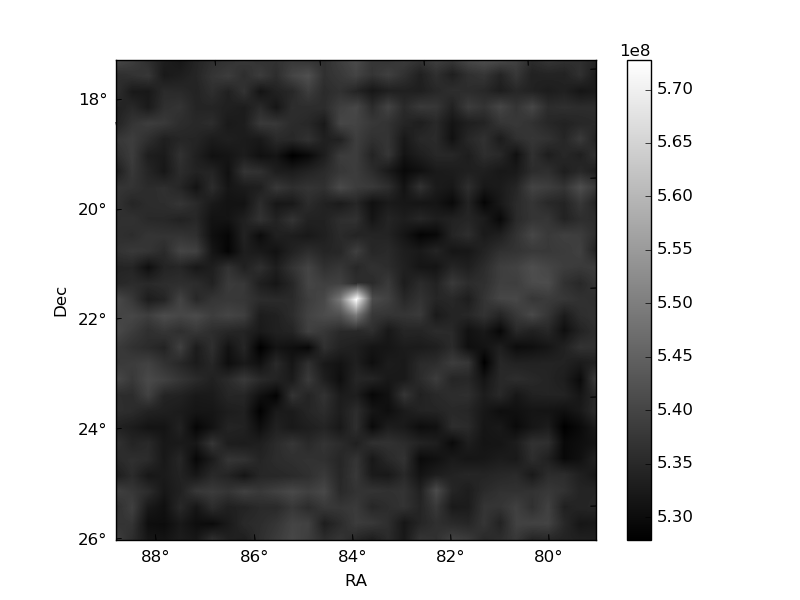
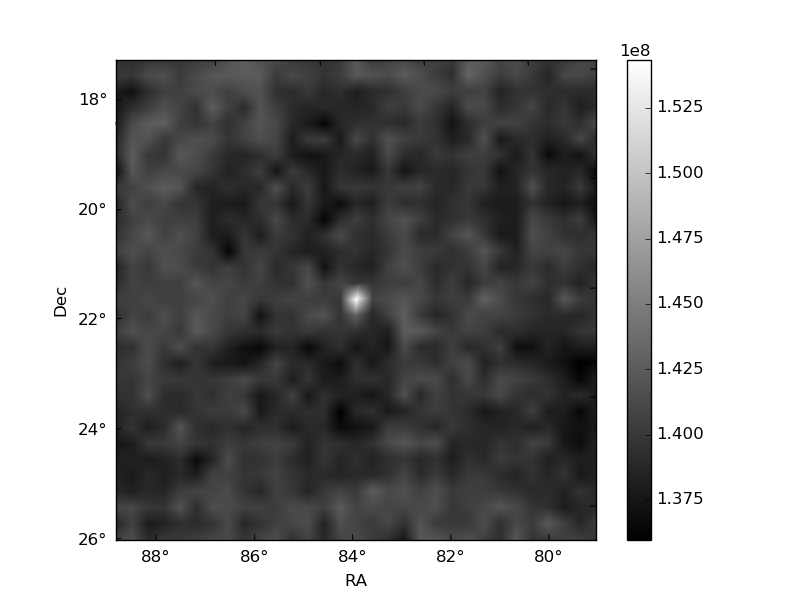
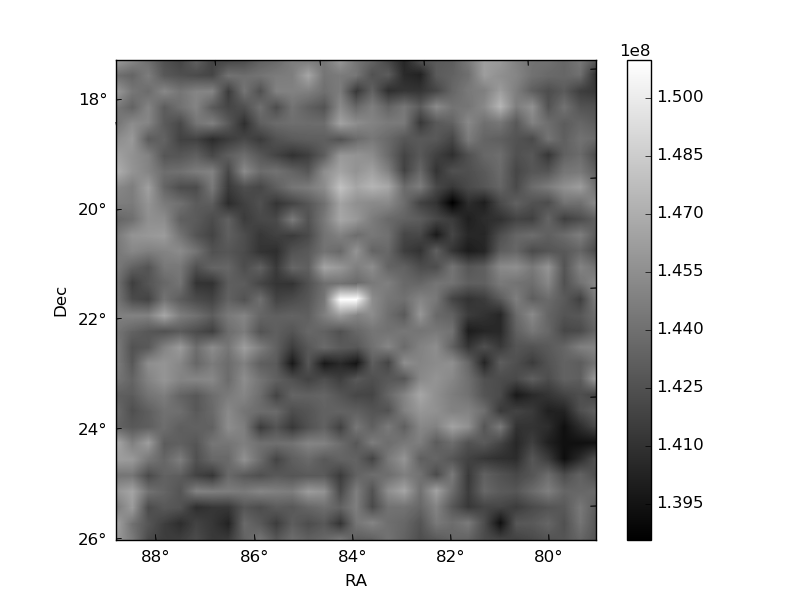
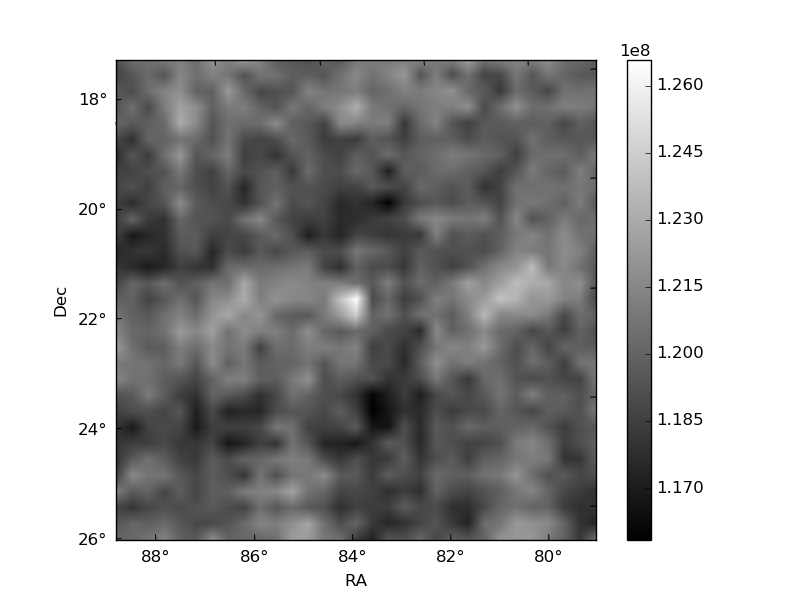
Histogram calculated using DETX and DETY for each event in the final _common_clean file
| Quadrant A | 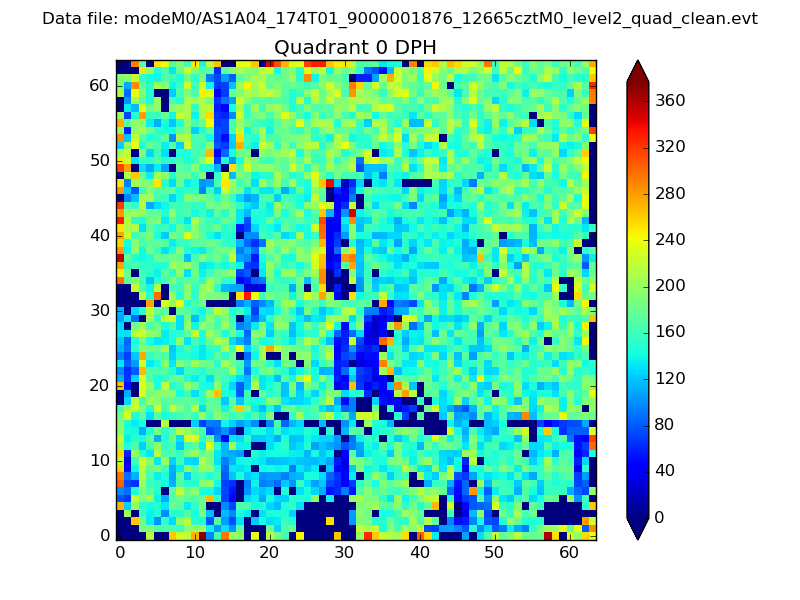 |
 |
Quadrant B |
|---|---|---|---|
| Quadrant D | 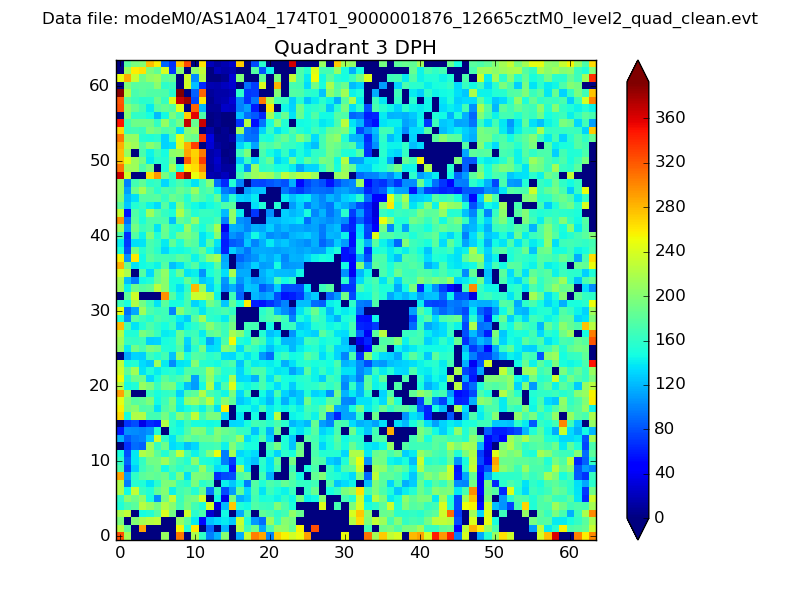 |
 |
Quadrant C |
| Plot type | Count rate plots | Images |
|---|---|---|
| Comparison with Poisson distribution Blue bars denote a histogram of data divided into 1 sec bins. Red curve is a Poisson curve with rate = median count rate of data. |
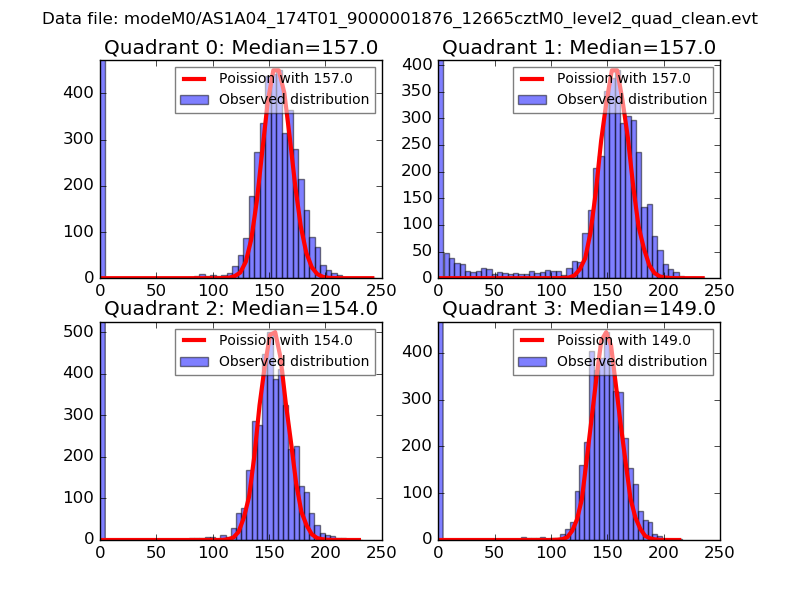 |
 |
| Quadrant-wise count rates Data is divided into 100 sec bins |
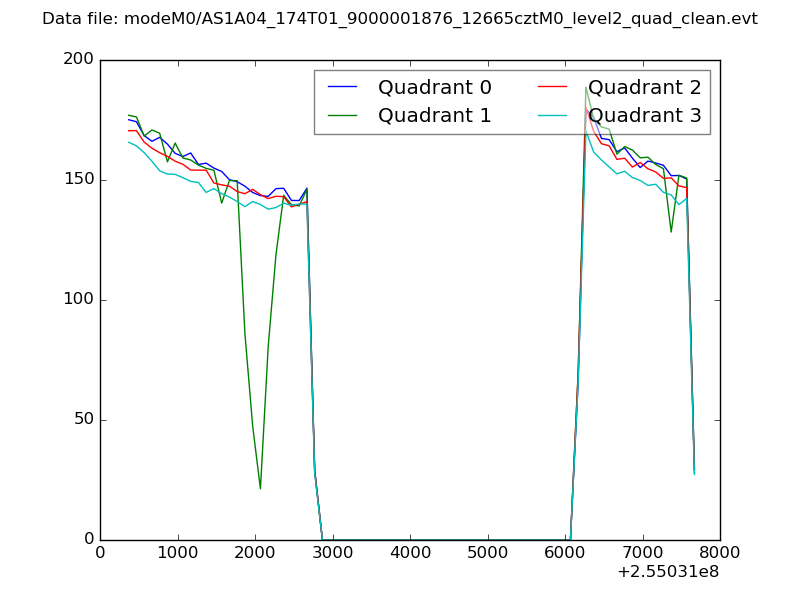 |
|
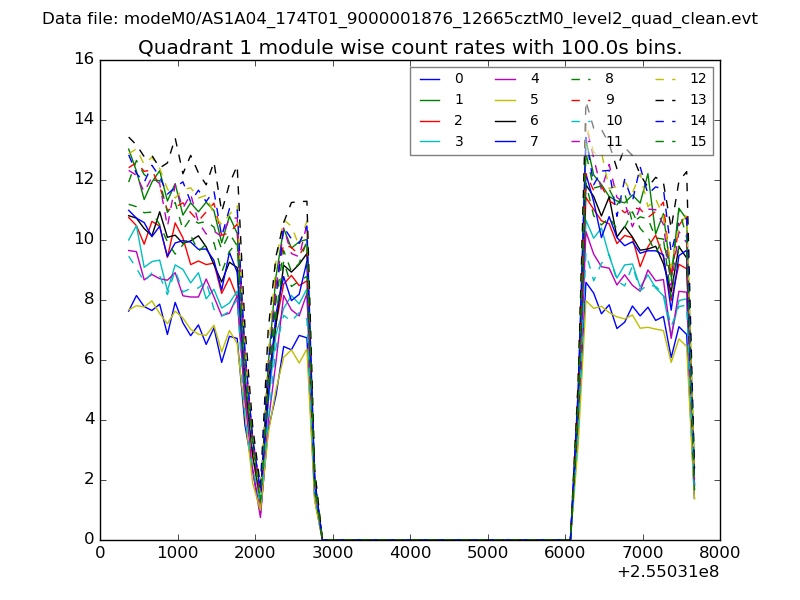
| Module-wise count rates for Quadrant A Data is divided into 100 sec bins |
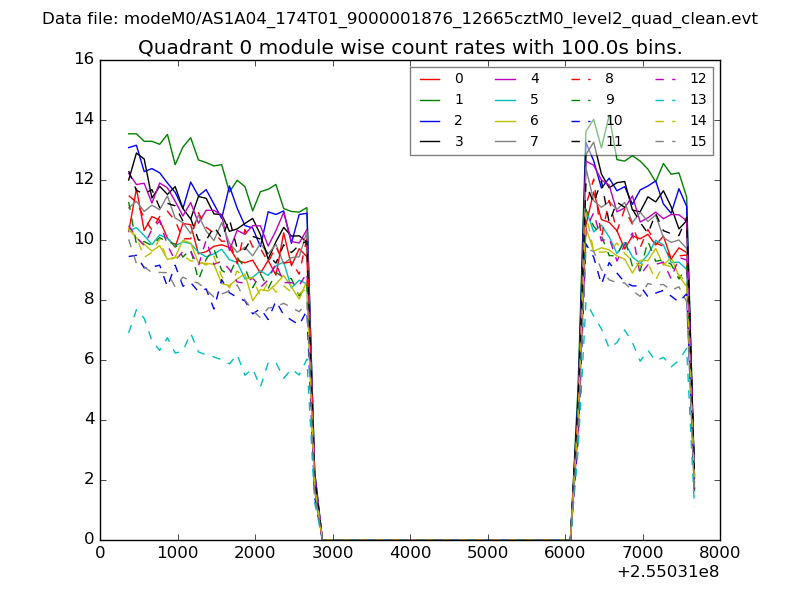 |
 |
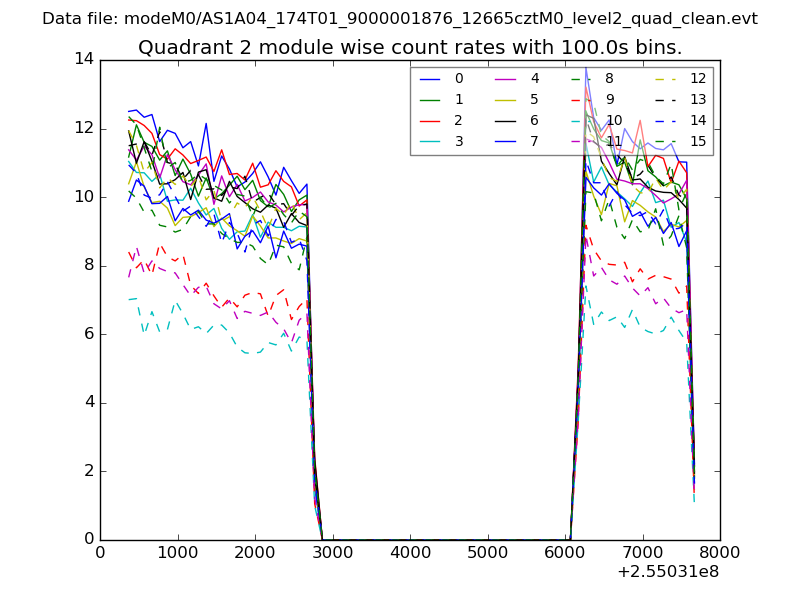
| Module-wise count rates for Quadrant B Data is divided into 100 sec bins |
 |
 |
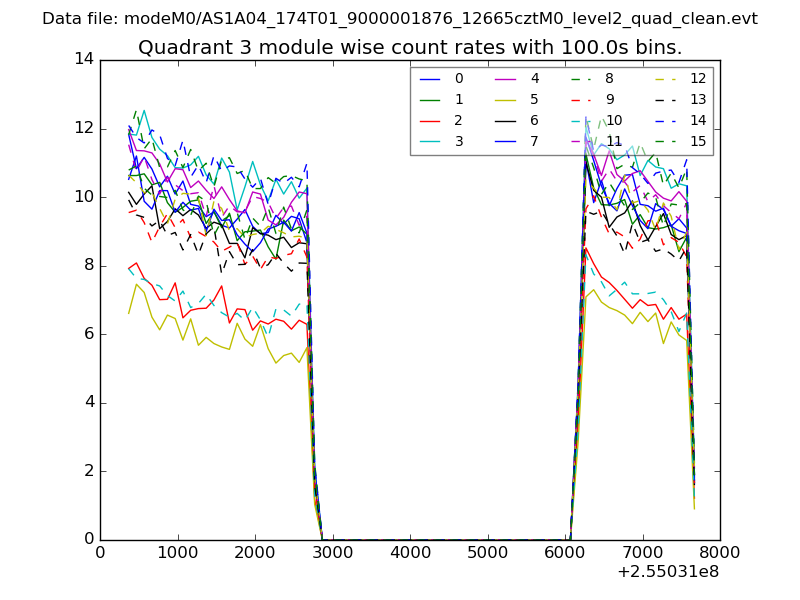
| Module-wise count rates for Quadrant C Data is divided into 100 sec bins |
 |
 |
| Module-wise count rates for Quadrant D Data is divided into 100 sec bins |
 |
 |
| Parameter | Plot |
|---|---|
| CZT HV Monitor | 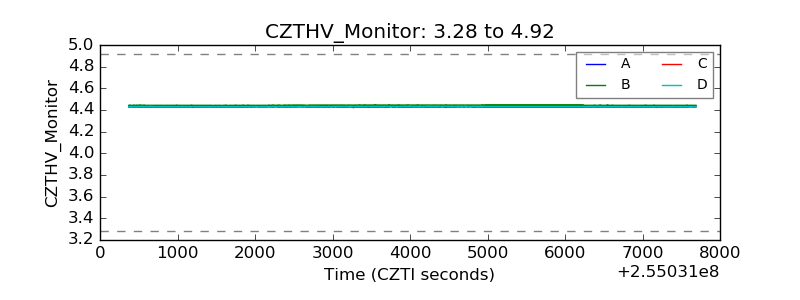 |
| D_VDD | 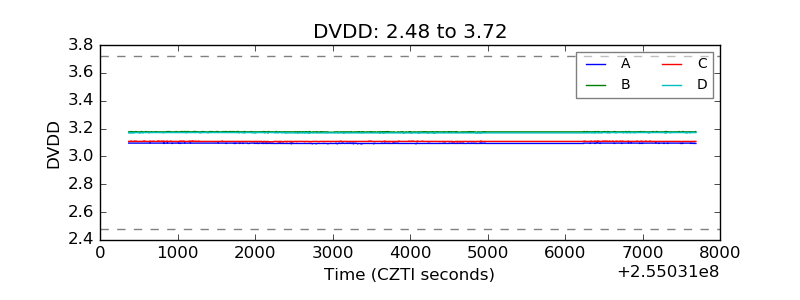 |
| Temperature 1 | 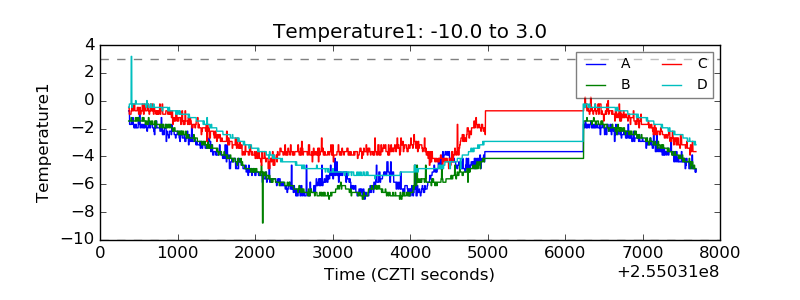 |
| Veto HV Monitor | 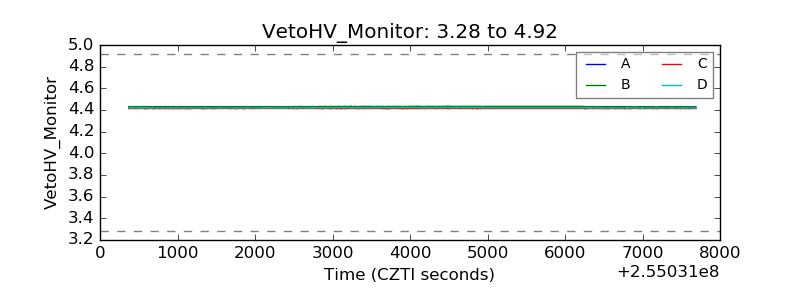 |
| Veto LLD | 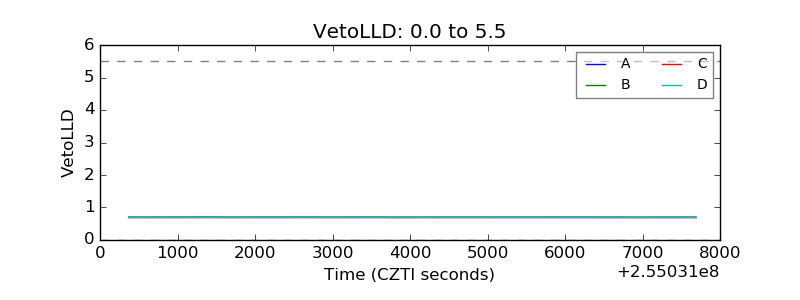 |
| Alpha Counter | 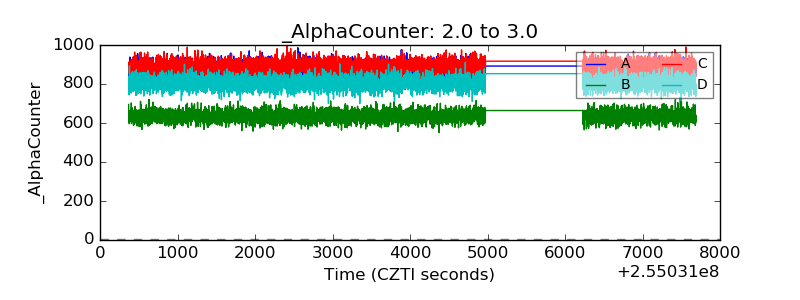 |
| _CPM_Rate | 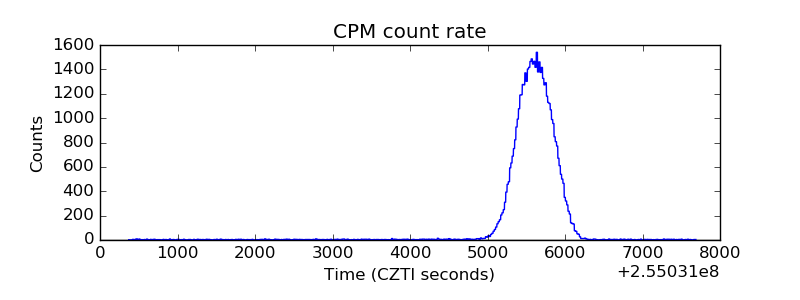 |
| CZT Counter | 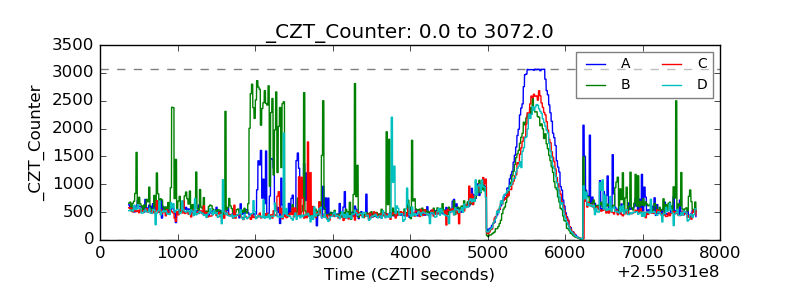 |
| +2.5 Volts monitor | 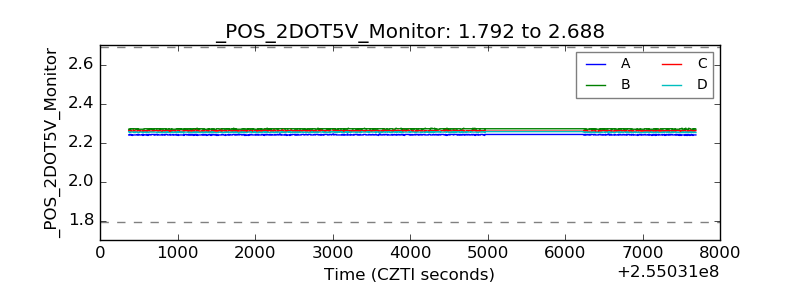 |
| +5 Volts monitor |  |
| _ROLL_ROT | 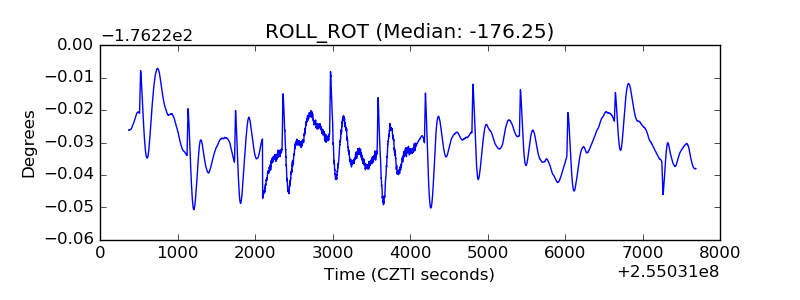 |
| _Roll_DEC | 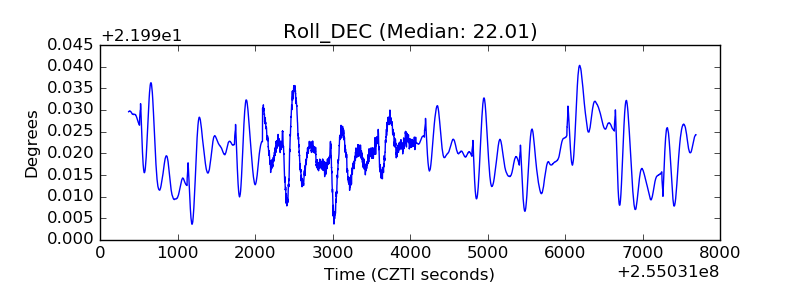 |
| _Roll_RA | 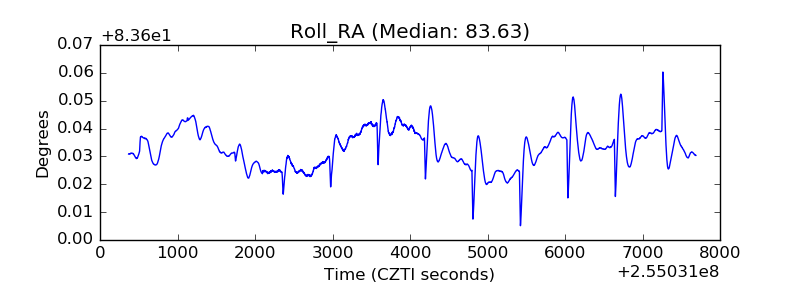 |
| Veto Counter | 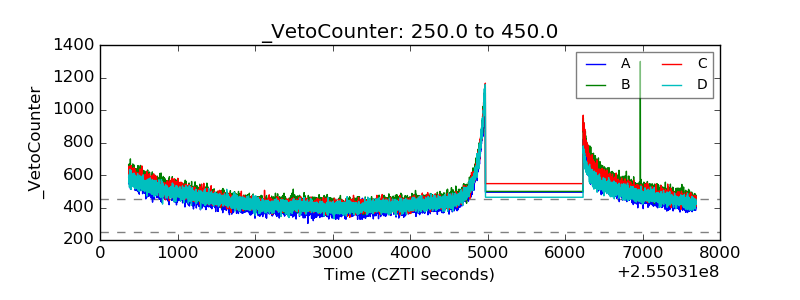 |