| Param | Original file | Final file |
|---|---|---|
| Filename | modeM0/AS1A04_174T01_9000001876_12666cztM0_level2.evt | modeM0/AS1A04_174T01_9000001876_12666cztM0_level2_quad_clean.evt |
| Size (bytes) | 476,288,640 | 88,110,720 |
| Size | 454.2 MB | 84.0 MB |
| Events in quadrant A | 3,333,858 | 588,763 |
| Events in quadrant B | 4,759,784 | 515,223 |
| Events in quadrant C | 2,919,612 | 582,442 |
| Events in quadrant D | 2,997,501 | 556,360 |
| Mode M9 | |||
|---|---|---|---|
| Quadrant | BADHDUFLAG | Total packets | Discarded packets |
| A | 0 | 13 | 0 |
| B | 0 | 13 | 0 |
| C | 0 | 13 | 0 |
| D | 0 | 13 | 0 |
| Mode M0 | |||
|---|---|---|---|
| Quadrant | BADHDUFLAG | Total packets | Discarded packets |
| A | 0 | 13918 | 2 |
| B | 0 | 18141 | 1 |
| C | 0 | 12617 | 1 |
| D | 0 | 13026 | 1 |
| Mode SS | |||
|---|---|---|---|
| Quadrant | BADHDUFLAG | Total packets | Discarded packets |
| A | 0 | 122 | 0 |
| B | 0 | 122 | 0 |
| C | 0 | 122 | 0 |
| D | 0 | 122 | 0 |
| Quadrant | Total seconds | Saturated seconds | Saturation percentage |
|---|---|---|---|
| A | 6096 | 63 | 1.033465% |
| B | 6096 | 794 | 13.024934% |
| C | 6096 | 53 | 0.869423% |
| D | 6096 | 75 | 1.230315% |
Noise dominated data is calculated using 1-second bins in cleaned event files. If a bin has >2000 counts, and if more than 50% of those come from <1% of pixels, then it is considered to be noise-dominated and hence unusable.
| Quadrant | # 1 sec bins | Bins with >0 counts | Bins with >2000 counts | High rate bins dominated by noise | Noise dominated (total time) | Noise dominated (detector-on time) | Marked lightcurve |
|---|---|---|---|---|---|---|---|
| A | 7332 | 6097 | 3 | 3 | 0.04% | 0.05% | 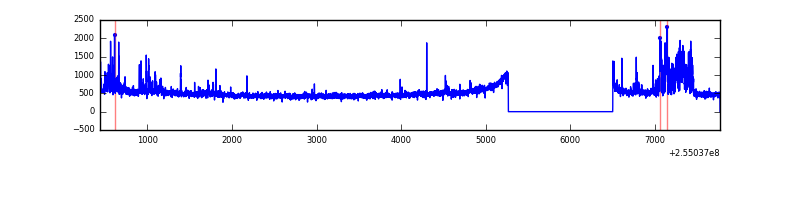 |
| B | 7331 | 6096 | 527 | 527 | 7.19% | 8.65% | 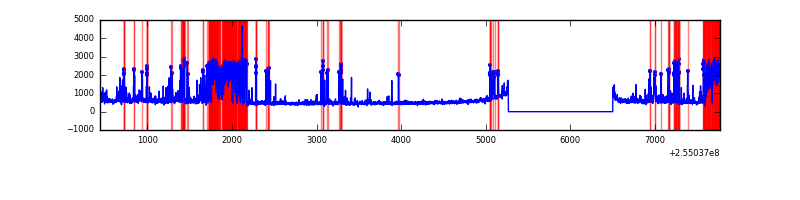 |
| C | 7332 | 6097 | 0 | 0 | 0.00% | 0.00% | 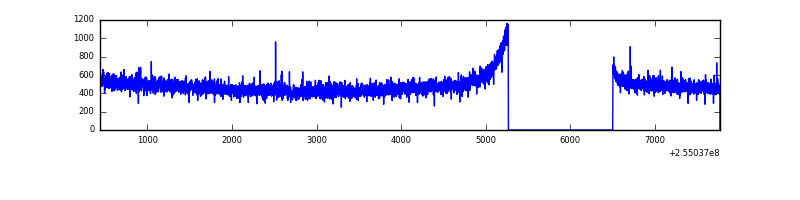 |
| D | 7332 | 6097 | 14 | 14 | 0.19% | 0.23% | 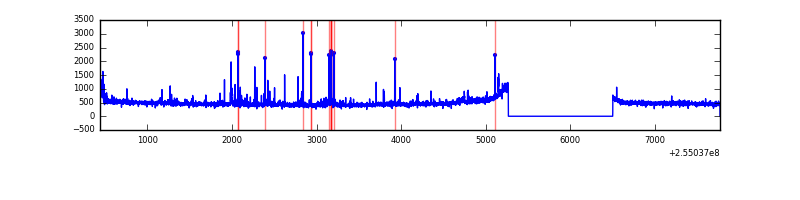 |
Top three noisy pixels from each quadrant. If the there are fewer than three noisy pixels in the level2.evt file, extra rows are filled as -1
| Pixel properties | Quadrant properties | ||||||
|---|---|---|---|---|---|---|---|
| Quadrant | DetID | PixID | Counts | Sigma | Mean | Median | Sigma |
| A | 5 | 112 | 342771 | 2186.3 | 767 | 753 | 156.4 |
| A | 12 | 189 | 28901 | 179.93 | 767 | 753 | 156.4 |
| A | 8 | 15 | 8542 | 49.79 | 767 | 753 | 156.4 |
| B | 4 | 239 | 1737772 | 13096.53 | 707 | 691 | 132.6 |
| B | 3 | 64 | 97852 | 732.53 | 707 | 691 | 132.6 |
| B | 11 | 51 | 43219 | 320.64 | 707 | 691 | 132.6 |
| C | 15 | 208 | 6861 | 35.11 | 746 | 755 | 173.9 |
| C | 13 | 61 | 5311 | 26.2 | 746 | 755 | 173.9 |
| C | 8 | 222 | 4261 | 20.16 | 746 | 755 | 173.9 |
| D | 13 | 104 | 56419 | 288.9 | 737 | 723 | 192.8 |
| D | 10 | 199 | 48762 | 249.18 | 737 | 723 | 192.8 |
| D | 1 | 52 | 42097 | 214.61 | 737 | 723 | 192.8 |
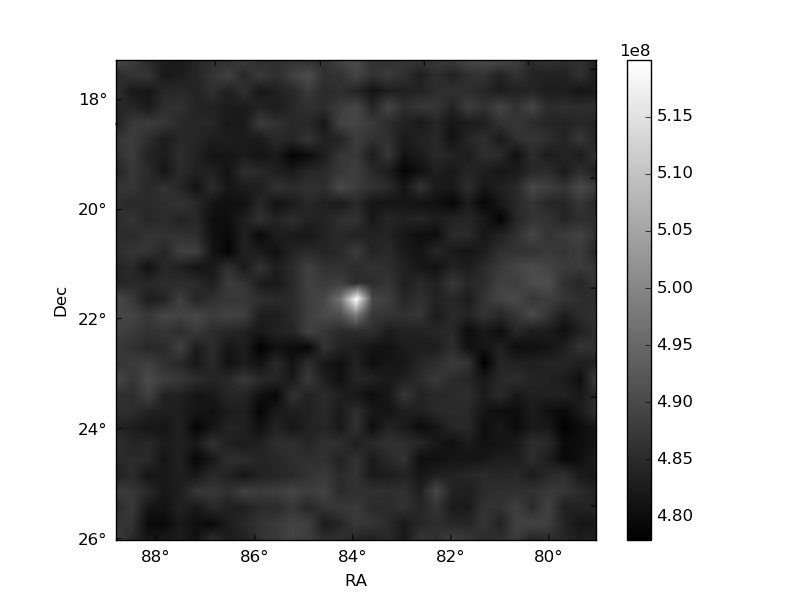
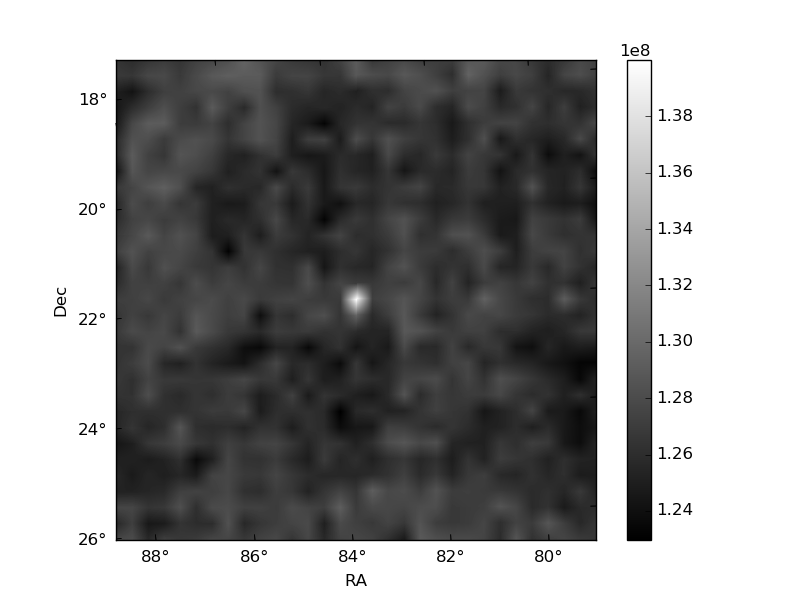
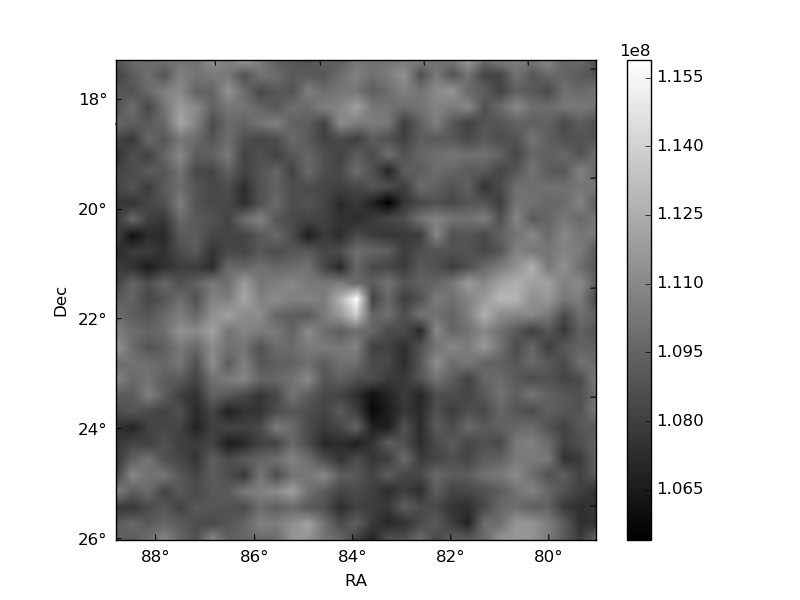
Histogram calculated using DETX and DETY for each event in the final _common_clean file
| Quadrant A | 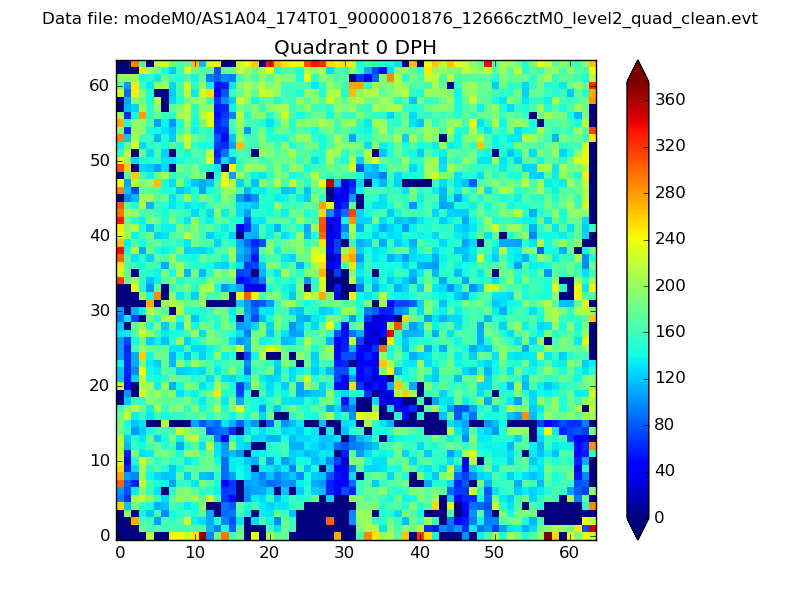 |
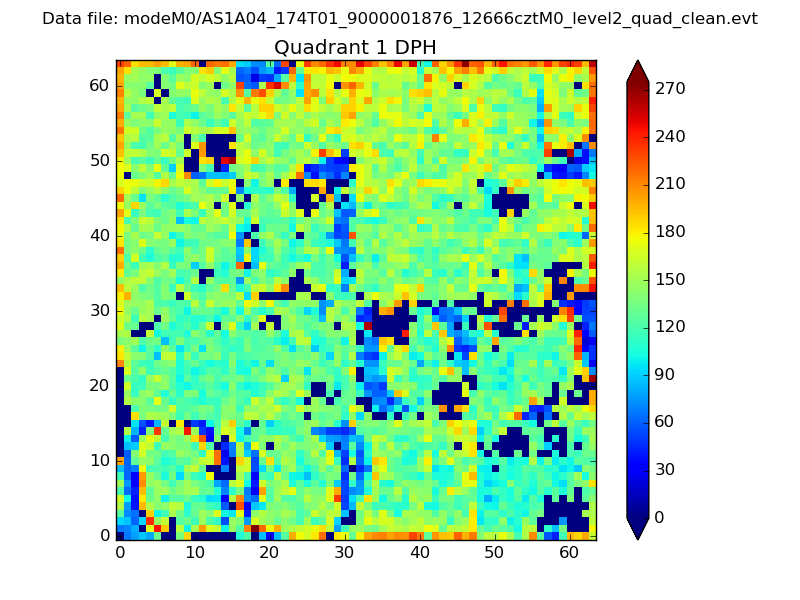 |
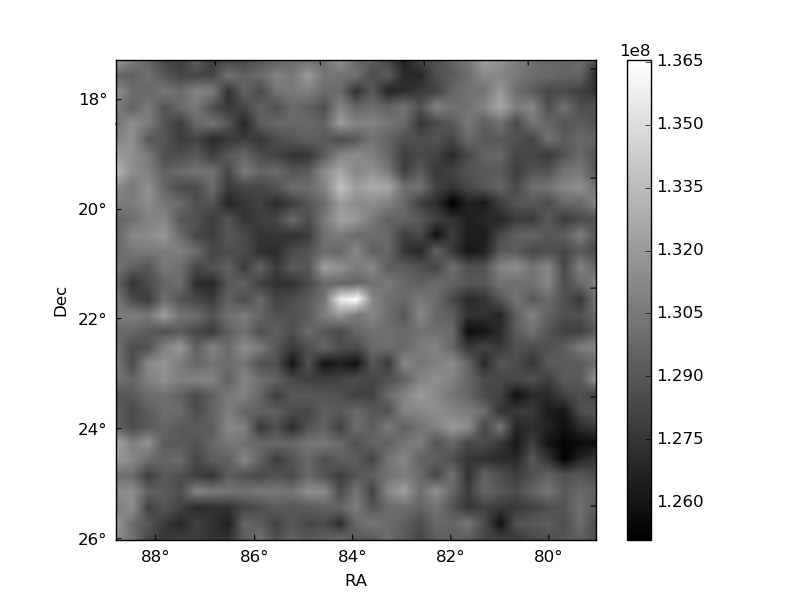
Quadrant B |
|---|---|---|---|
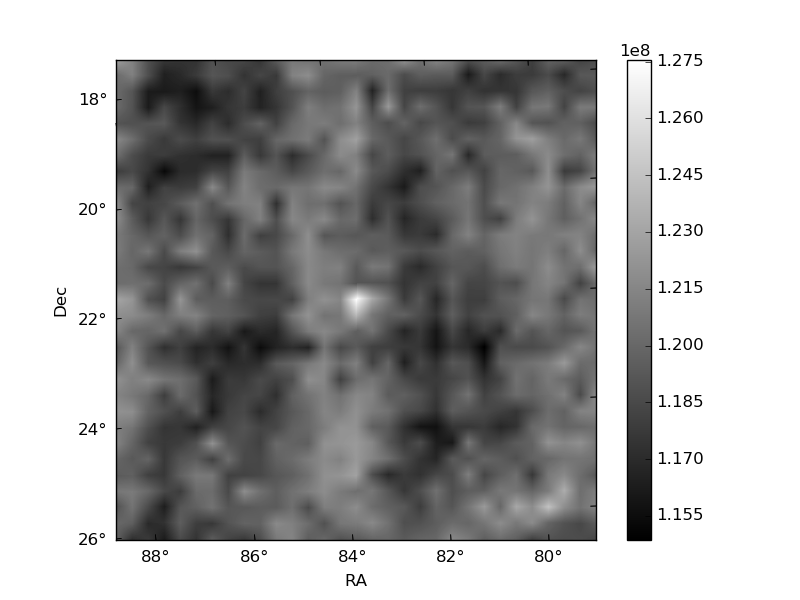
| Quadrant D | 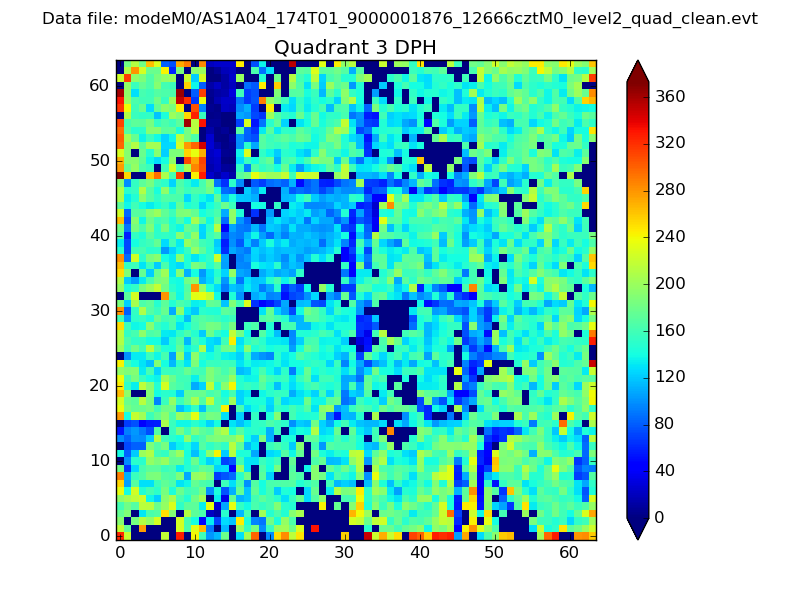 |
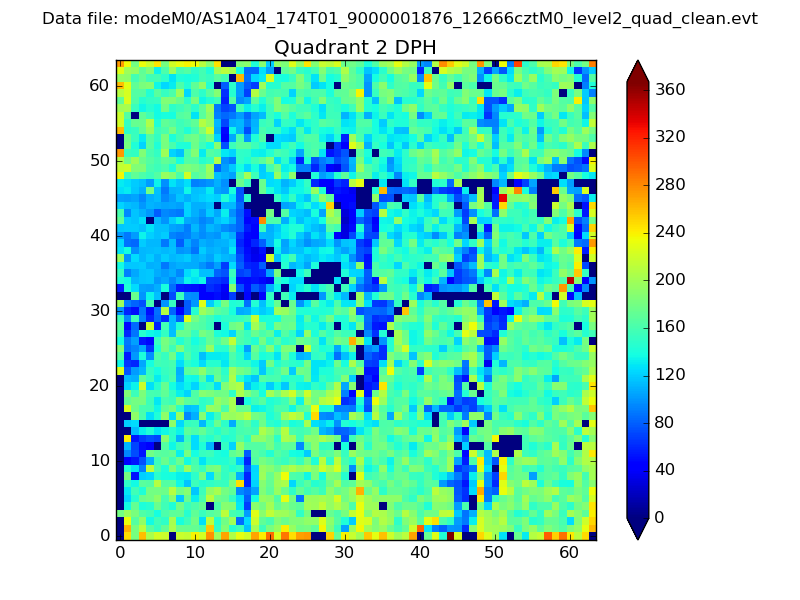 |
Quadrant C |
| Plot type | Count rate plots | Images |
|---|---|---|
| Comparison with Poisson distribution Blue bars denote a histogram of data divided into 1 sec bins. Red curve is a Poisson curve with rate = median count rate of data. |
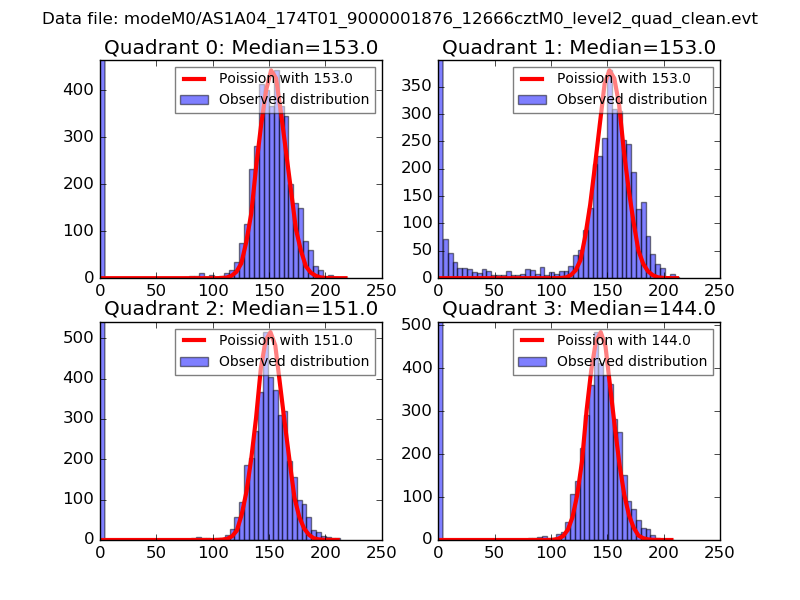 |
 |
| Quadrant-wise count rates Data is divided into 100 sec bins |
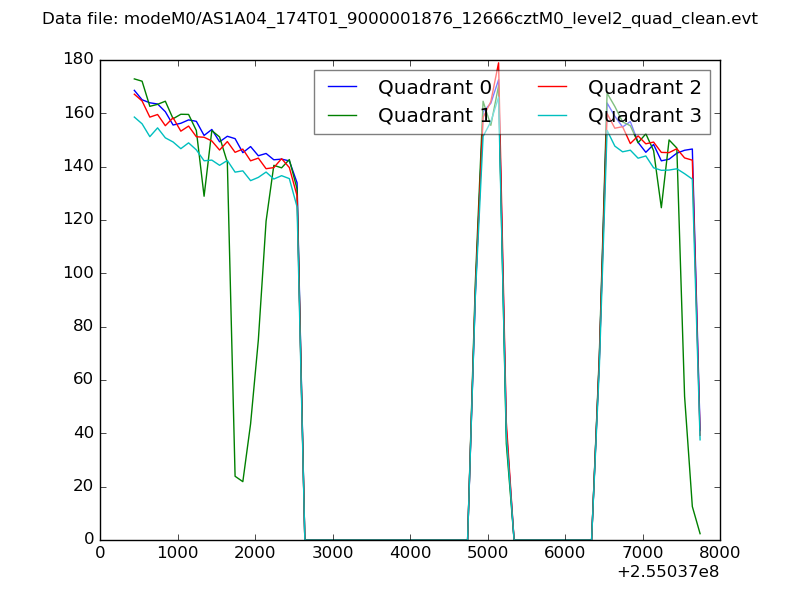 |
|
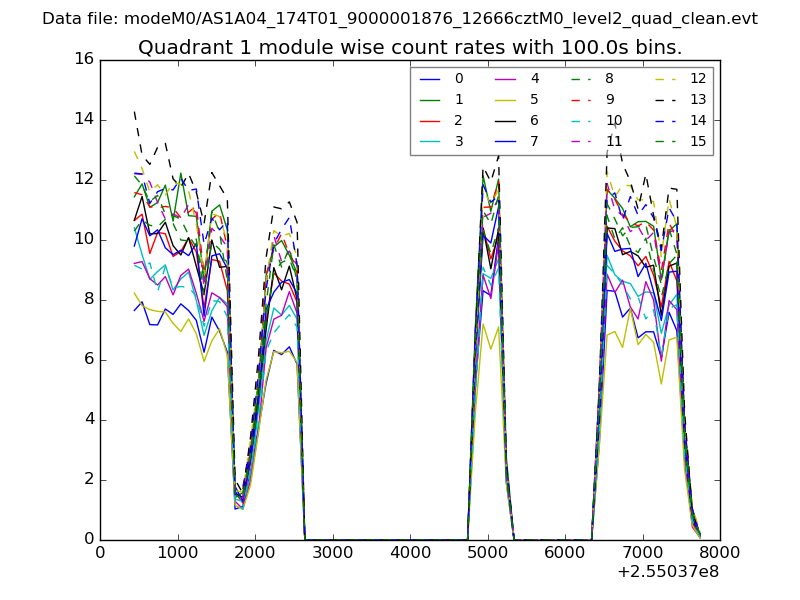
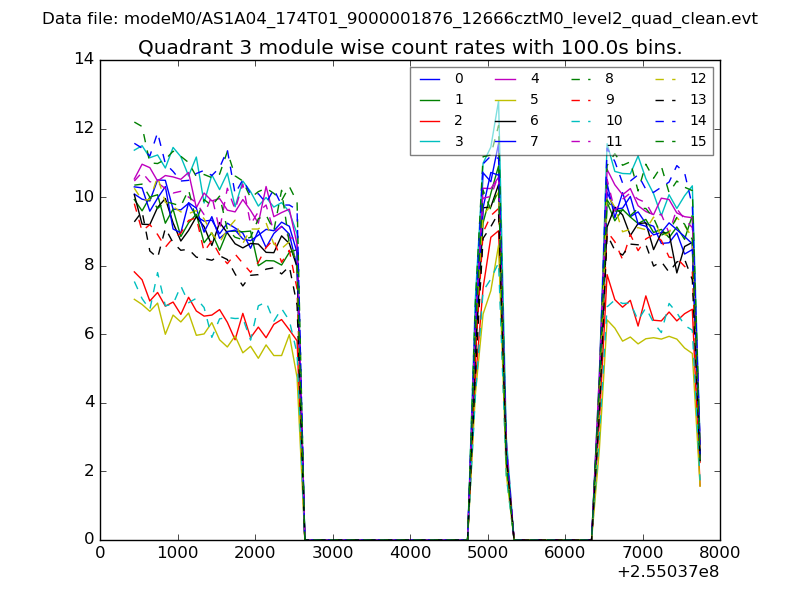
| Module-wise count rates for Quadrant A Data is divided into 100 sec bins |
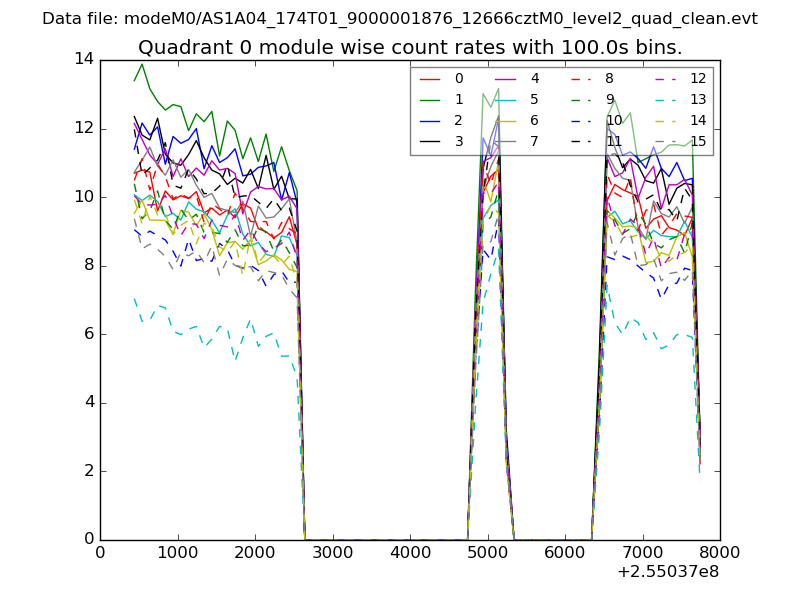 |
 |
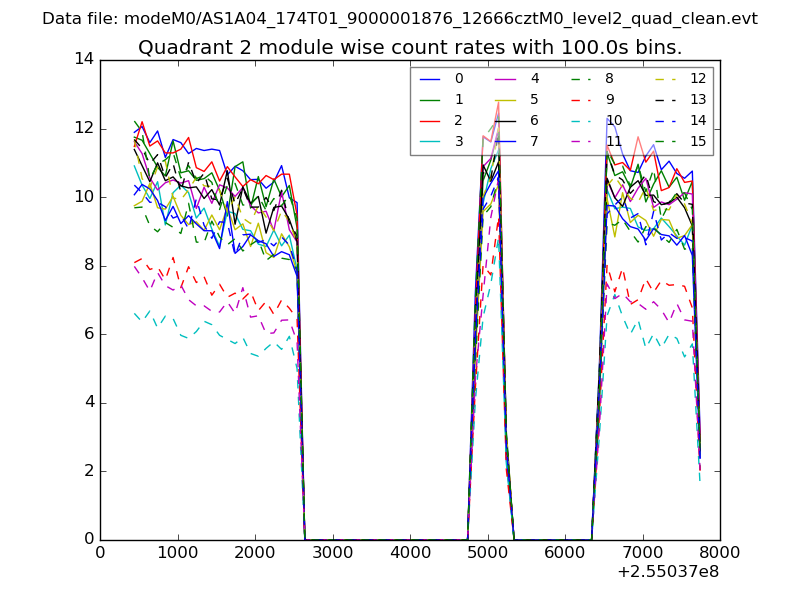
| Module-wise count rates for Quadrant B Data is divided into 100 sec bins |
 |
 |
| Module-wise count rates for Quadrant C Data is divided into 100 sec bins |
 |
 |
| Module-wise count rates for Quadrant D Data is divided into 100 sec bins |
 |
 |
| Parameter | Plot |
|---|---|
| CZT HV Monitor | 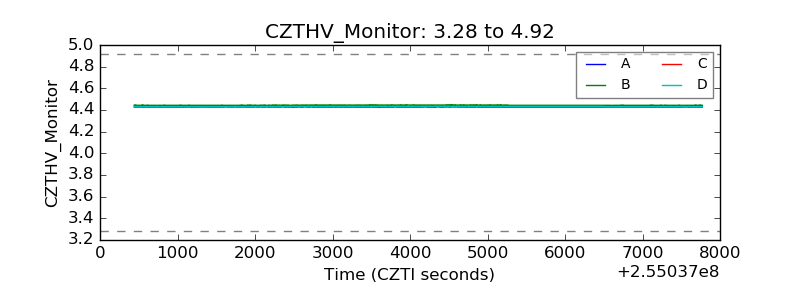 |
| D_VDD | 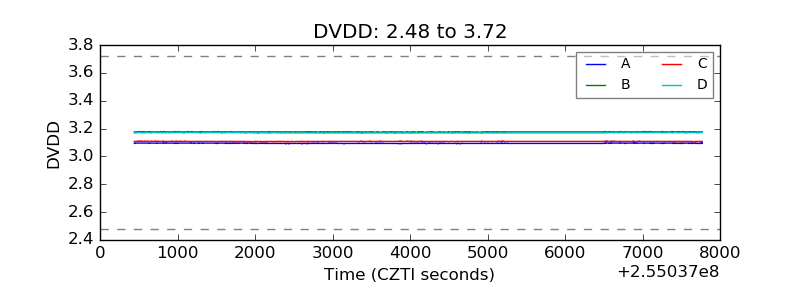 |
| Temperature 1 | 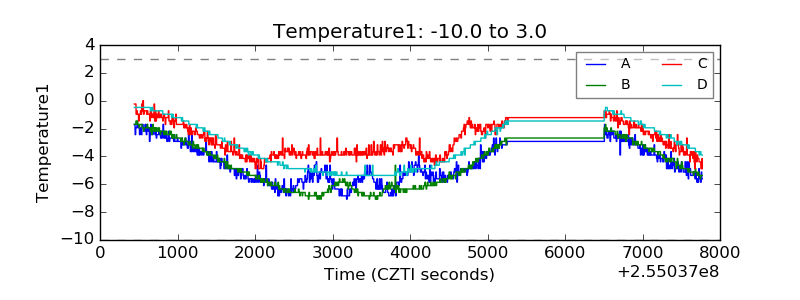 |
| Veto HV Monitor | 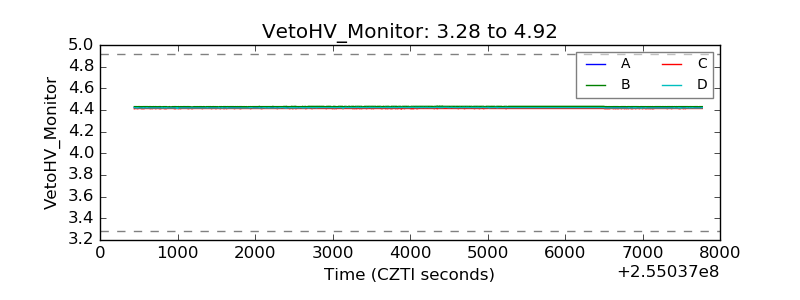 |
| Veto LLD | 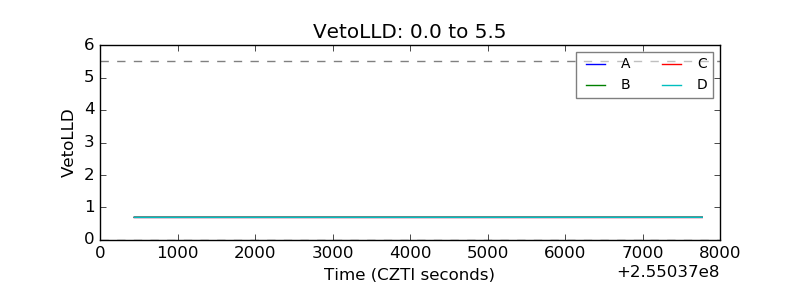 |
| Alpha Counter | 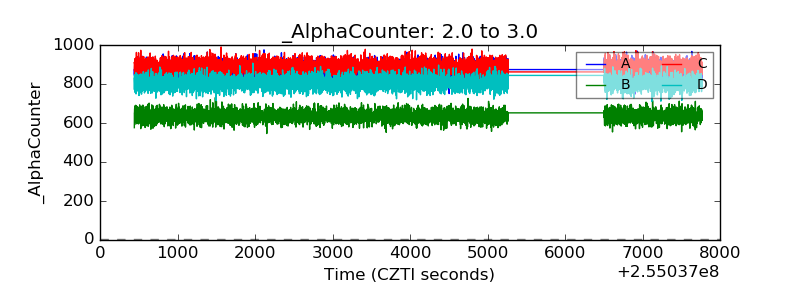 |
| _CPM_Rate | 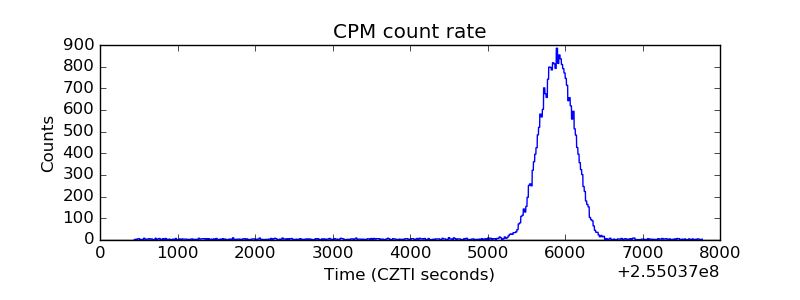 |
| CZT Counter | 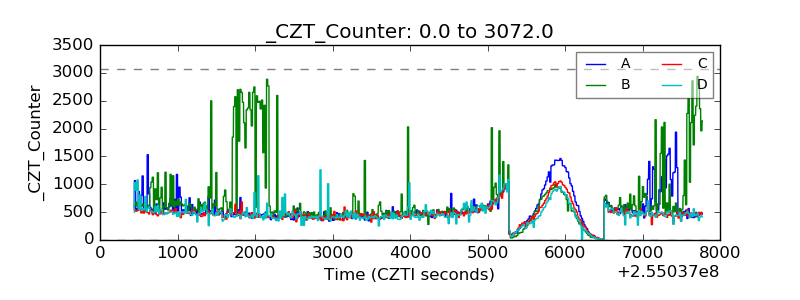 |
| +2.5 Volts monitor | 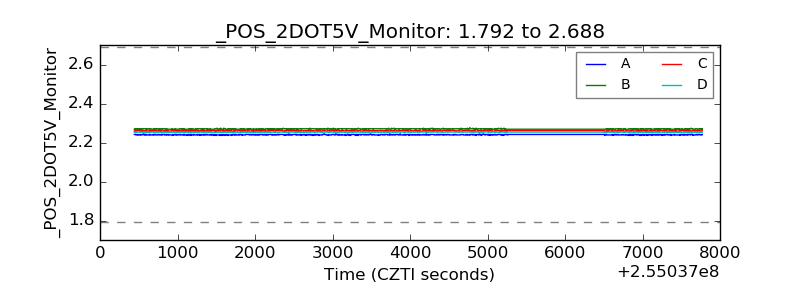 |
| +5 Volts monitor |  |
| _ROLL_ROT | 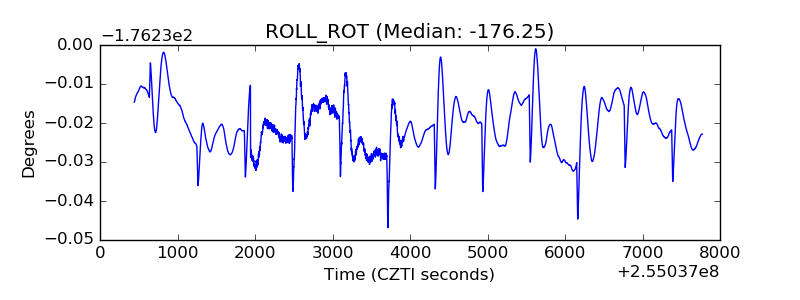 |
| _Roll_DEC | 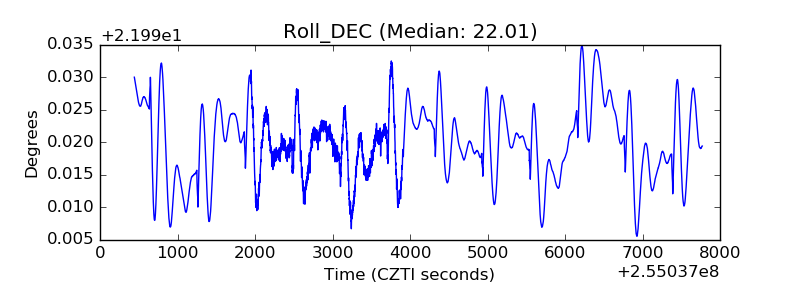 |
| _Roll_RA | 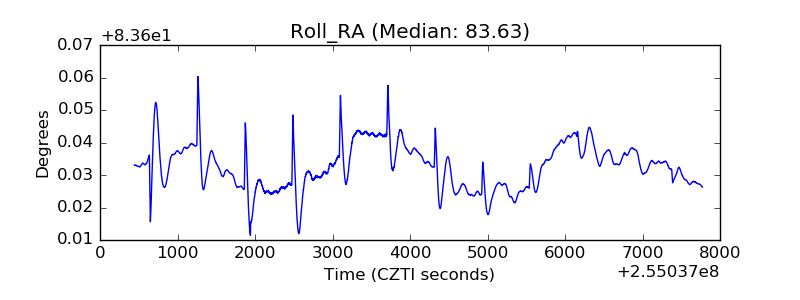 |
| Veto Counter | 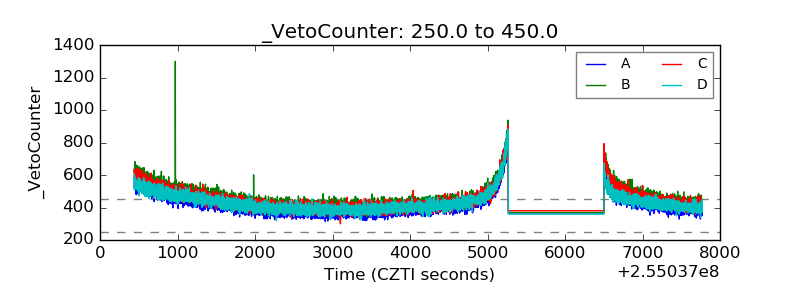 |