| Param | Original file | Final file |
|---|---|---|
| Filename | modeM0/AS1A04_174T01_9000001876_12667cztM0_level2.evt | modeM0/AS1A04_174T01_9000001876_12667cztM0_level2_quad_clean.evt |
| Size (bytes) | 508,936,320 | 87,851,520 |
| Size | 485.4 MB | 83.8 MB |
| Events in quadrant A | 3,197,500 | 583,032 |
| Events in quadrant B | 5,062,700 | 505,041 |
| Events in quadrant C | 2,893,842 | 581,977 |
| Events in quadrant D | 3,834,861 | 553,983 |
| Mode M9 | |||
|---|---|---|---|
| Quadrant | BADHDUFLAG | Total packets | Discarded packets |
| A | 0 | 10 | 0 |
| B | 0 | 10 | 0 |
| C | 0 | 10 | 0 |
| D | 0 | 10 | 0 |
| Mode M0 | |||
|---|---|---|---|
| Quadrant | BADHDUFLAG | Total packets | Discarded packets |
| A | 0 | 13630 | 3 |
| B | 0 | 19234 | 1 |
| C | 0 | 12760 | 1 |
| D | 0 | 15666 | 1 |
| Mode SS | |||
|---|---|---|---|
| Quadrant | BADHDUFLAG | Total packets | Discarded packets |
| A | 0 | 128 | 0 |
| B | 0 | 128 | 0 |
| C | 0 | 128 | 0 |
| D | 0 | 128 | 0 |
| Quadrant | Total seconds | Saturated seconds | Saturation percentage |
|---|---|---|---|
| A | 6244 | 18 | 0.288277% |
| B | 6244 | 866 | 13.869315% |
| C | 6244 | 10 | 0.160154% |
| D | 6244 | 110 | 1.761691% |
Noise dominated data is calculated using 1-second bins in cleaned event files. If a bin has >2000 counts, and if more than 50% of those come from <1% of pixels, then it is considered to be noise-dominated and hence unusable.
| Quadrant | # 1 sec bins | Bins with >0 counts | Bins with >2000 counts | High rate bins dominated by noise | Noise dominated (total time) | Noise dominated (detector-on time) | Marked lightcurve |
|---|---|---|---|---|---|---|---|
| A | 7262 | 6247 | 2 | 2 | 0.03% | 0.03% | 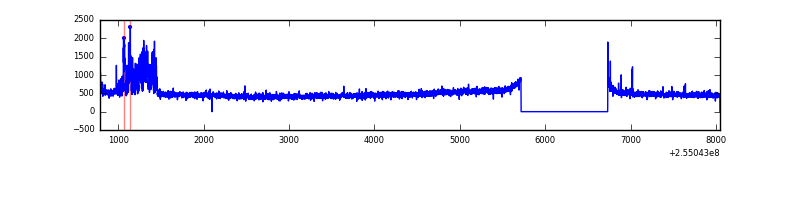 |
| B | 7262 | 6246 | 625 | 625 | 8.61% | 10.01% | 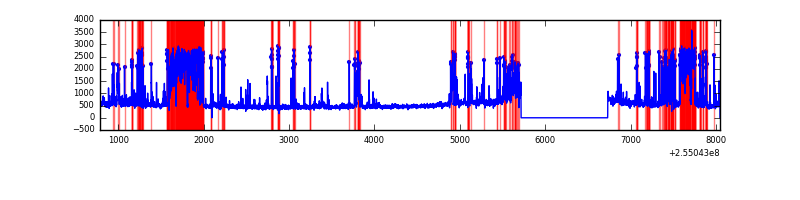 |
| C | 7262 | 6247 | 0 | 0 | 0.00% | 0.00% | 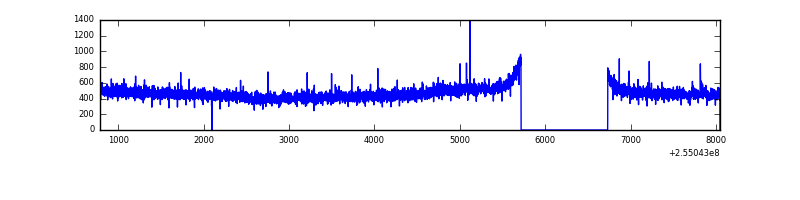 |
| D | 7262 | 6246 | 211 | 211 | 2.91% | 3.38% | 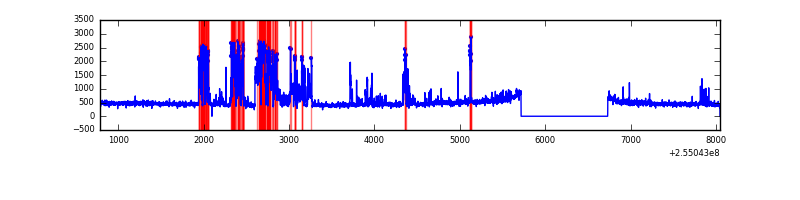 |
Top three noisy pixels from each quadrant. If the there are fewer than three noisy pixels in the level2.evt file, extra rows are filled as -1
| Pixel properties | Quadrant properties | ||||||
|---|---|---|---|---|---|---|---|
| Quadrant | DetID | PixID | Counts | Sigma | Mean | Median | Sigma |
| A | 5 | 112 | 225375 | 1465.32 | 755 | 740 | 153.3 |
| A | 12 | 189 | 38570 | 246.77 | 755 | 740 | 153.3 |
| A | 8 | 15 | 19829 | 124.52 | 755 | 740 | 153.3 |
| B | 4 | 239 | 2105304 | 16044.79 | 694 | 679 | 131.2 |
| B | 11 | 51 | 71698 | 541.42 | 694 | 679 | 131.2 |
| B | 3 | 64 | 53886 | 405.63 | 694 | 679 | 131.2 |
| C | 15 | 208 | 6258 | 32.09 | 739 | 747 | 171.7 |
| C | 13 | 61 | 5331 | 26.7 | 739 | 747 | 171.7 |
| C | 14 | 234 | 4608 | 22.49 | 739 | 747 | 171.7 |
| D | 1 | 52 | 885810 | 5001.47 | 725 | 711 | 177.0 |
| D | 13 | 104 | 75251 | 421.21 | 725 | 711 | 177.0 |
| D | 13 | 249 | 70143 | 392.34 | 725 | 711 | 177.0 |
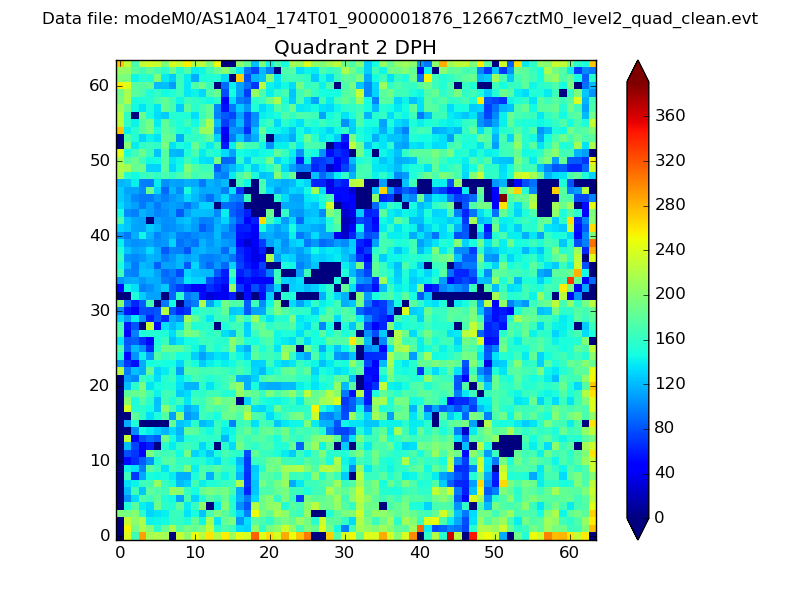
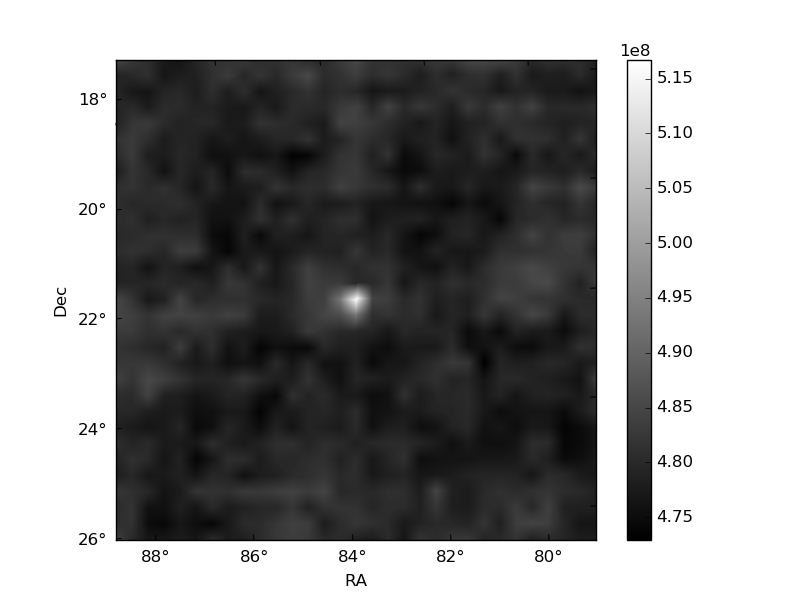
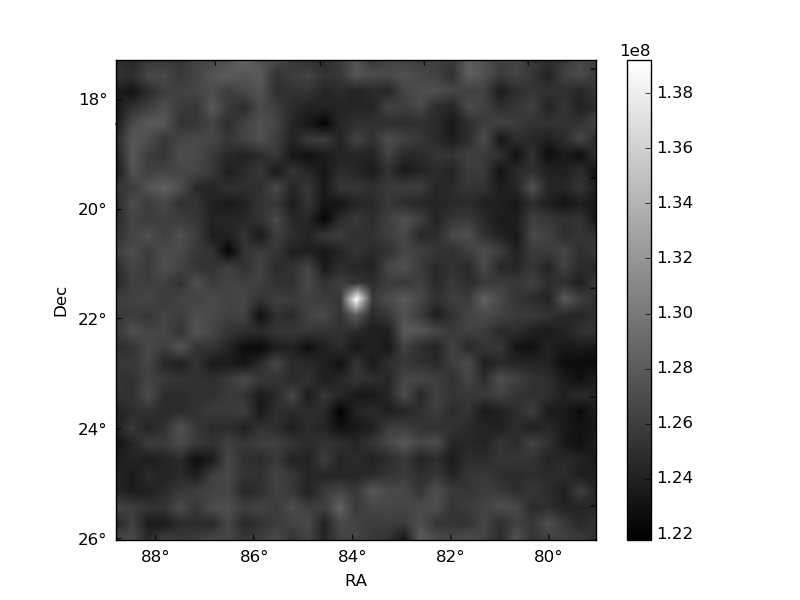
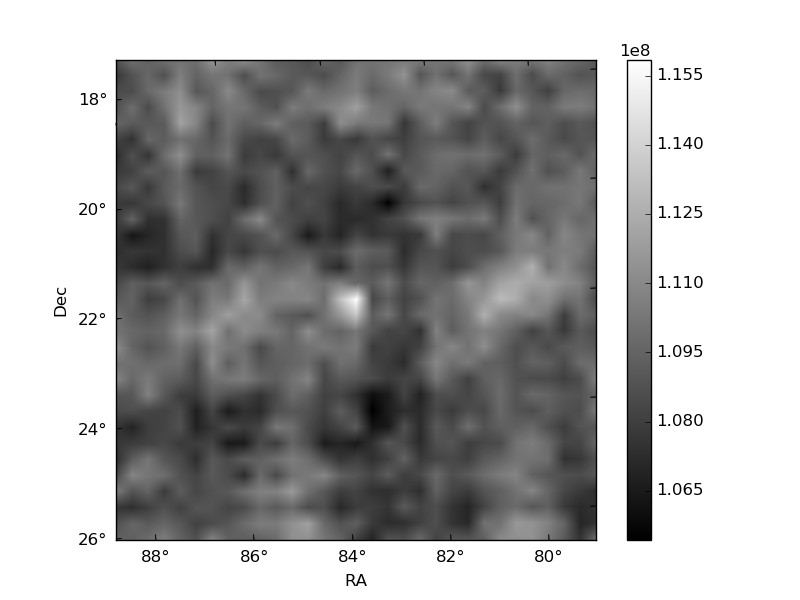
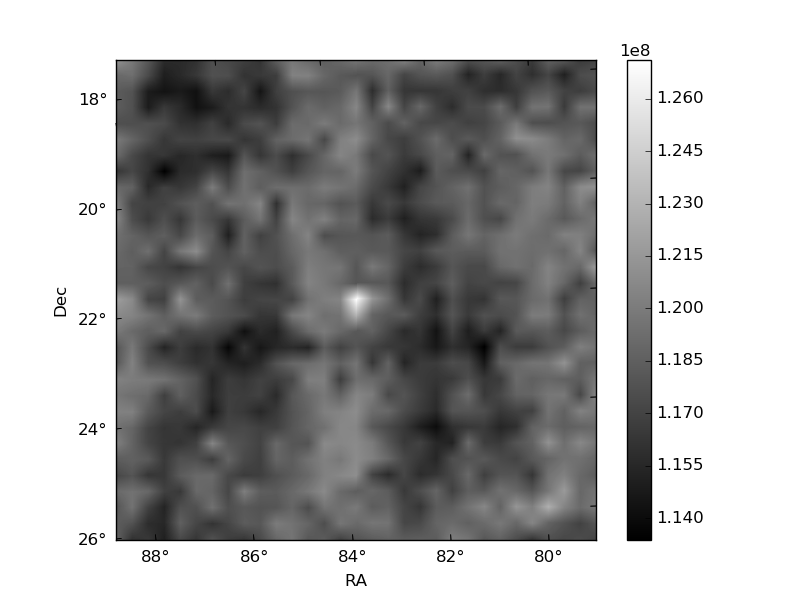
Histogram calculated using DETX and DETY for each event in the final _common_clean file
| Quadrant A | 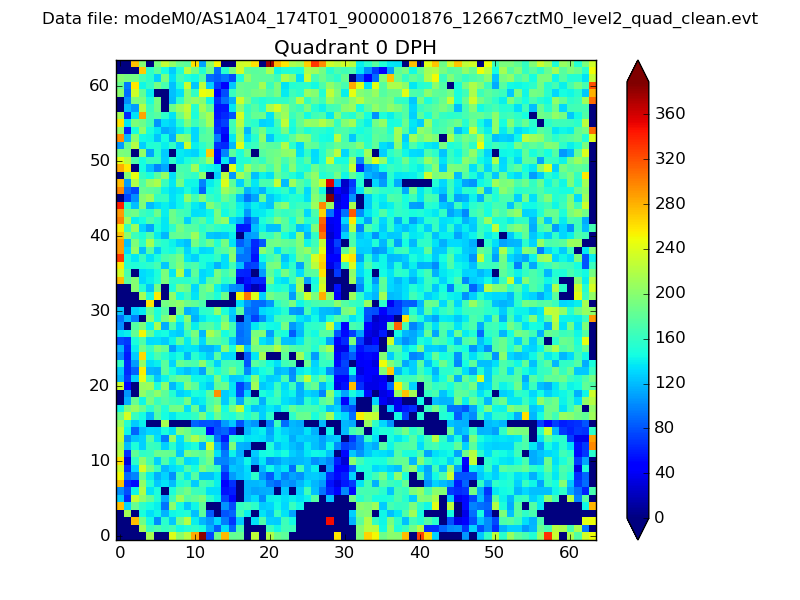 |
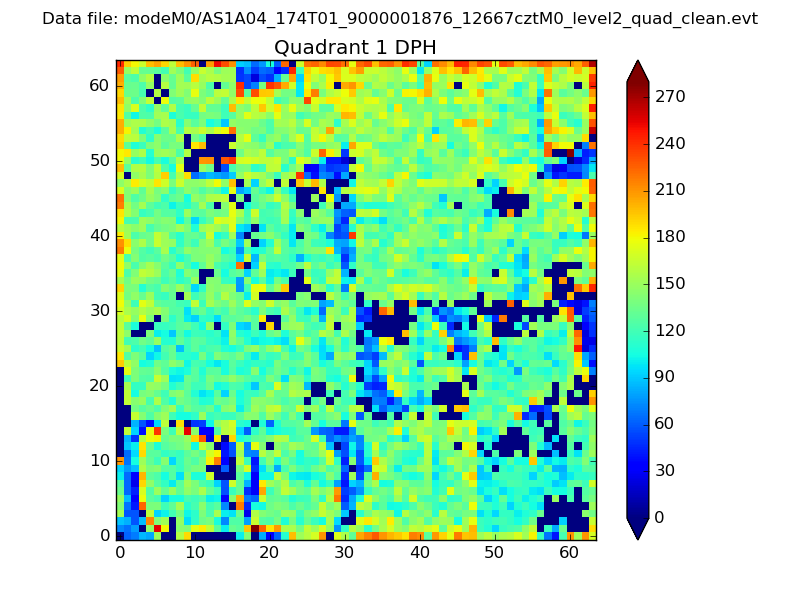 |
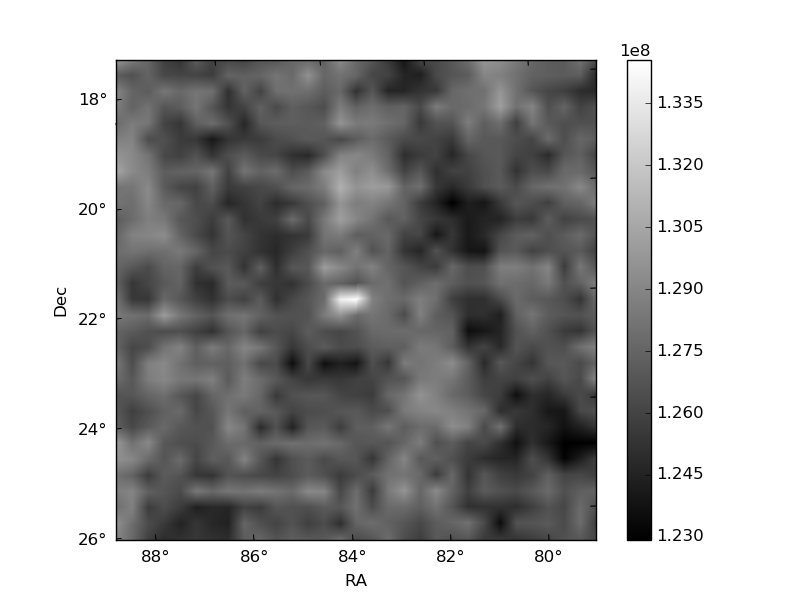
Quadrant B |
|---|---|---|---|
| Quadrant D | 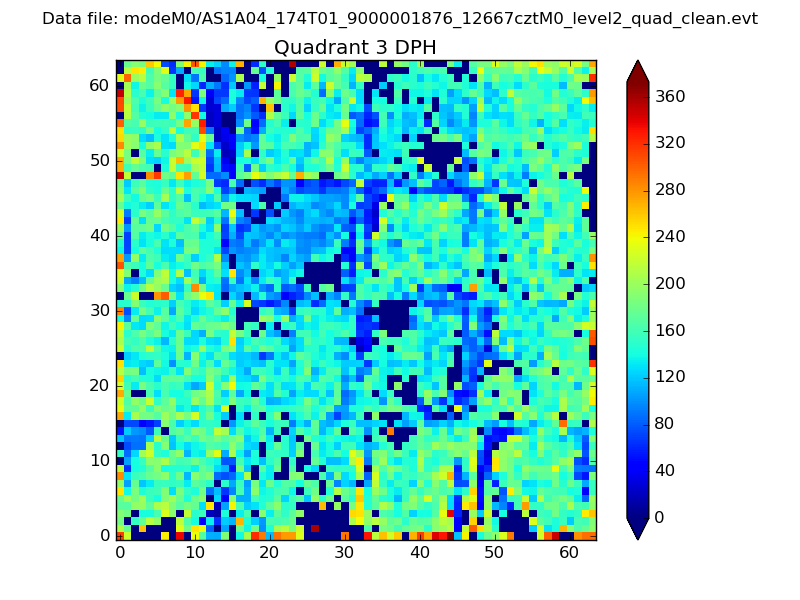 |
 |
Quadrant C |
| Plot type | Count rate plots | Images |
|---|---|---|
| Comparison with Poisson distribution Blue bars denote a histogram of data divided into 1 sec bins. Red curve is a Poisson curve with rate = median count rate of data. |
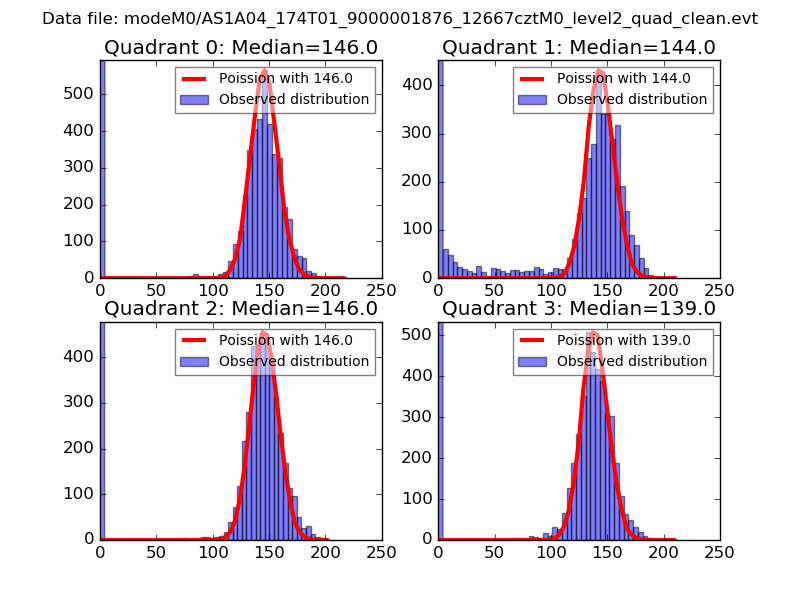 |
 |
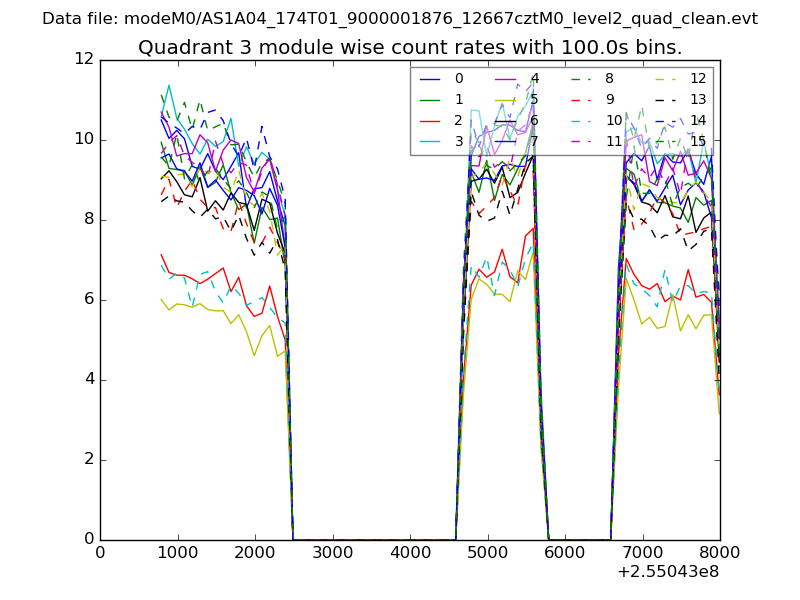
| Quadrant-wise count rates Data is divided into 100 sec bins |
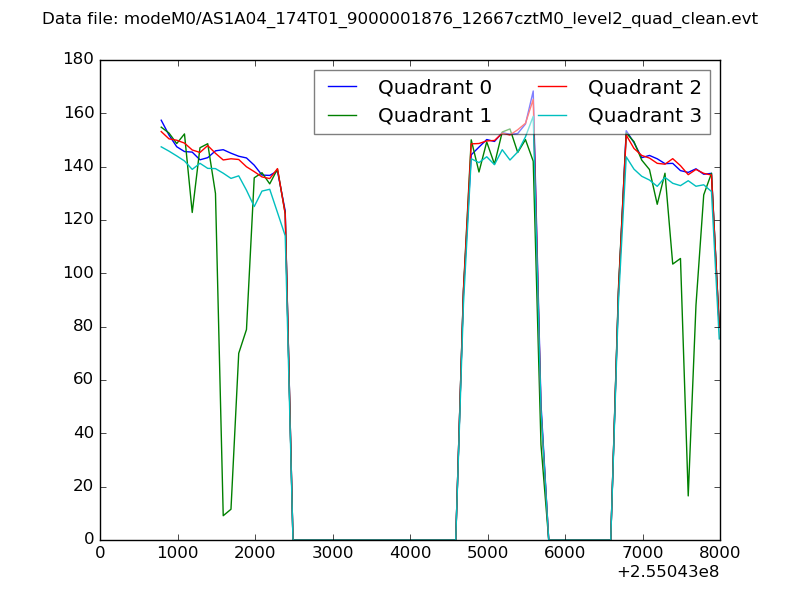 |
|
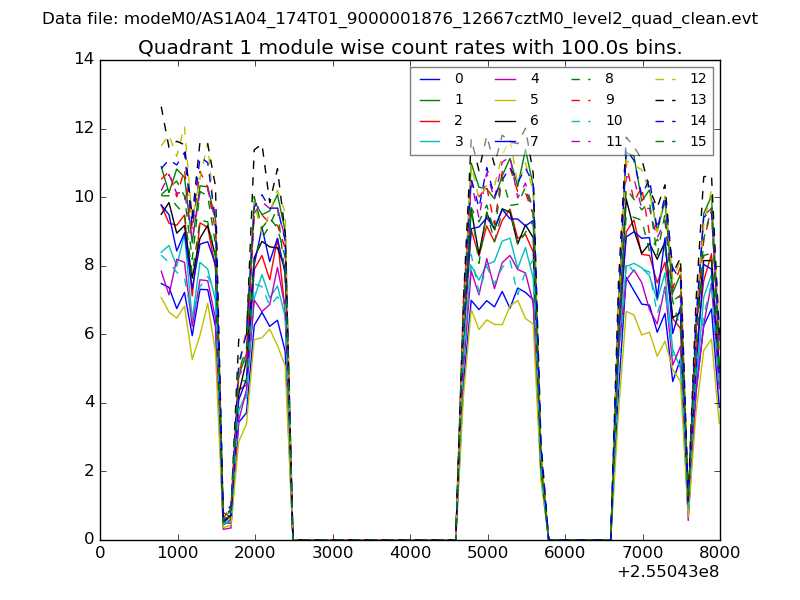
| Module-wise count rates for Quadrant A Data is divided into 100 sec bins |
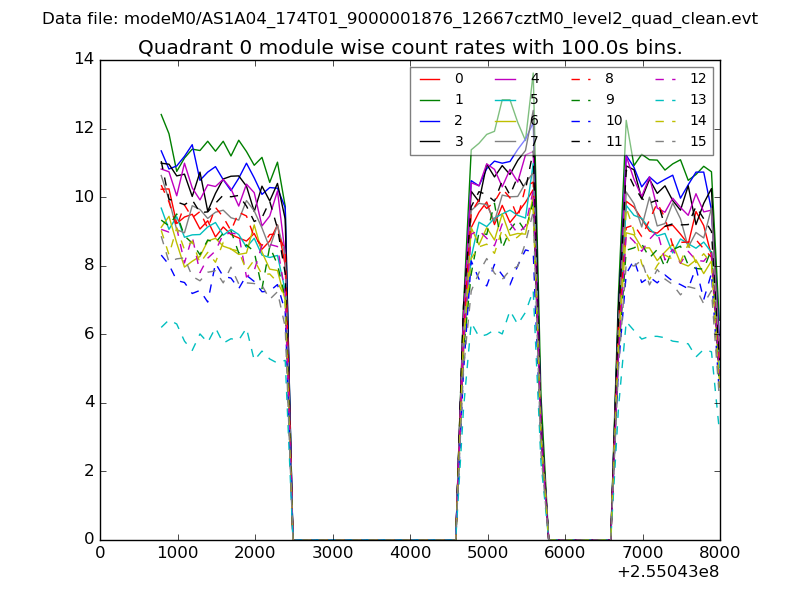 |
 |
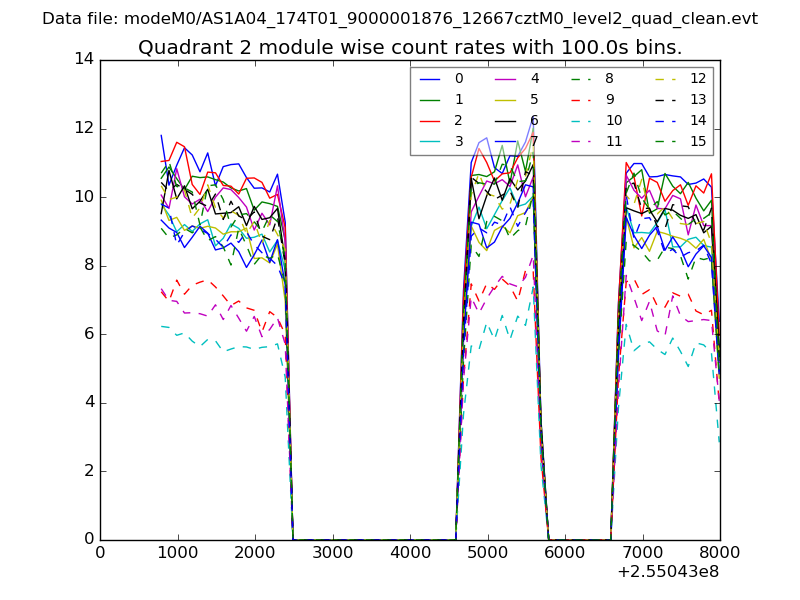
| Module-wise count rates for Quadrant B Data is divided into 100 sec bins |
 |
 |
| Module-wise count rates for Quadrant C Data is divided into 100 sec bins |
 |
 |
| Module-wise count rates for Quadrant D Data is divided into 100 sec bins |
 |
 |
| Parameter | Plot |
|---|---|
| CZT HV Monitor | 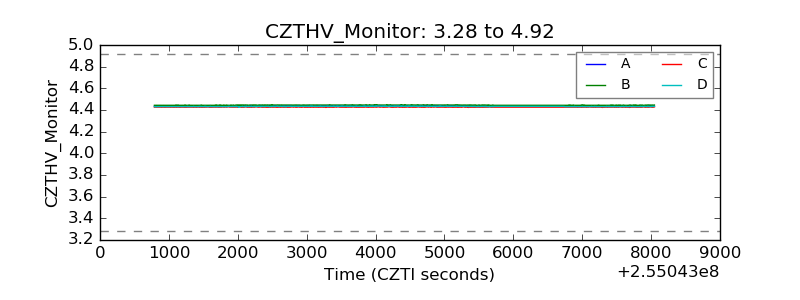 |
| D_VDD | 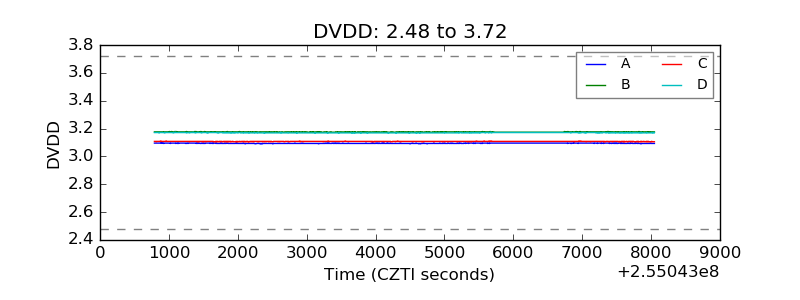 |
| Temperature 1 | 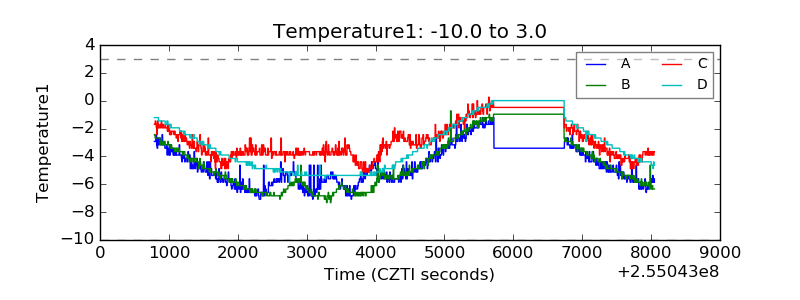 |
| Veto HV Monitor | 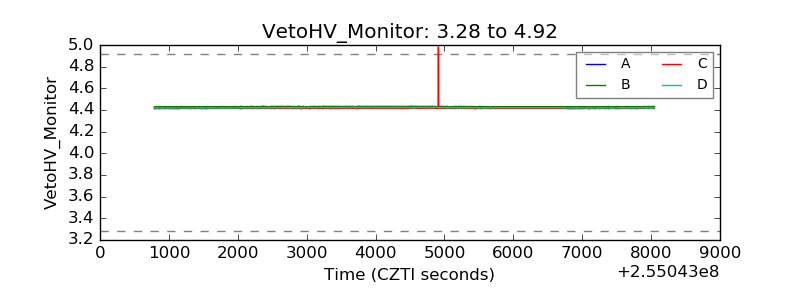 |
| Veto LLD | 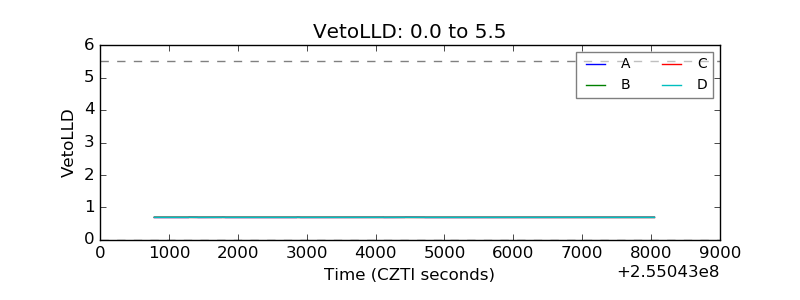 |
| Alpha Counter | 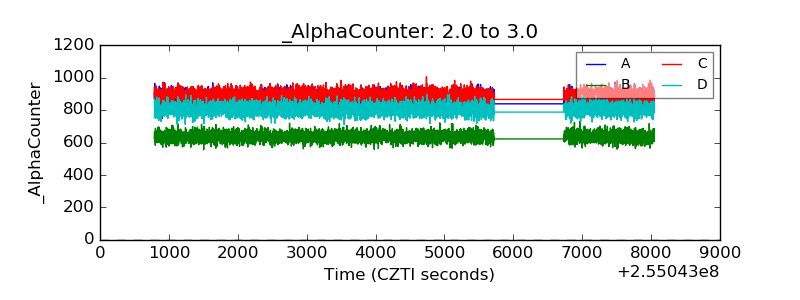 |
| _CPM_Rate | 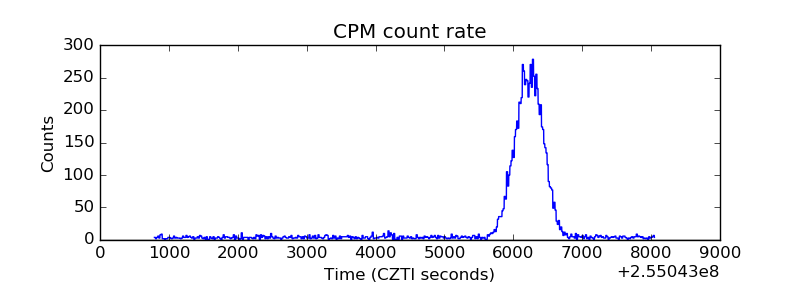 |
| CZT Counter | 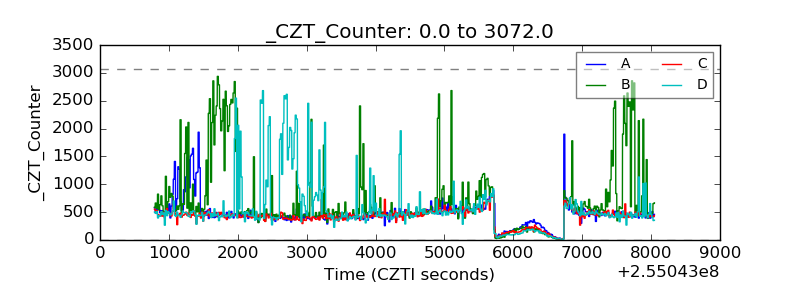 |
| +2.5 Volts monitor |  |
| +5 Volts monitor | 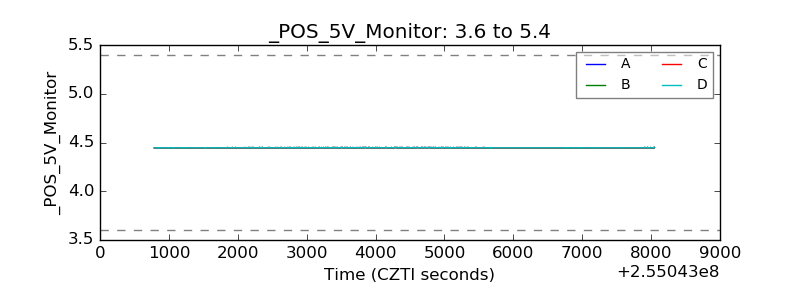 |
| _ROLL_ROT | 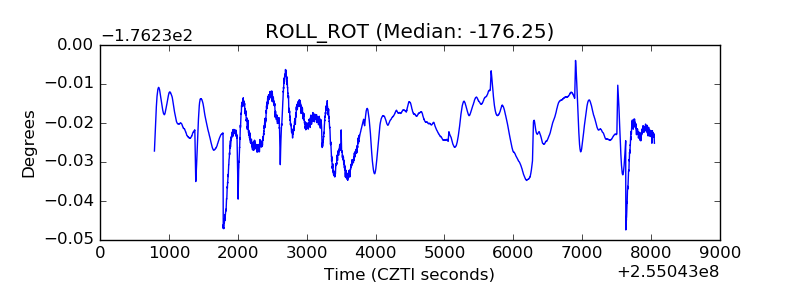 |
| _Roll_DEC | 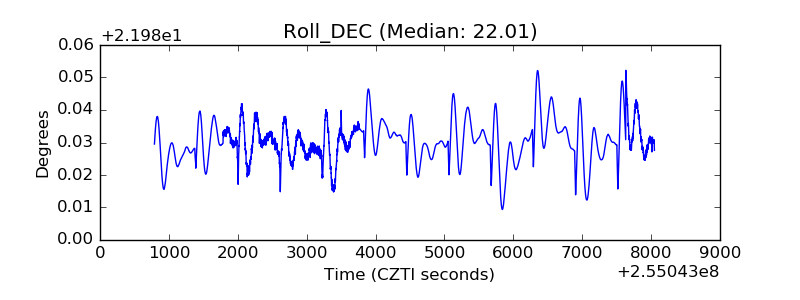 |
| _Roll_RA | 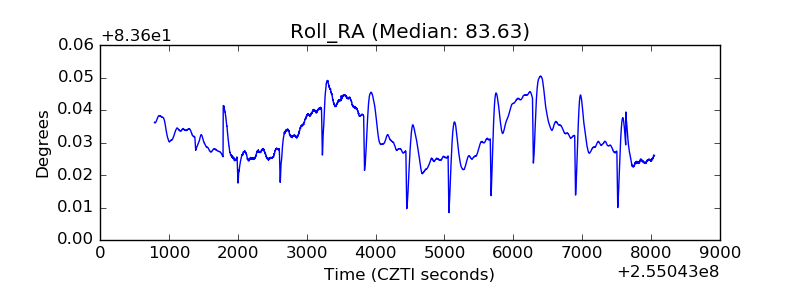 |
| Veto Counter | 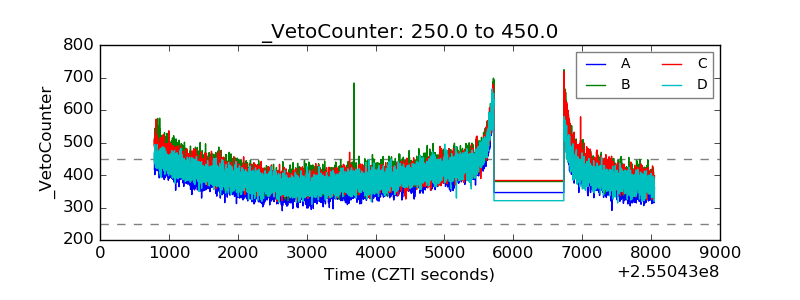 |