| Param | Original file | Final file |
|---|---|---|
| Filename | modeM0/AS1A04_174T01_9000001876_12668cztM0_level2.evt | modeM0/AS1A04_174T01_9000001876_12668cztM0_level2_quad_clean.evt |
| Size (bytes) | 524,980,800 | 96,229,440 |
| Size | 500.7 MB | 91.8 MB |
| Events in quadrant A | 3,228,126 | 635,853 |
| Events in quadrant B | 5,488,390 | 555,016 |
| Events in quadrant C | 3,164,846 | 634,969 |
| Events in quadrant D | 3,549,887 | 607,899 |
| Mode M9 | |||
|---|---|---|---|
| Quadrant | BADHDUFLAG | Total packets | Discarded packets |
| A | 0 | 6 | 0 |
| B | 0 | 6 | 0 |
| C | 0 | 6 | 0 |
| D | 0 | 6 | 0 |
| Mode M0 | |||
|---|---|---|---|
| Quadrant | BADHDUFLAG | Total packets | Discarded packets |
| A | 0 | 14137 | 2 |
| B | 0 | 21012 | 1 |
| C | 0 | 14027 | 1 |
| D | 0 | 15334 | 1 |
| Mode SS | |||
|---|---|---|---|
| Quadrant | BADHDUFLAG | Total packets | Discarded packets |
| A | 0 | 140 | 0 |
| B | 0 | 140 | 0 |
| C | 0 | 140 | 0 |
| D | 0 | 140 | 0 |
| Quadrant | Total seconds | Saturated seconds | Saturation percentage |
|---|---|---|---|
| A | 6891 | 20 | 0.290234% |
| B | 6891 | 918 | 13.321724% |
| C | 6891 | 16 | 0.232187% |
| D | 6891 | 39 | 0.565956% |
Noise dominated data is calculated using 1-second bins in cleaned event files. If a bin has >2000 counts, and if more than 50% of those come from <1% of pixels, then it is considered to be noise-dominated and hence unusable.
| Quadrant | # 1 sec bins | Bins with >0 counts | Bins with >2000 counts | High rate bins dominated by noise | Noise dominated (total time) | Noise dominated (detector-on time) | Marked lightcurve |
|---|---|---|---|---|---|---|---|
| A | 7512 | 6893 | 0 | 0 | 0.00% | 0.00% | 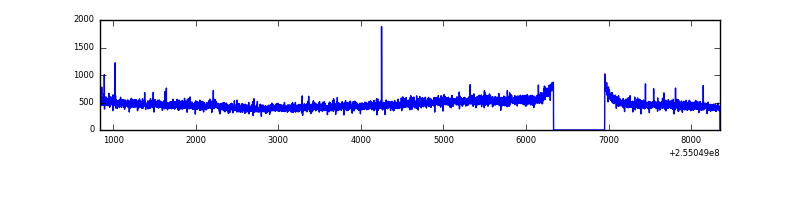 |
| B | 7512 | 6892 | 679 | 679 | 9.04% | 9.85% | 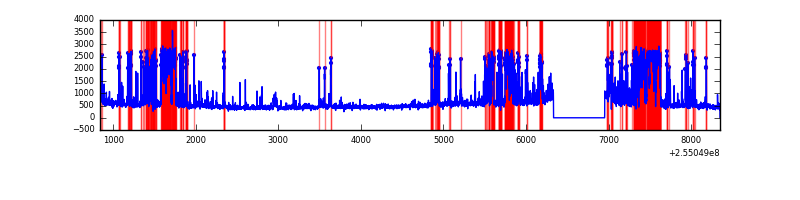 |
| C | 7512 | 6892 | 0 | 0 | 0.00% | 0.00% | 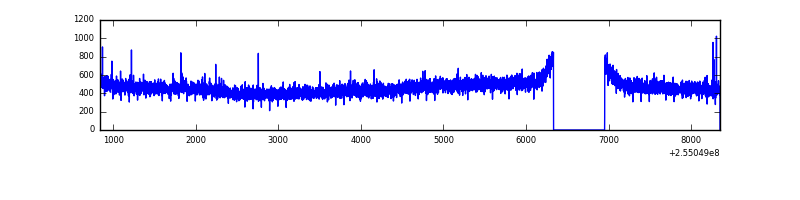 |
| D | 7512 | 6893 | 81 | 81 | 1.08% | 1.18% | 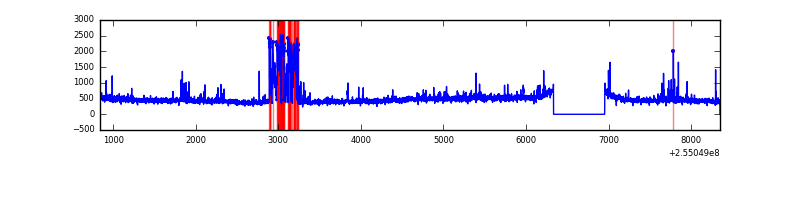 |
Top three noisy pixels from each quadrant. If the there are fewer than three noisy pixels in the level2.evt file, extra rows are filled as -1
| Pixel properties | Quadrant properties | ||||||
|---|---|---|---|---|---|---|---|
| Quadrant | DetID | PixID | Counts | Sigma | Mean | Median | Sigma |
| A | 8 | 15 | 26832 | 153.76 | 826 | 808 | 169.2 |
| A | 12 | 189 | 21773 | 123.87 | 826 | 808 | 169.2 |
| A | 0 | 226 | 7254 | 38.09 | 826 | 808 | 169.2 |
| B | 4 | 239 | 2134036 | 14787.1 | 762 | 746 | 144.3 |
| B | 3 | 64 | 185453 | 1280.31 | 762 | 746 | 144.3 |
| B | 11 | 51 | 109756 | 755.61 | 762 | 746 | 144.3 |
| C | 15 | 208 | 10768 | 52.99 | 806 | 812 | 187.9 |
| C | 13 | 61 | 5856 | 26.85 | 806 | 812 | 187.9 |
| C | 8 | 128 | 4280 | 18.46 | 806 | 812 | 187.9 |
| D | 1 | 52 | 370721 | 1926.19 | 797 | 781 | 192.1 |
| D | 13 | 104 | 63001 | 323.96 | 797 | 781 | 192.1 |
| D | 10 | 157 | 51173 | 262.38 | 797 | 781 | 192.1 |
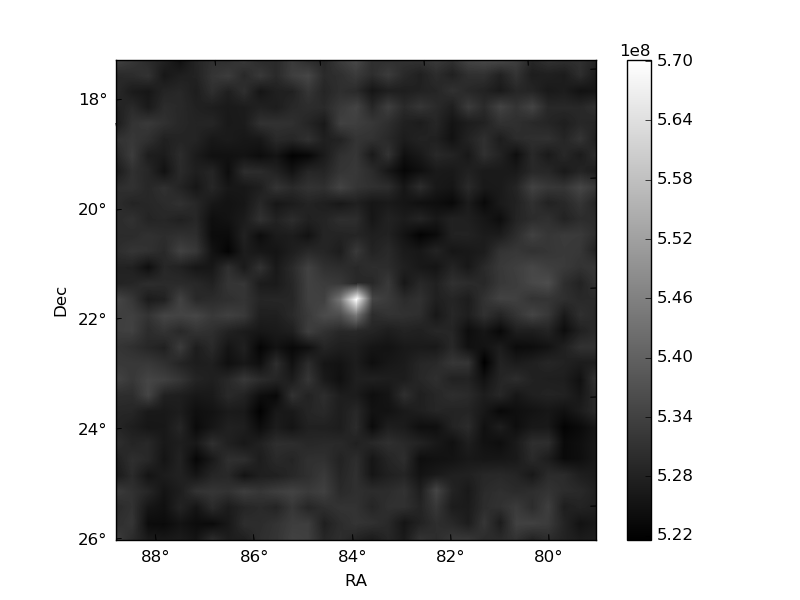
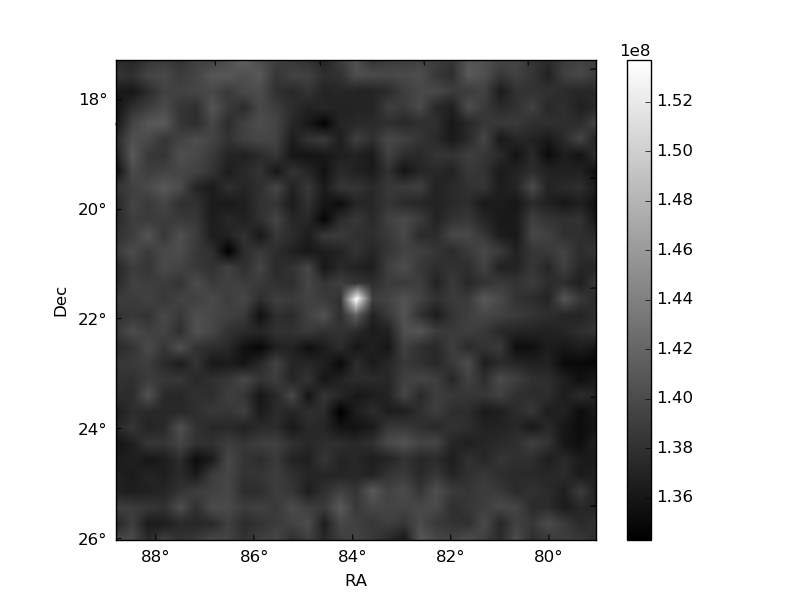
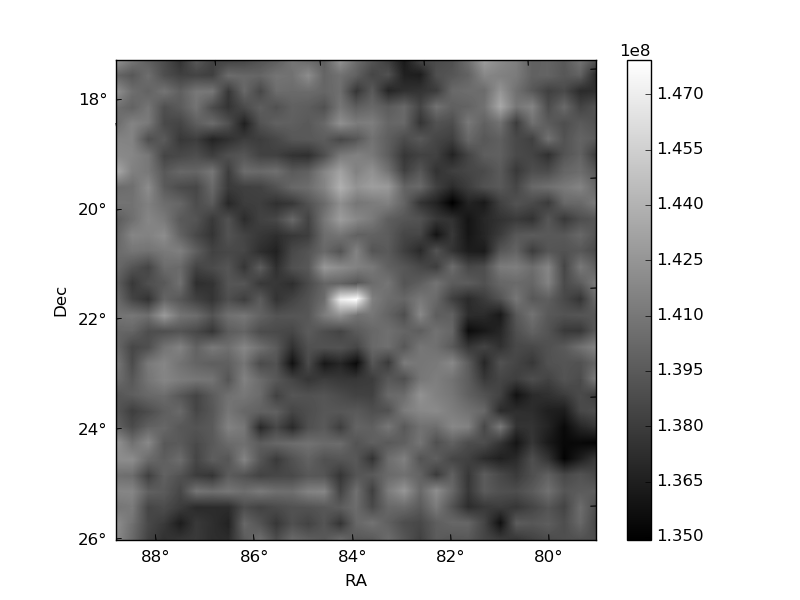
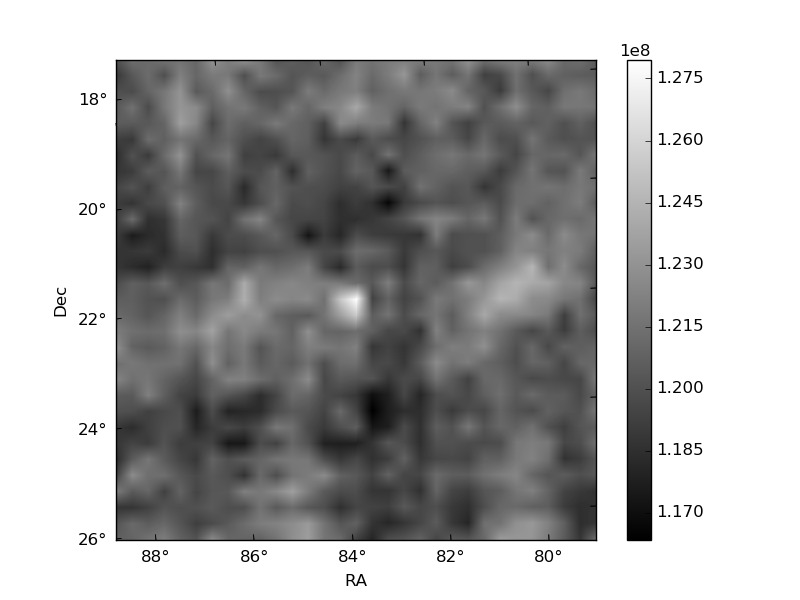
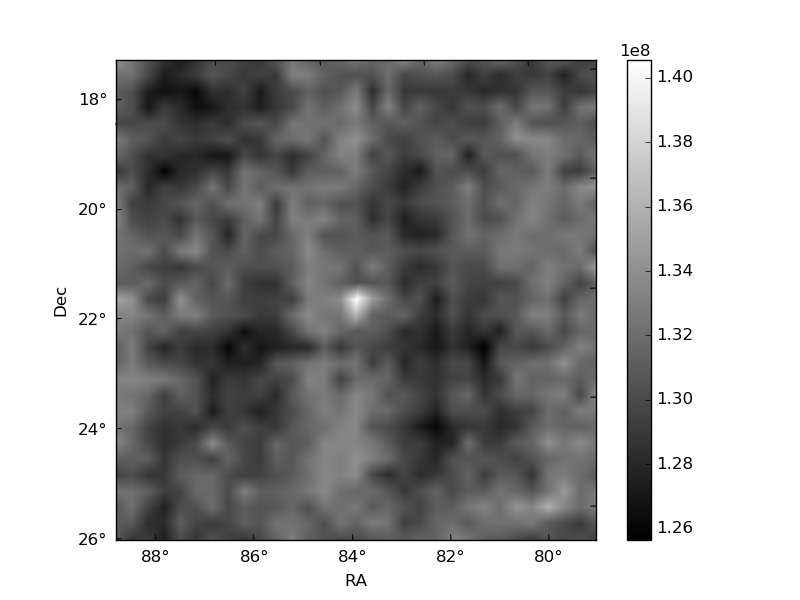
Histogram calculated using DETX and DETY for each event in the final _common_clean file
| Quadrant A | 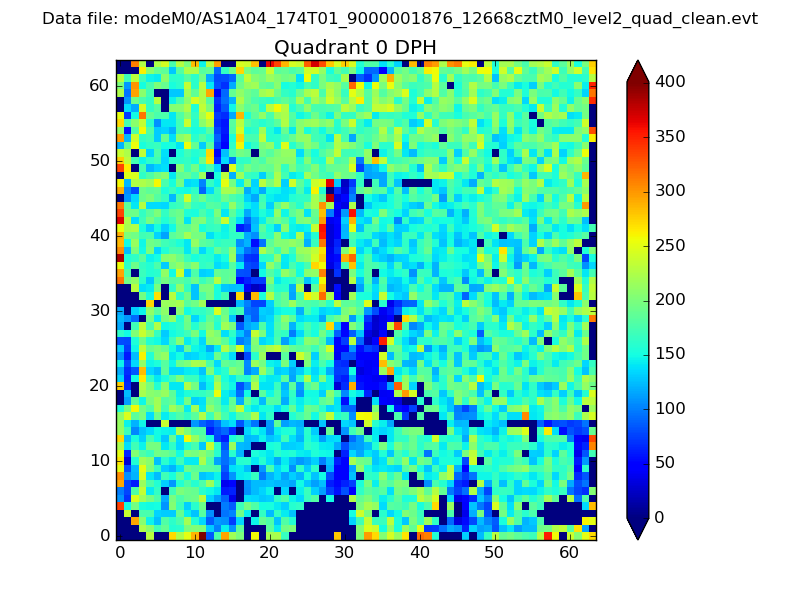 |
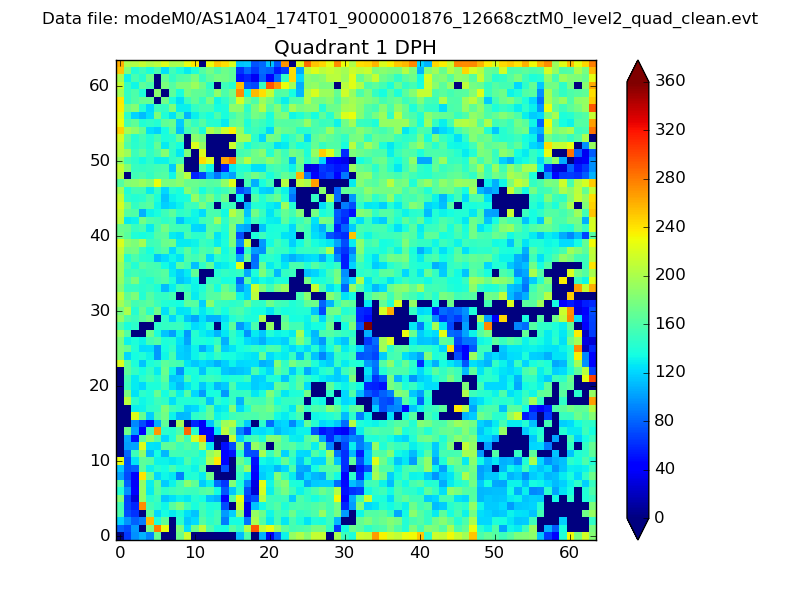 |
Quadrant B |
|---|---|---|---|
| Quadrant D | 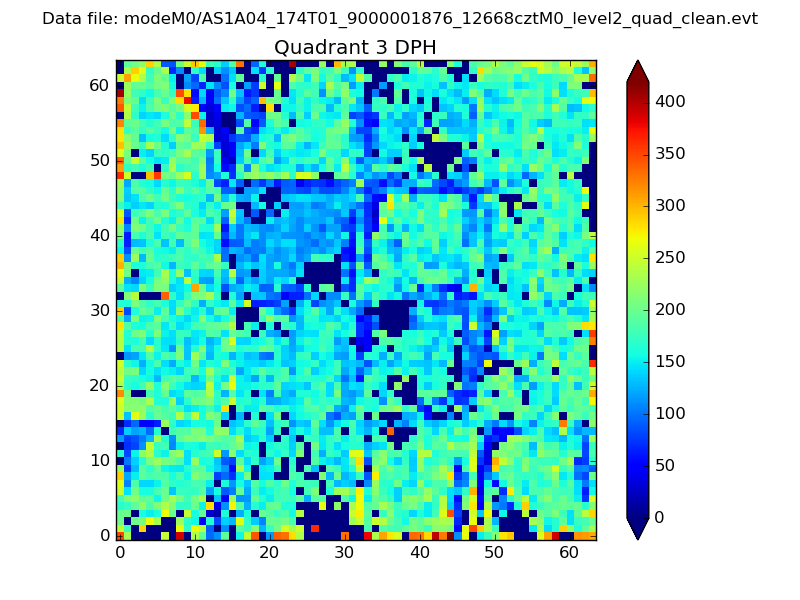 |
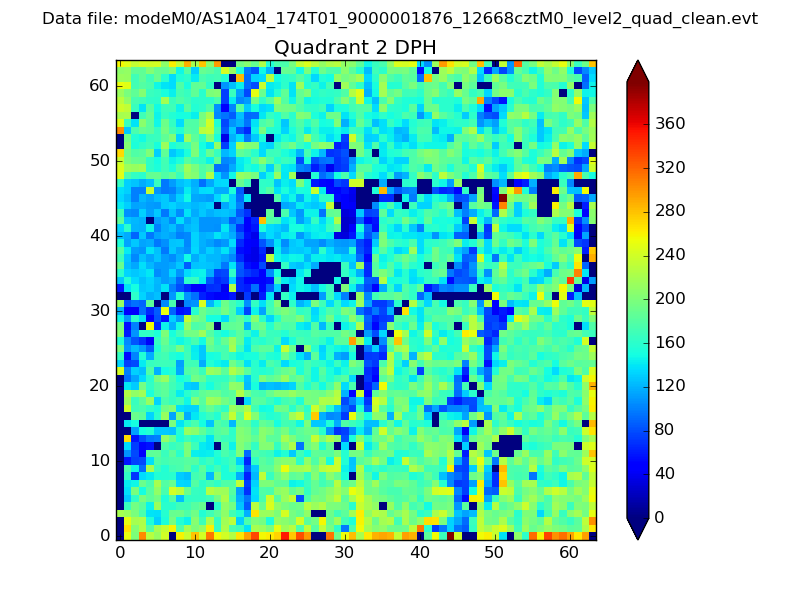 |
Quadrant C |
| Plot type | Count rate plots | Images |
|---|---|---|
| Comparison with Poisson distribution Blue bars denote a histogram of data divided into 1 sec bins. Red curve is a Poisson curve with rate = median count rate of data. |
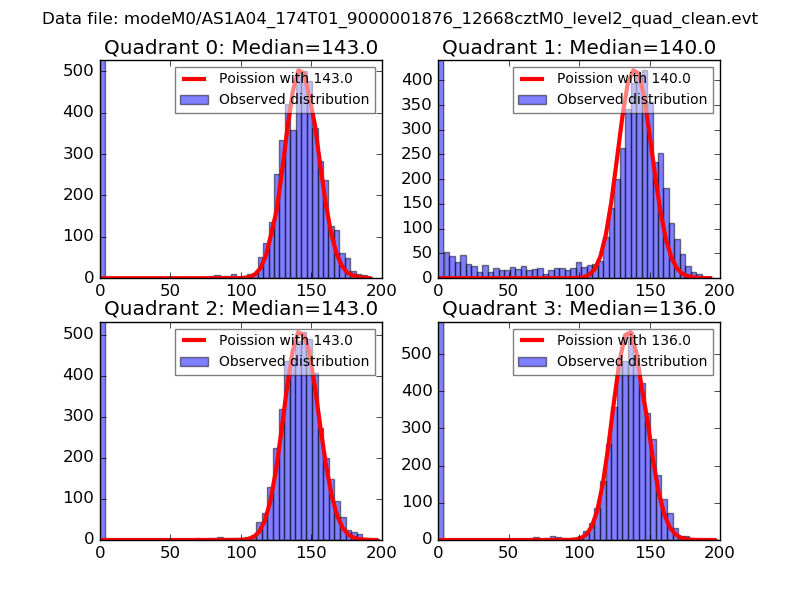 |
 |
| Quadrant-wise count rates Data is divided into 100 sec bins |
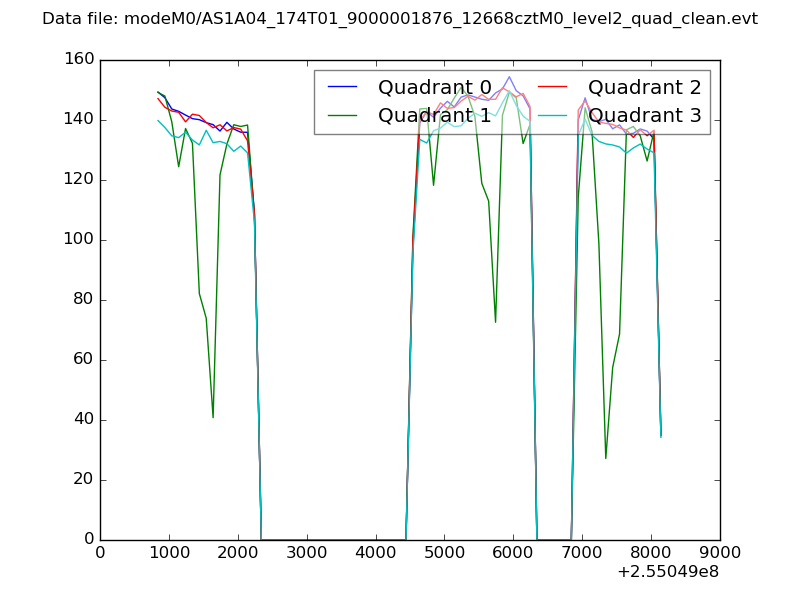 |
|
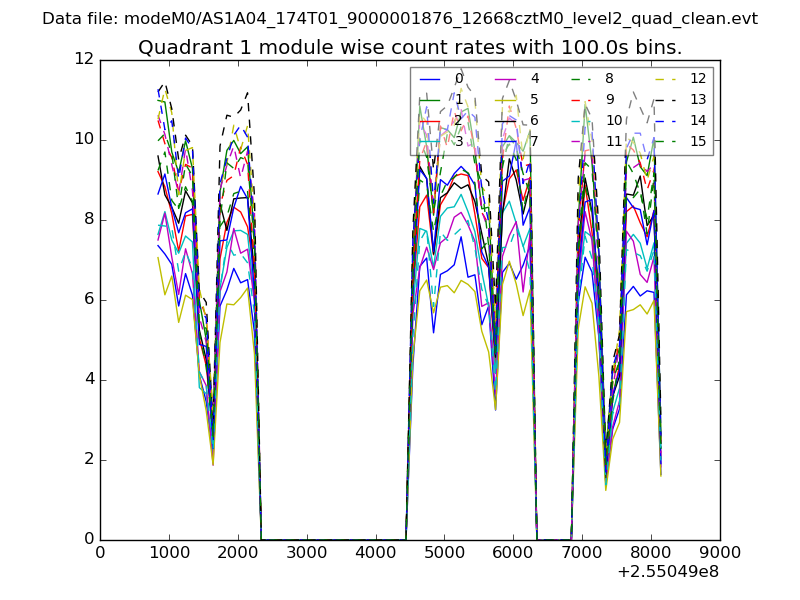
| Module-wise count rates for Quadrant A Data is divided into 100 sec bins |
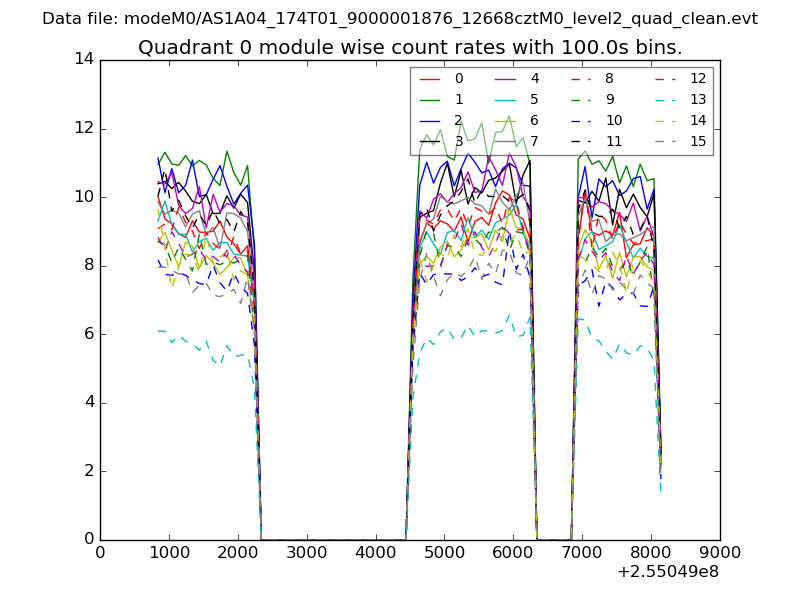 |
 |
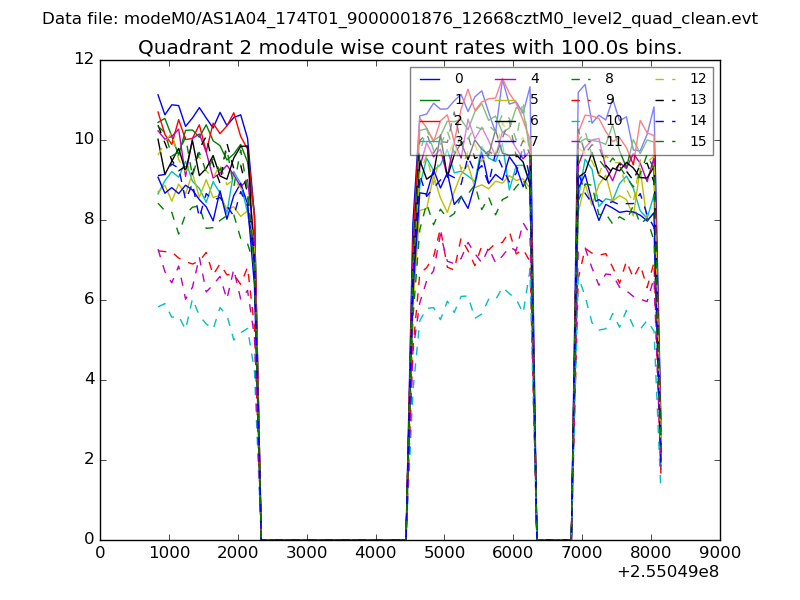
| Module-wise count rates for Quadrant B Data is divided into 100 sec bins |
 |
 |
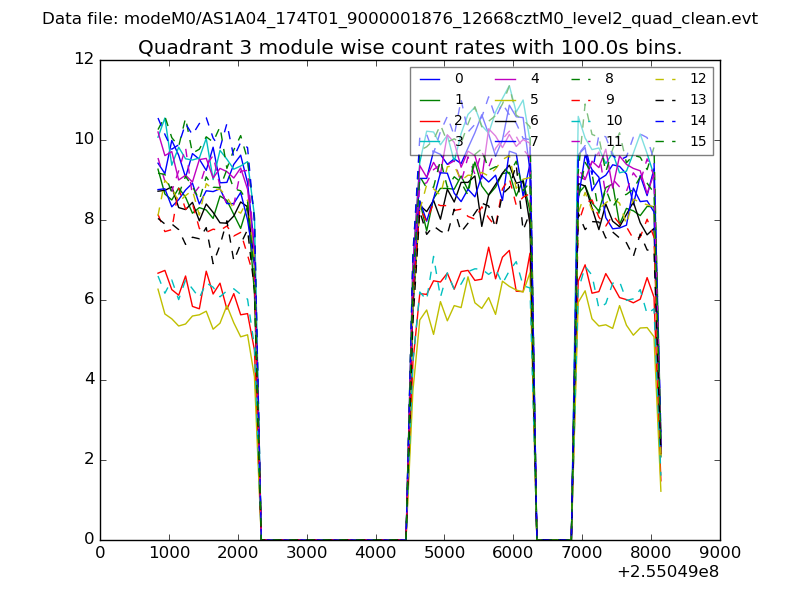
| Module-wise count rates for Quadrant C Data is divided into 100 sec bins |
 |
 |
| Module-wise count rates for Quadrant D Data is divided into 100 sec bins |
 |
 |
| Parameter | Plot |
|---|---|
| CZT HV Monitor | 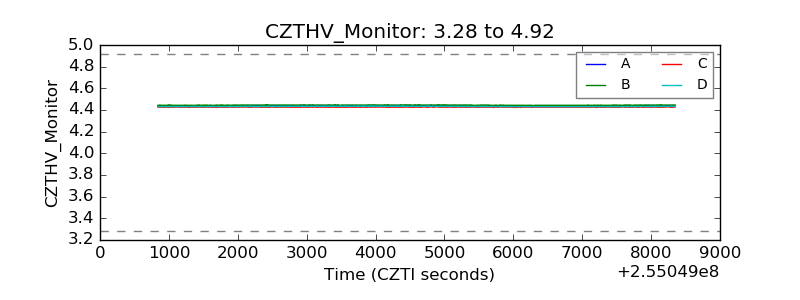 |
| D_VDD | 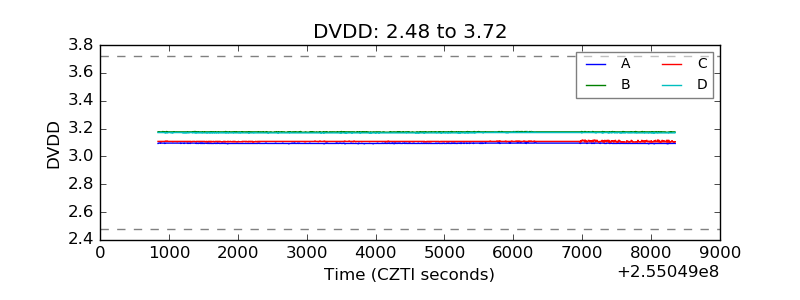 |
| Temperature 1 | 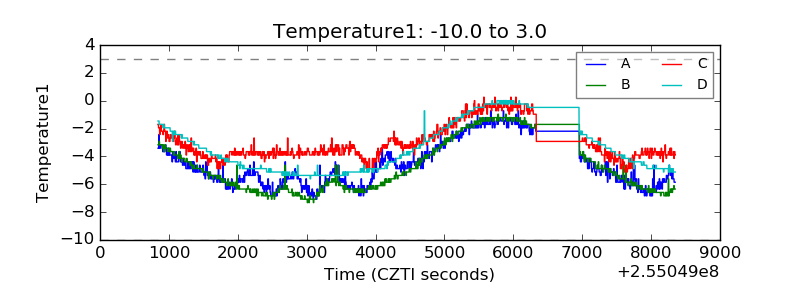 |
| Veto HV Monitor | 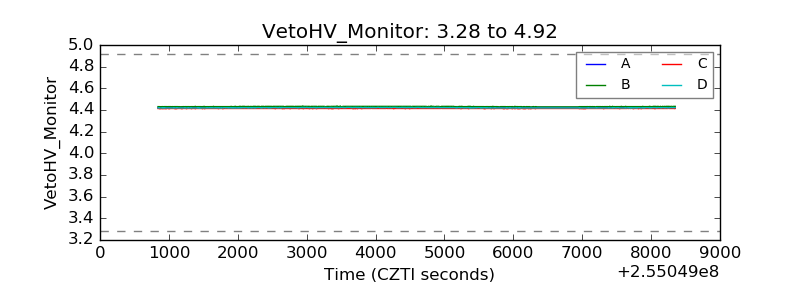 |
| Veto LLD | 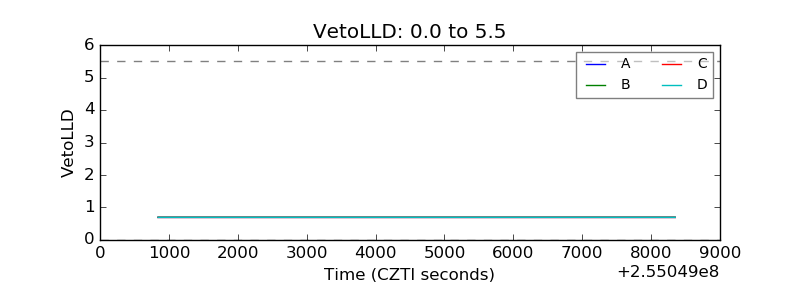 |
| Alpha Counter | 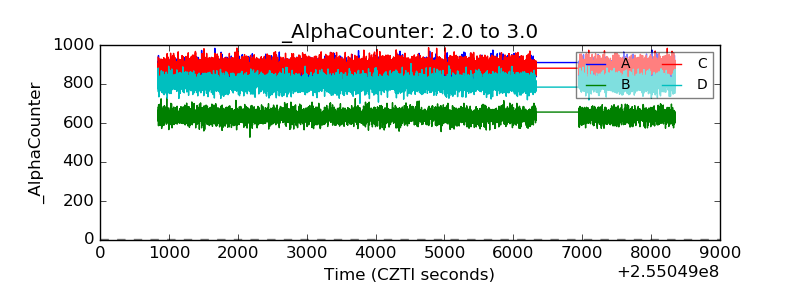 |
| _CPM_Rate | 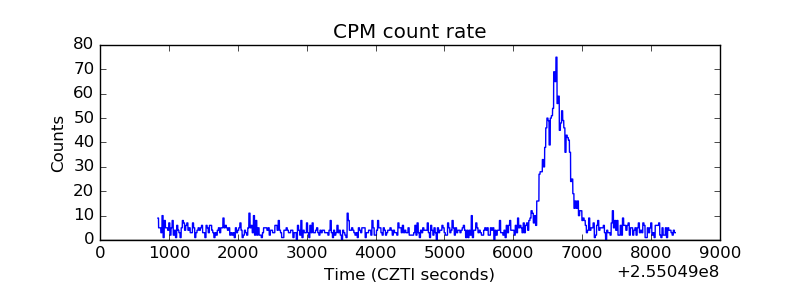 |
| CZT Counter | 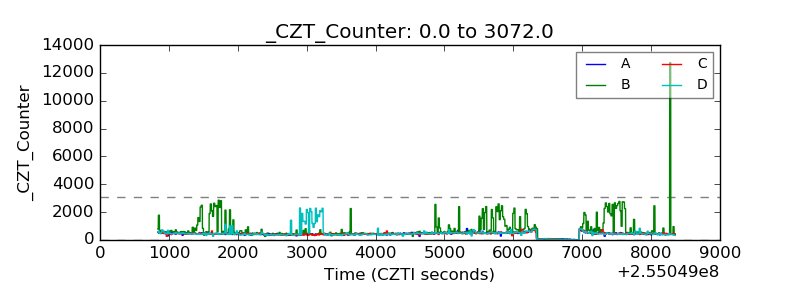 |
| +2.5 Volts monitor |  |
| +5 Volts monitor | 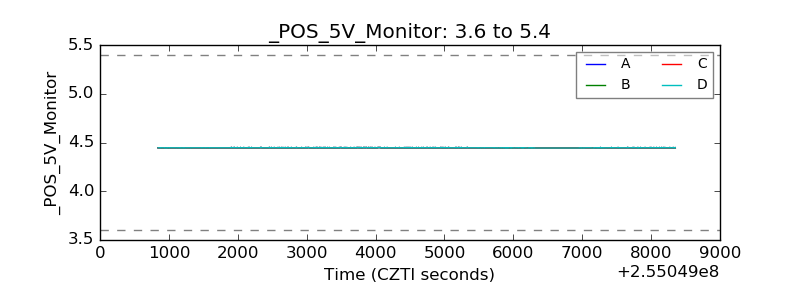 |
| _ROLL_ROT | 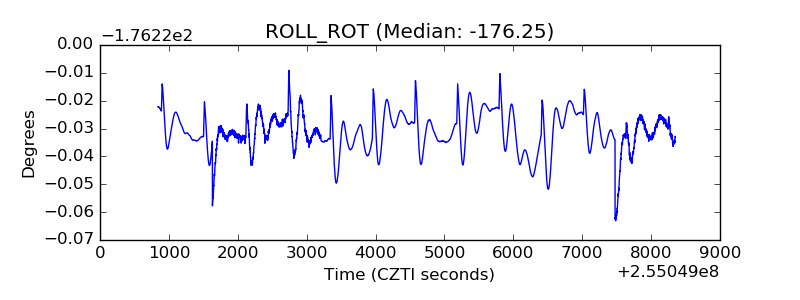 |
| _Roll_DEC | 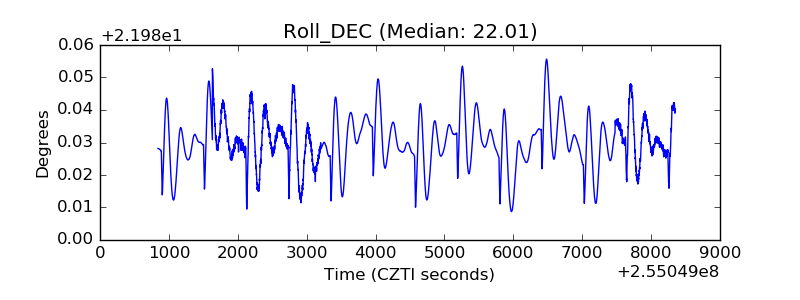 |
| _Roll_RA | 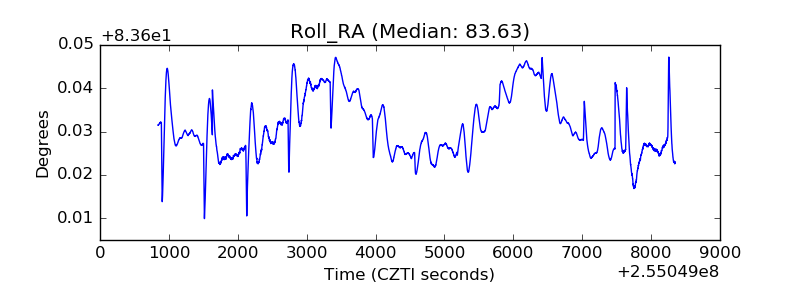 |
| Veto Counter | 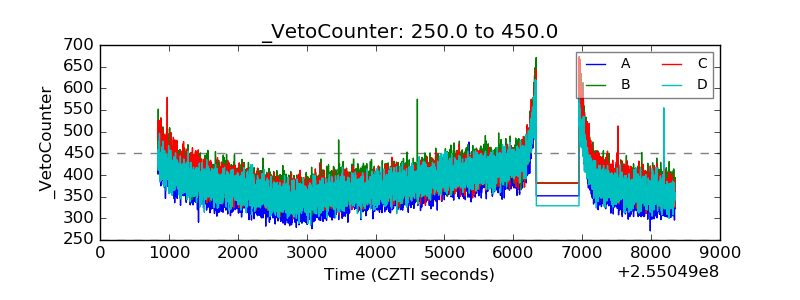 |