| Param | Original file | Final file |
|---|---|---|
| Filename | modeM0/AS1A04_174T01_9000001876_12669cztM0_level2.evt | modeM0/AS1A04_174T01_9000001876_12669cztM0_level2_quad_clean.evt |
| Size (bytes) | 556,007,040 | 99,486,720 |
| Size | 530.2 MB | 94.9 MB |
| Events in quadrant A | 3,506,868 | 649,248 |
| Events in quadrant B | 5,489,901 | 573,070 |
| Events in quadrant C | 3,505,303 | 650,938 |
| Events in quadrant D | 3,829,553 | 619,447 |
| Mode M9 | |||
|---|---|---|---|
| Quadrant | BADHDUFLAG | Total packets | Discarded packets |
| A | 0 | 9 | 0 |
| B | 0 | 9 | 0 |
| C | 0 | 9 | 0 |
| D | 0 | 9 | 0 |
| Mode M0 | |||
|---|---|---|---|
| Quadrant | BADHDUFLAG | Total packets | Discarded packets |
| A | 0 | 15436 | 3 |
| B | 0 | 21245 | 2 |
| C | 0 | 15425 | 2 |
| D | 0 | 16603 | 2 |
| Mode SS | |||
|---|---|---|---|
| Quadrant | BADHDUFLAG | Total packets | Discarded packets |
| A | 0 | 154 | 0 |
| B | 0 | 154 | 0 |
| C | 0 | 154 | 0 |
| D | 0 | 154 | 0 |
| Quadrant | Total seconds | Saturated seconds | Saturation percentage |
|---|---|---|---|
| A | 7468 | 86 | 1.151580% |
| B | 7468 | 907 | 12.145153% |
| C | 7468 | 37 | 0.495447% |
| D | 7468 | 91 | 1.218532% |
Noise dominated data is calculated using 1-second bins in cleaned event files. If a bin has >2000 counts, and if more than 50% of those come from <1% of pixels, then it is considered to be noise-dominated and hence unusable.
| Quadrant | # 1 sec bins | Bins with >0 counts | Bins with >2000 counts | High rate bins dominated by noise | Noise dominated (total time) | Noise dominated (detector-on time) | Marked lightcurve |
|---|---|---|---|---|---|---|---|
| A | 8394 | 7470 | 0 | 0 | 0.00% | 0.00% | 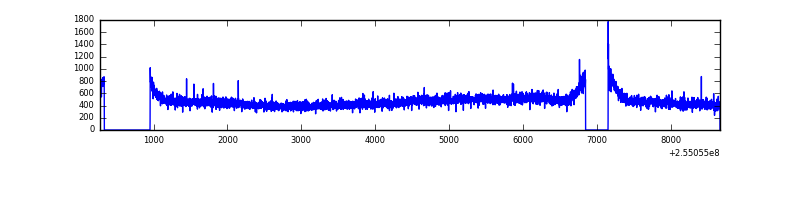 |
| B | 8394 | 7469 | 608 | 608 | 7.24% | 8.14% | 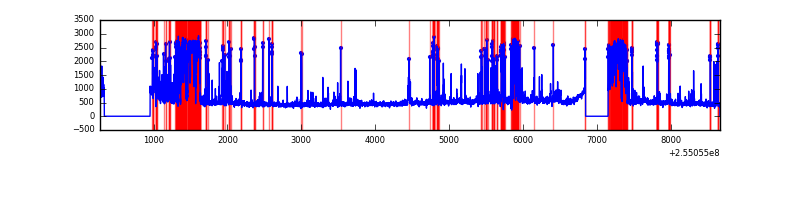 |
| C | 8394 | 7470 | 0 | 0 | 0.00% | 0.00% | 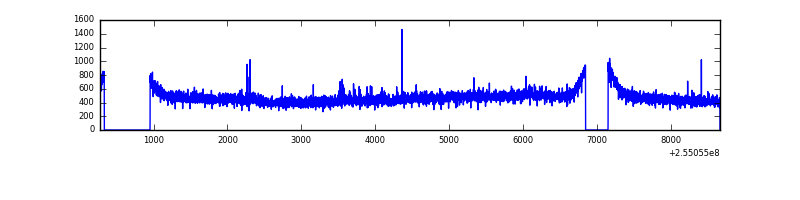 |
| D | 8394 | 7470 | 61 | 61 | 0.73% | 0.82% | 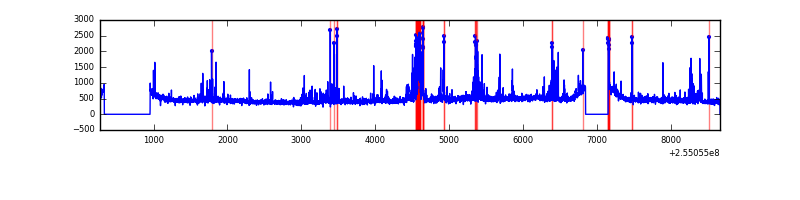 |
Top three noisy pixels from each quadrant. If the there are fewer than three noisy pixels in the level2.evt file, extra rows are filled as -1
| Pixel properties | Quadrant properties | ||||||
|---|---|---|---|---|---|---|---|
| Quadrant | DetID | PixID | Counts | Sigma | Mean | Median | Sigma |
| A | 12 | 189 | 15273 | 76.59 | 906 | 886 | 187.8 |
| A | 0 | 226 | 7878 | 37.22 | 906 | 886 | 187.8 |
| A | 12 | 194 | 7013 | 32.62 | 906 | 886 | 187.8 |
| B | 4 | 239 | 1903434 | 11721.21 | 840 | 820 | 162.3 |
| B | 3 | 64 | 124644 | 762.82 | 840 | 820 | 162.3 |
| B | 3 | 209 | 71418 | 434.92 | 840 | 820 | 162.3 |
| C | 15 | 208 | 23630 | 109.75 | 887 | 896 | 207.2 |
| C | 8 | 128 | 12684 | 56.9 | 887 | 896 | 207.2 |
| C | 8 | 112 | 6447 | 26.8 | 887 | 896 | 207.2 |
| D | 1 | 52 | 248662 | 1135.81 | 871 | 851 | 218.2 |
| D | 13 | 104 | 118252 | 538.09 | 871 | 851 | 218.2 |
| D | 13 | 249 | 80021 | 362.86 | 871 | 851 | 218.2 |
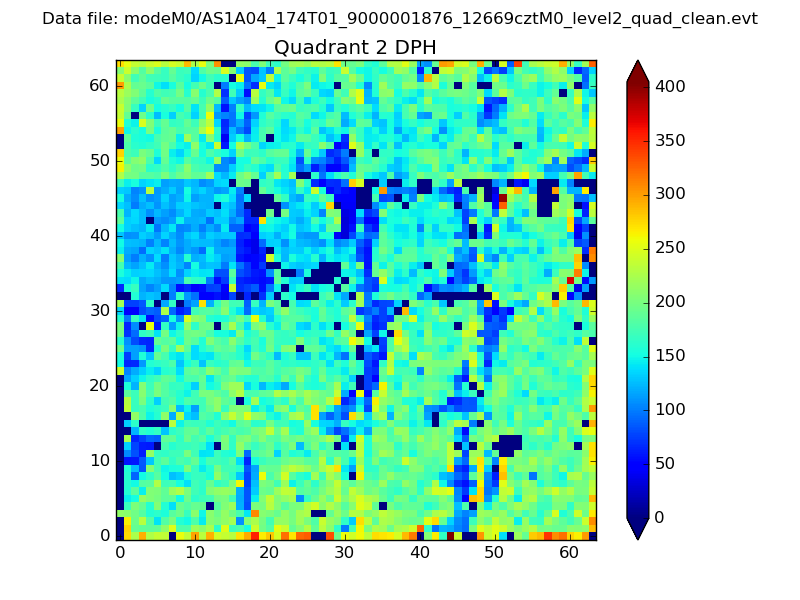
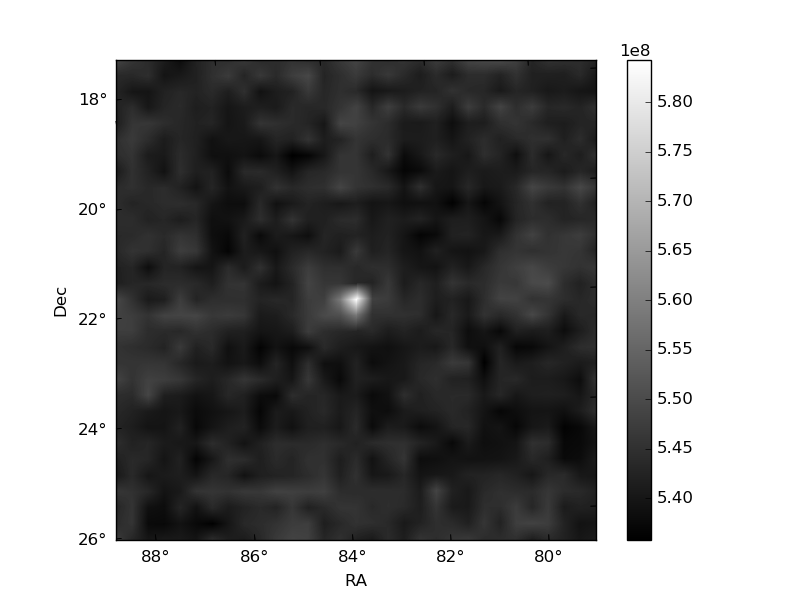
Histogram calculated using DETX and DETY for each event in the final _common_clean file
| Quadrant A | 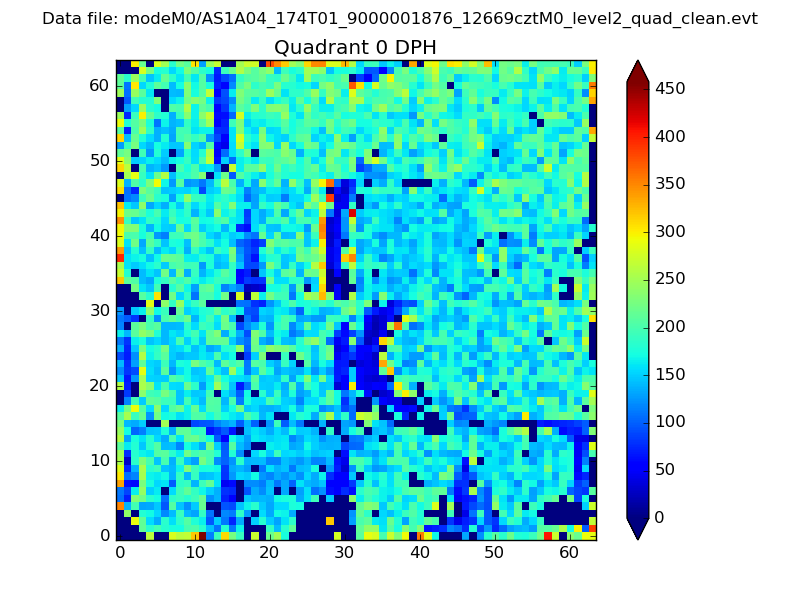 |
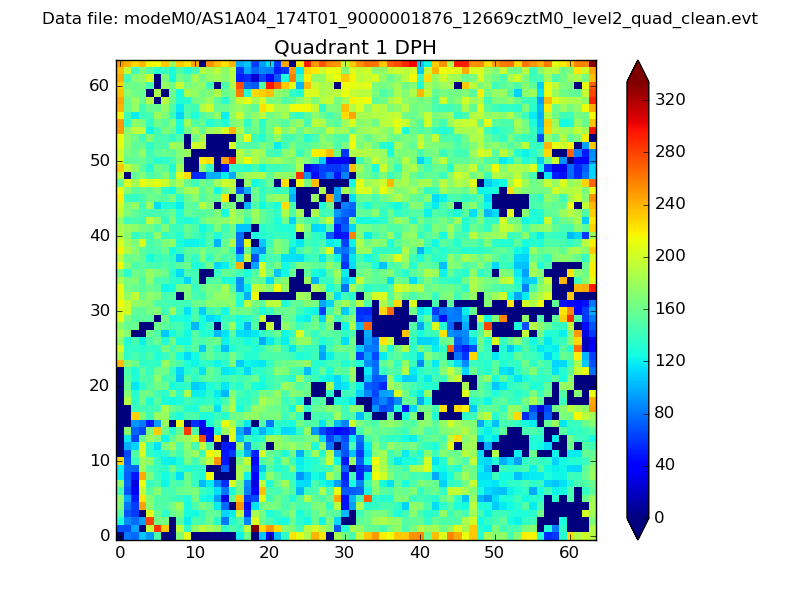 |
Quadrant B |
|---|---|---|---|
| Quadrant D | 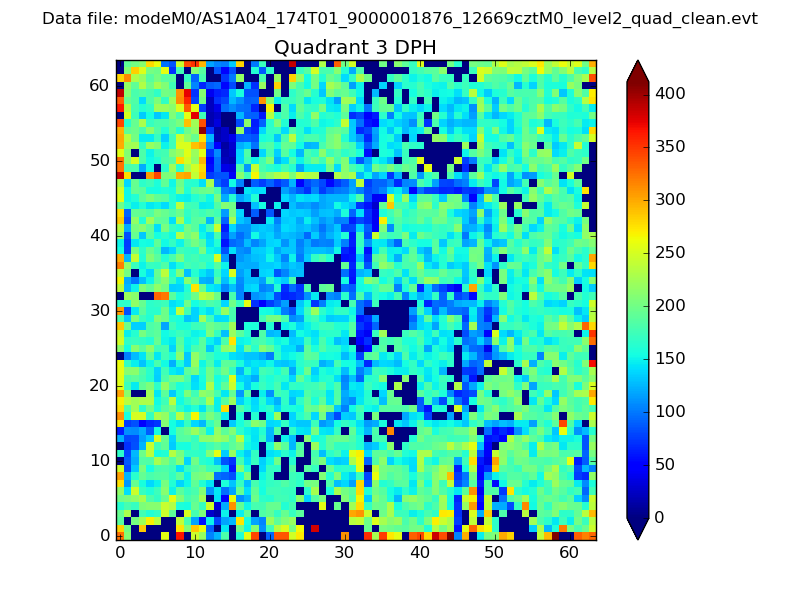 |
 |
Quadrant C |
| Plot type | Count rate plots | Images |
|---|---|---|
| Comparison with Poisson distribution Blue bars denote a histogram of data divided into 1 sec bins. Red curve is a Poisson curve with rate = median count rate of data. |
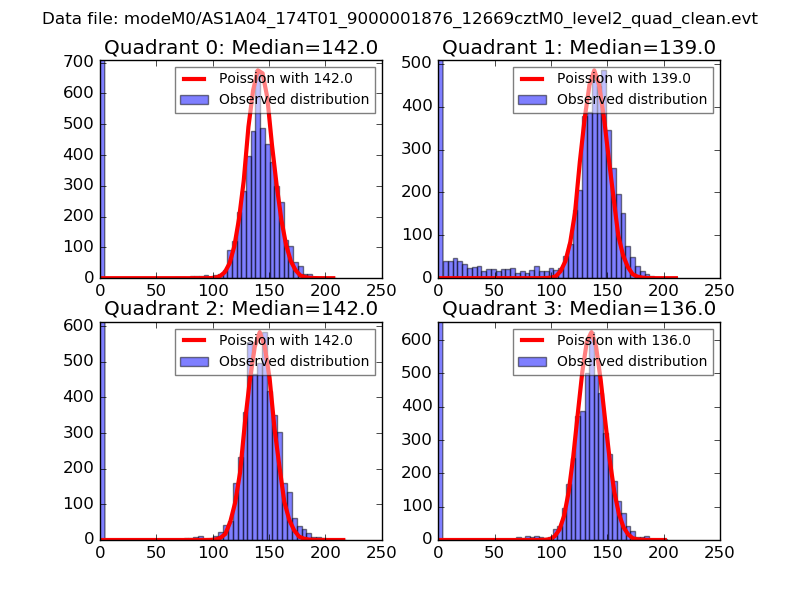 |
 |
| Quadrant-wise count rates Data is divided into 100 sec bins |
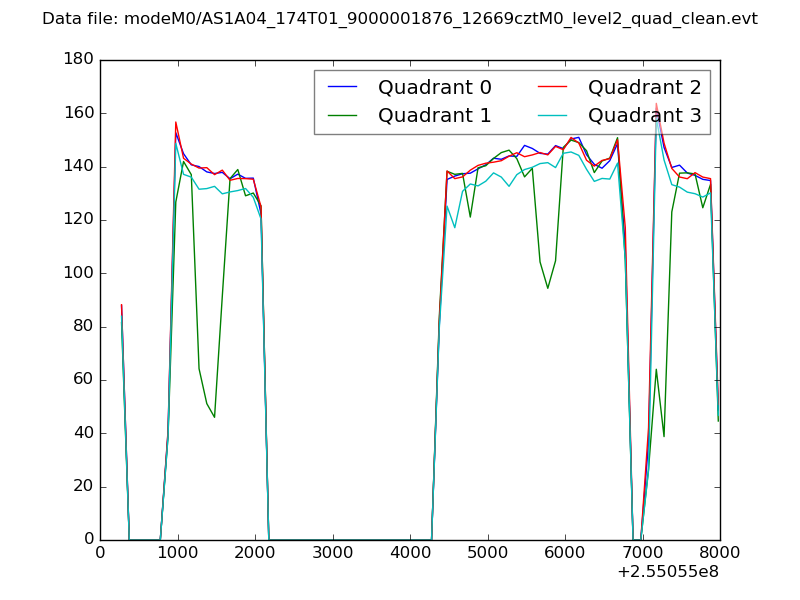 |
|
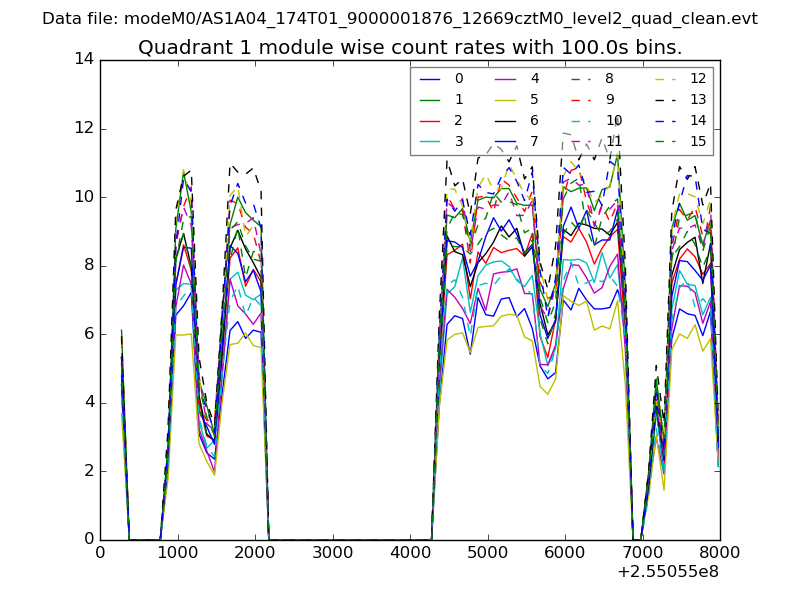
| Module-wise count rates for Quadrant A Data is divided into 100 sec bins |
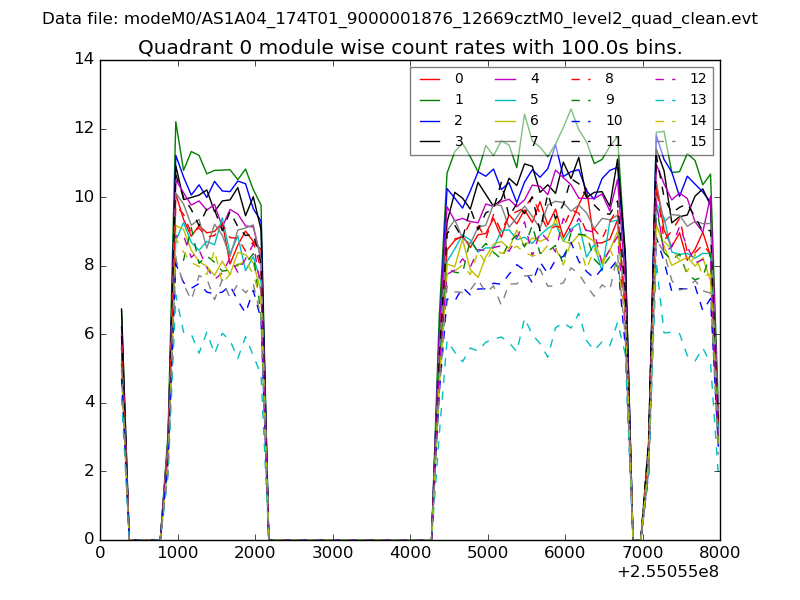 |
 |
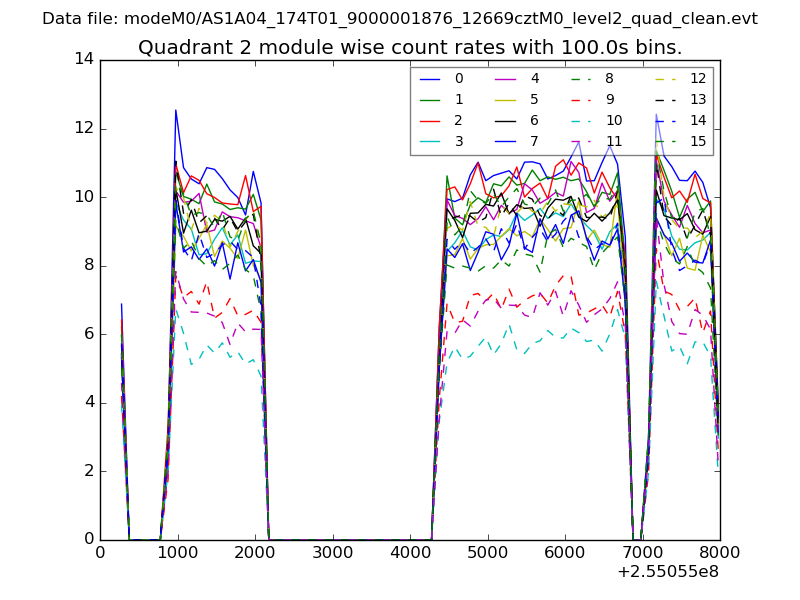
| Module-wise count rates for Quadrant B Data is divided into 100 sec bins |
 |
 |
| Module-wise count rates for Quadrant C Data is divided into 100 sec bins |
 |
 |
| Module-wise count rates for Quadrant D Data is divided into 100 sec bins |
 |
 |
| Parameter | Plot |
|---|---|
| CZT HV Monitor | 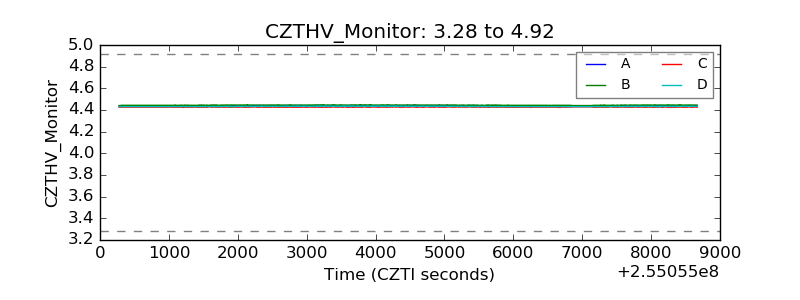 |
| D_VDD | 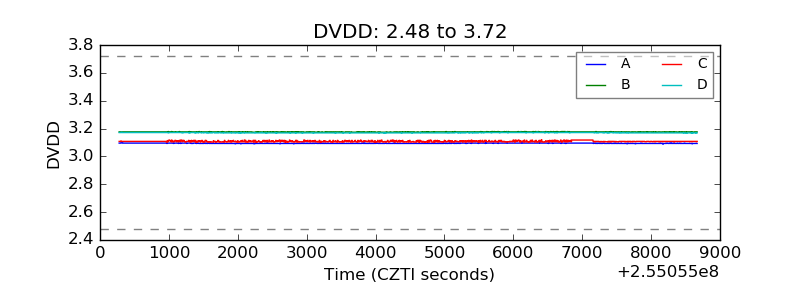 |
| Temperature 1 | 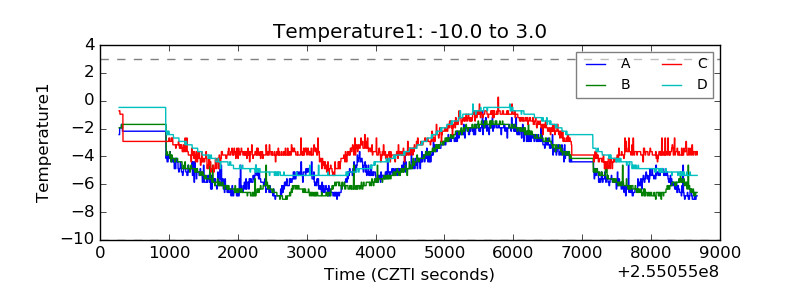 |
| Veto HV Monitor |  |
| Veto LLD | 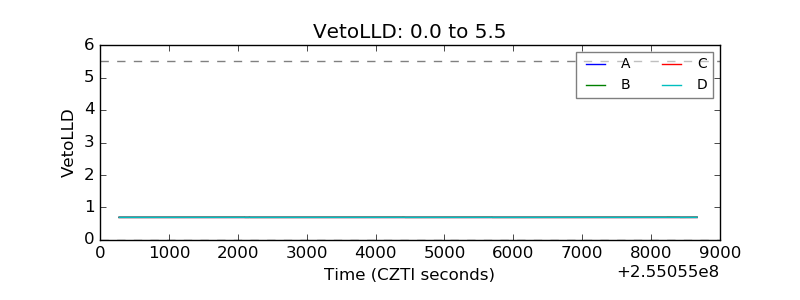 |
| Alpha Counter | 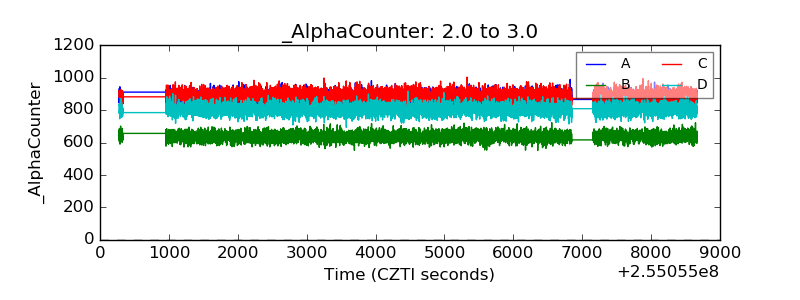 |
| _CPM_Rate | 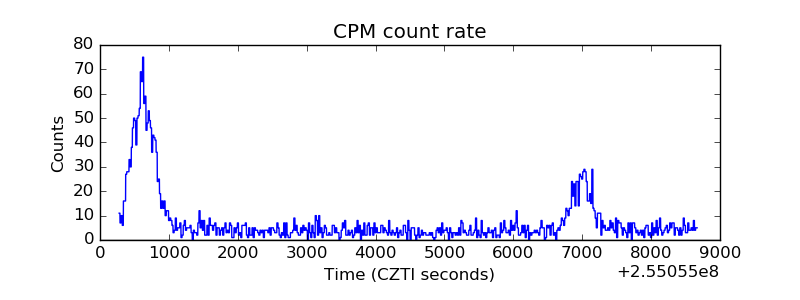 |
| CZT Counter | 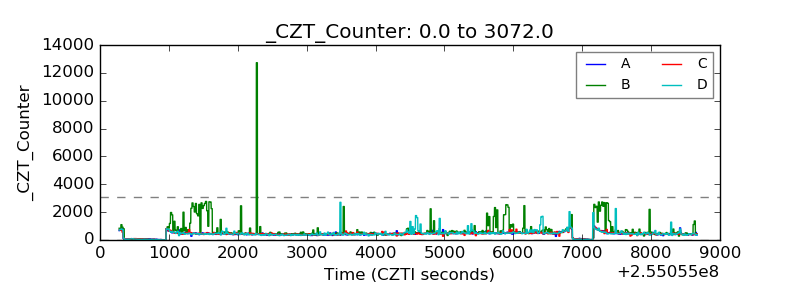 |
| +2.5 Volts monitor |  |
| +5 Volts monitor |  |
| _ROLL_ROT | 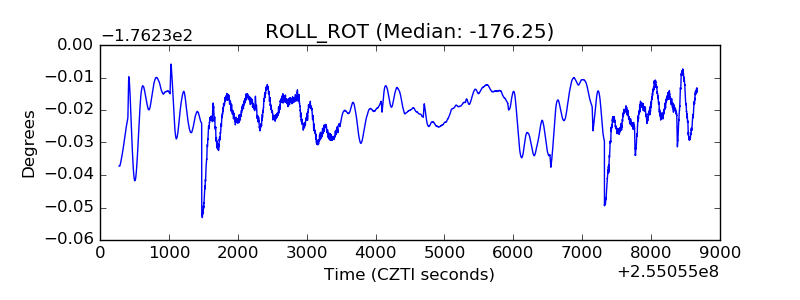 |
| _Roll_DEC |  |
| _Roll_RA | 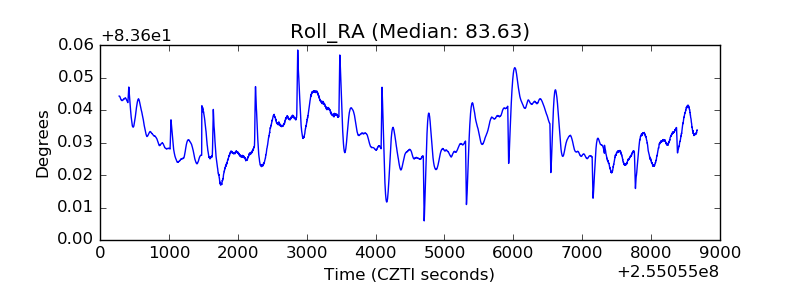 |
| Veto Counter | 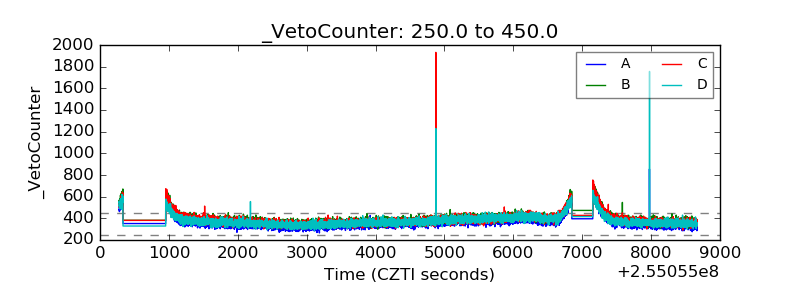 |