| Param | Original file | Final file |
|---|---|---|
| Filename | modeM0/AS1A04_174T01_9000001876_12670cztM0_level2.evt | modeM0/AS1A04_174T01_9000001876_12670cztM0_level2_quad_clean.evt |
| Size (bytes) | 525,530,880 | 85,423,680 |
| Size | 501.2 MB | 81.5 MB |
| Events in quadrant A | 3,427,026 | 535,633 |
| Events in quadrant B | 5,023,320 | 487,023 |
| Events in quadrant C | 3,358,871 | 537,543 |
| Events in quadrant D | 3,606,582 | 513,934 |
| Mode M9 | |||
|---|---|---|---|
| Quadrant | BADHDUFLAG | Total packets | Discarded packets |
| A | 0 | 3 | 0 |
| B | 0 | 3 | 0 |
| C | 0 | 3 | 0 |
| D | 0 | 3 | 0 |
| Mode M0 | |||
|---|---|---|---|
| Quadrant | BADHDUFLAG | Total packets | Discarded packets |
| A | 0 | 15153 | 2 |
| B | 0 | 19661 | 1 |
| C | 0 | 14998 | 1 |
| D | 0 | 15785 | 1 |
| Mode SS | |||
|---|---|---|---|
| Quadrant | BADHDUFLAG | Total packets | Discarded packets |
| A | 0 | 150 | 0 |
| B | 0 | 150 | 0 |
| C | 0 | 150 | 0 |
| D | 0 | 150 | 0 |
| Quadrant | Total seconds | Saturated seconds | Saturation percentage |
|---|---|---|---|
| A | 7359 | 45 | 0.611496% |
| B | 7359 | 617 | 8.384291% |
| C | 7359 | 26 | 0.353309% |
| D | 7359 | 34 | 0.462019% |
Noise dominated data is calculated using 1-second bins in cleaned event files. If a bin has >2000 counts, and if more than 50% of those come from <1% of pixels, then it is considered to be noise-dominated and hence unusable.
| Quadrant | # 1 sec bins | Bins with >0 counts | Bins with >2000 counts | High rate bins dominated by noise | Noise dominated (total time) | Noise dominated (detector-on time) | Marked lightcurve |
|---|---|---|---|---|---|---|---|
| A | 7710 | 7361 | 0 | 0 | 0.00% | 0.00% | 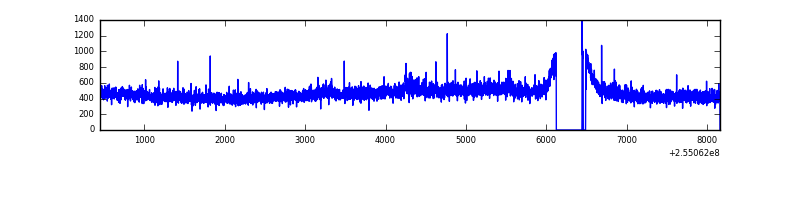 |
| B | 7709 | 7359 | 440 | 440 | 5.71% | 5.98% | 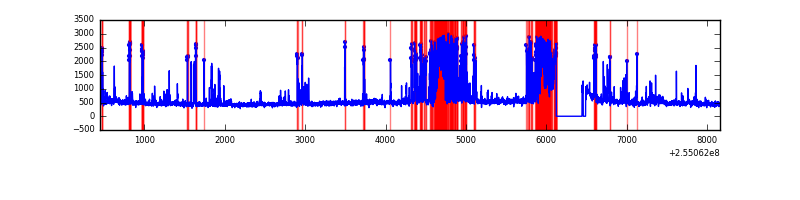 |
| C | 7710 | 7362 | 0 | 0 | 0.00% | 0.00% |  |
| D | 7710 | 7361 | 14 | 14 | 0.18% | 0.19% | 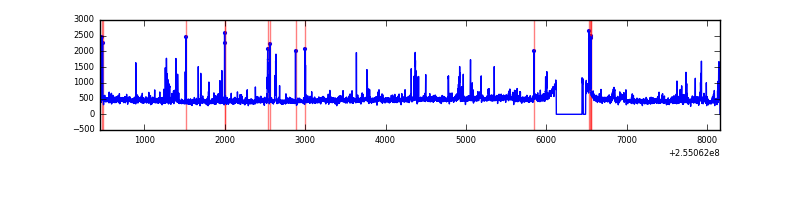 |
Top three noisy pixels from each quadrant. If the there are fewer than three noisy pixels in the level2.evt file, extra rows are filled as -1
| Pixel properties | Quadrant properties | ||||||
|---|---|---|---|---|---|---|---|
| Quadrant | DetID | PixID | Counts | Sigma | Mean | Median | Sigma |
| A | 12 | 189 | 71117 | 392.8 | 872 | 855 | 178.9 |
| A | 0 | 226 | 7560 | 37.48 | 872 | 855 | 178.9 |
| A | 12 | 194 | 6660 | 32.45 | 872 | 855 | 178.9 |
| B | 4 | 239 | 1436218 | 8880.57 | 834 | 813 | 161.6 |
| B | 3 | 64 | 116799 | 717.58 | 834 | 813 | 161.6 |
| B | 11 | 51 | 91190 | 559.14 | 834 | 813 | 161.6 |
| C | 15 | 208 | 18256 | 87.42 | 856 | 863 | 199.0 |
| C | 13 | 61 | 6353 | 27.59 | 856 | 863 | 199.0 |
| C | 14 | 234 | 3623 | 13.87 | 856 | 863 | 199.0 |
| D | 1 | 52 | 122632 | 602.77 | 841 | 823 | 202.1 |
| D | 10 | 199 | 84995 | 416.52 | 841 | 823 | 202.1 |
| D | 10 | 157 | 84278 | 412.97 | 841 | 823 | 202.1 |
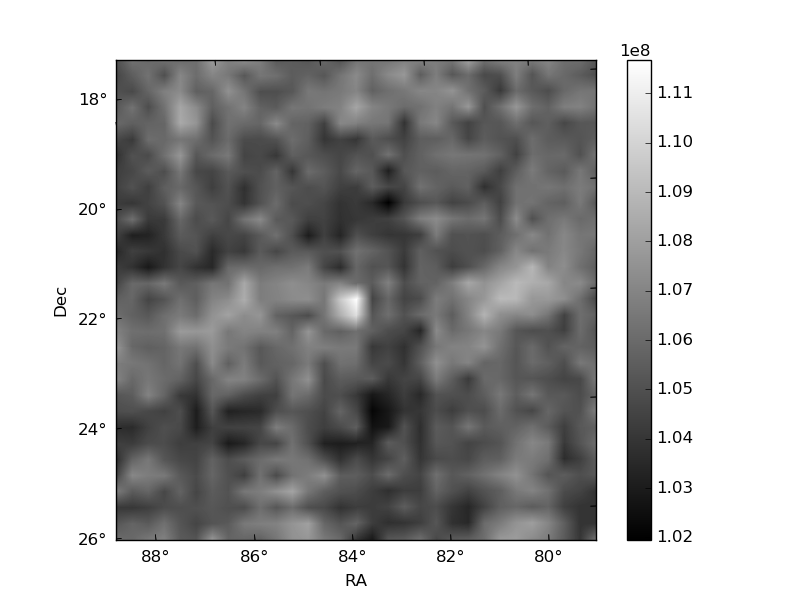
Histogram calculated using DETX and DETY for each event in the final _common_clean file
| Quadrant A | 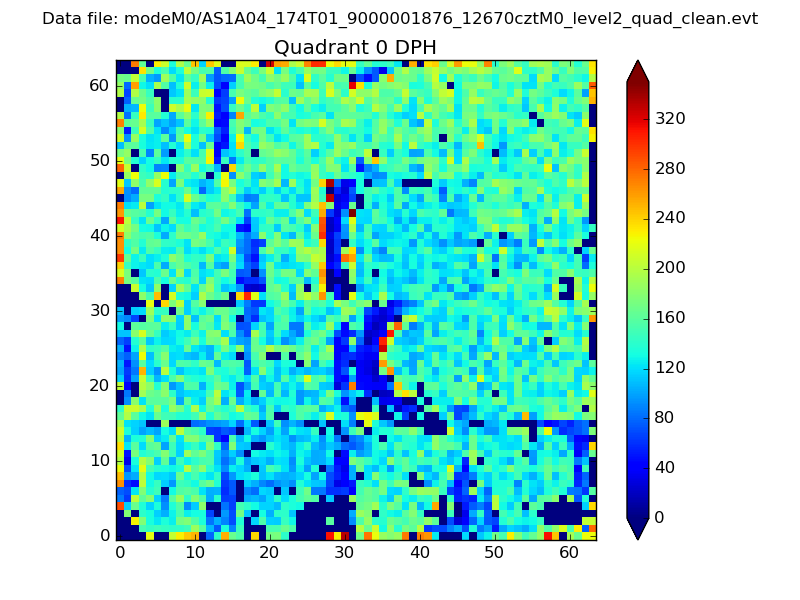 |
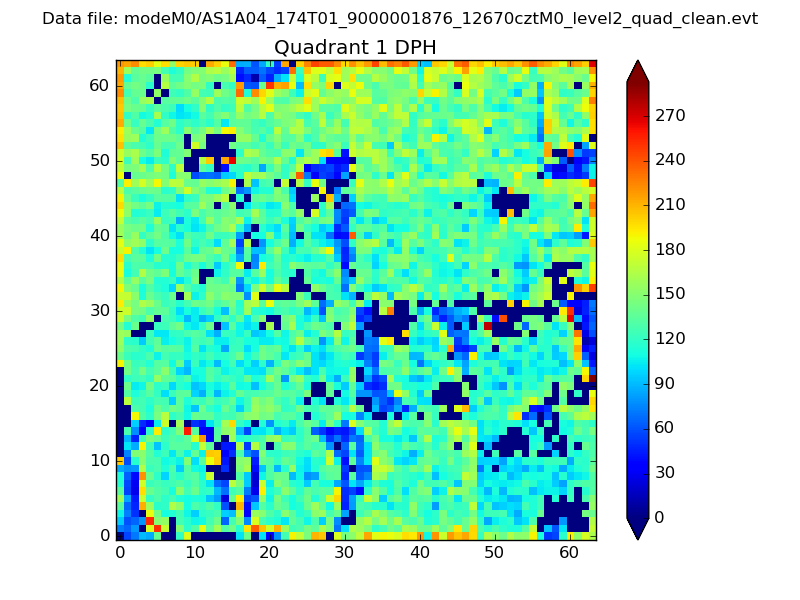 |
Quadrant B |
|---|---|---|---|
| Quadrant D |  |
 |
Quadrant C |
| Plot type | Count rate plots | Images |
|---|---|---|
| Comparison with Poisson distribution Blue bars denote a histogram of data divided into 1 sec bins. Red curve is a Poisson curve with rate = median count rate of data. |
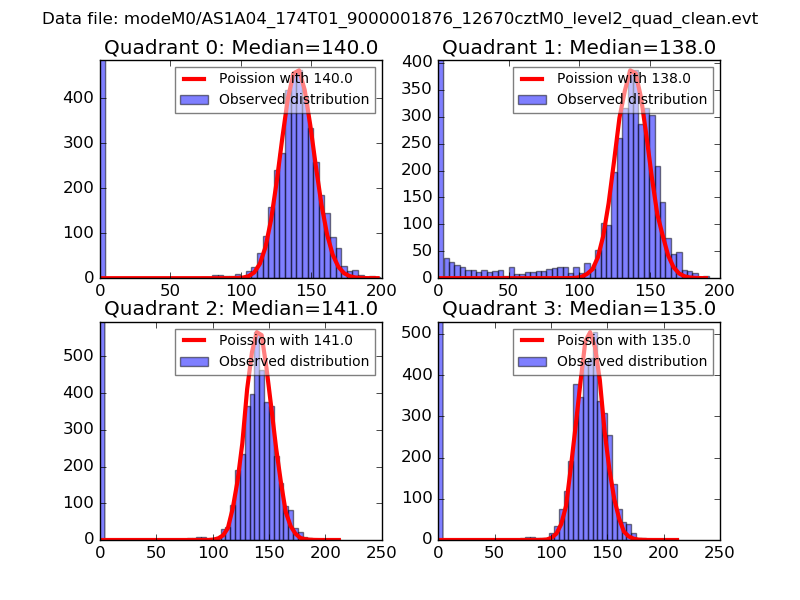 |
 |
| Quadrant-wise count rates Data is divided into 100 sec bins |
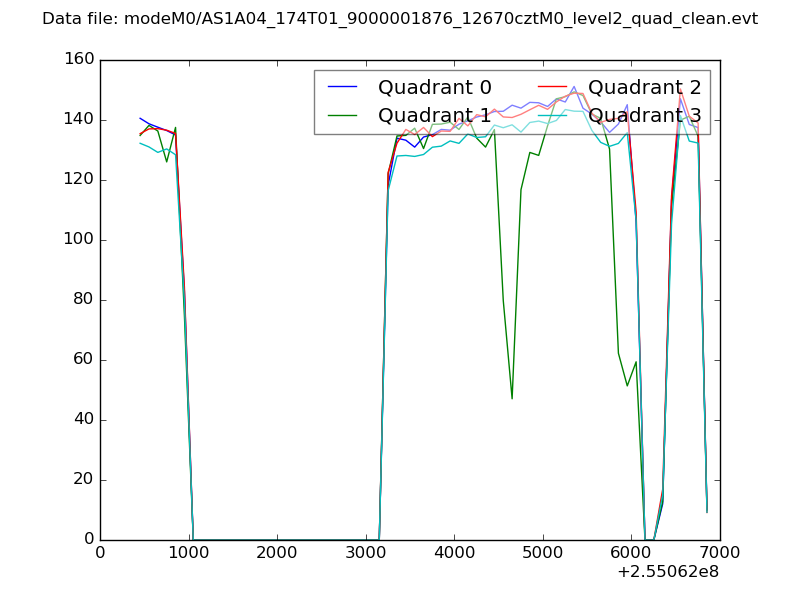 |
|
| Module-wise count rates for Quadrant A Data is divided into 100 sec bins |
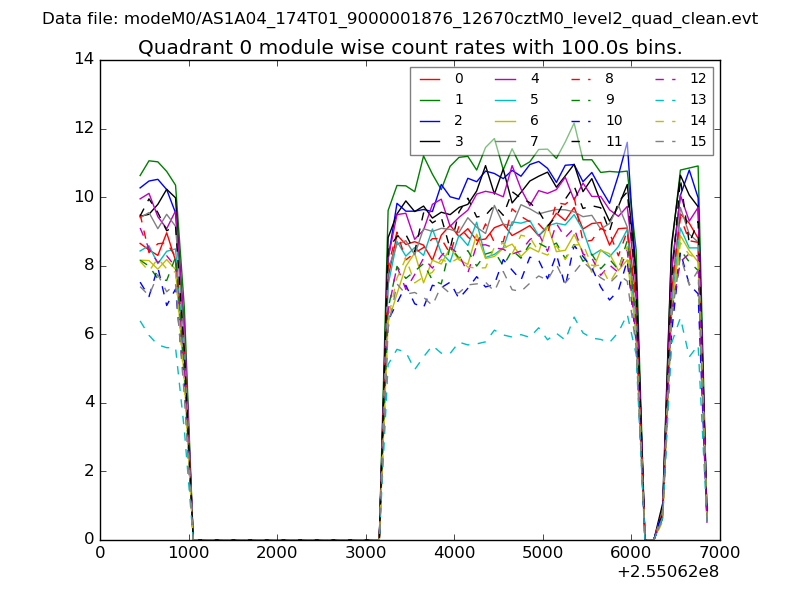 |
 |
| Module-wise count rates for Quadrant B Data is divided into 100 sec bins |
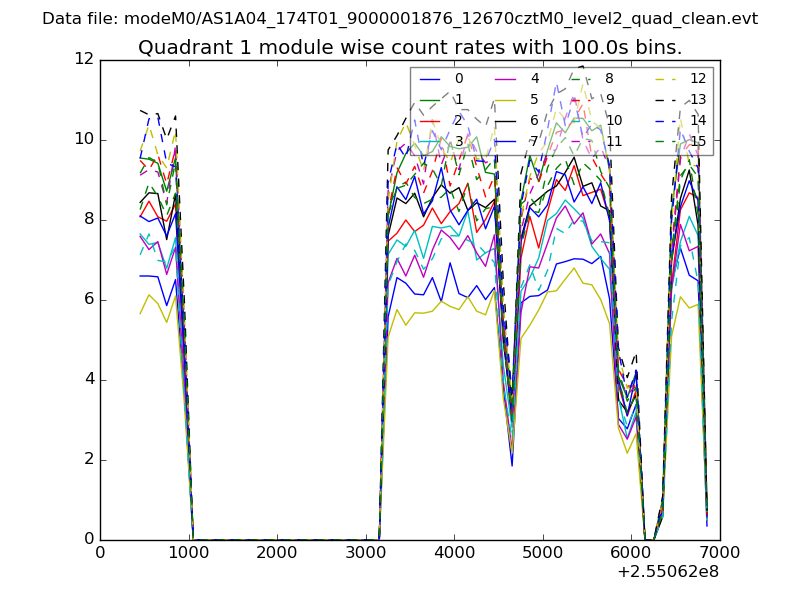 |
 |
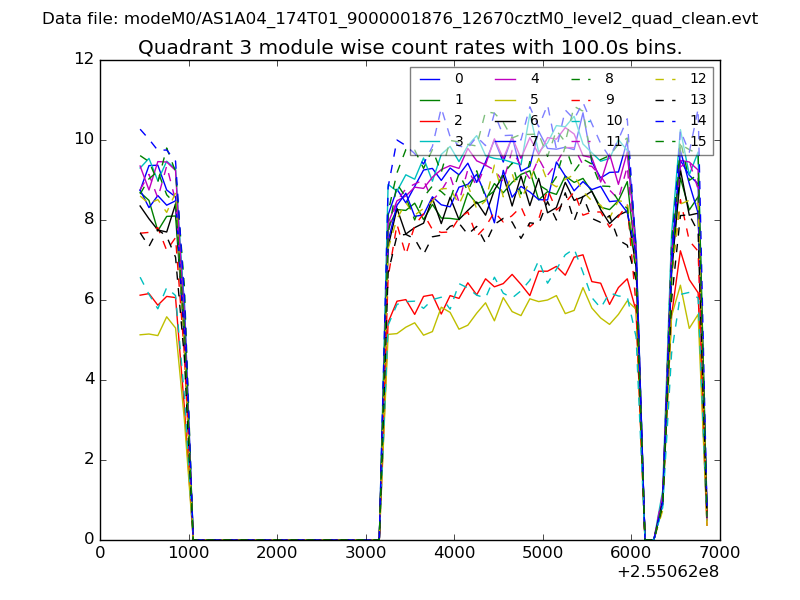
| Module-wise count rates for Quadrant C Data is divided into 100 sec bins |
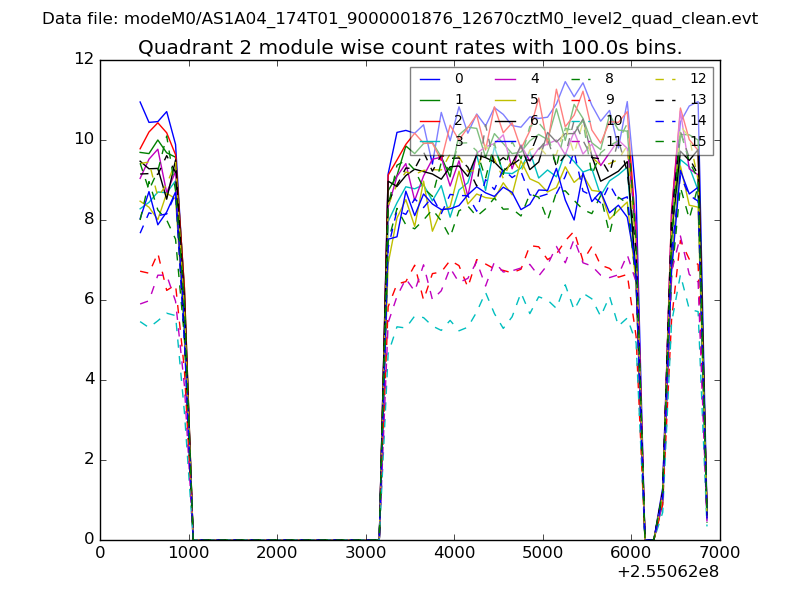 |
 |
| Module-wise count rates for Quadrant D Data is divided into 100 sec bins |
 |
 |
| Parameter | Plot |
|---|---|
| CZT HV Monitor | 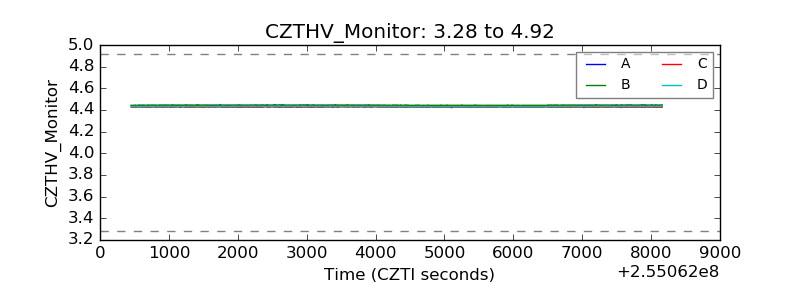 |
| D_VDD | 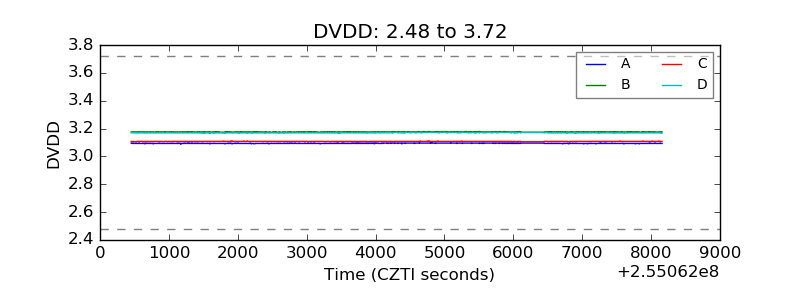 |
| Temperature 1 | 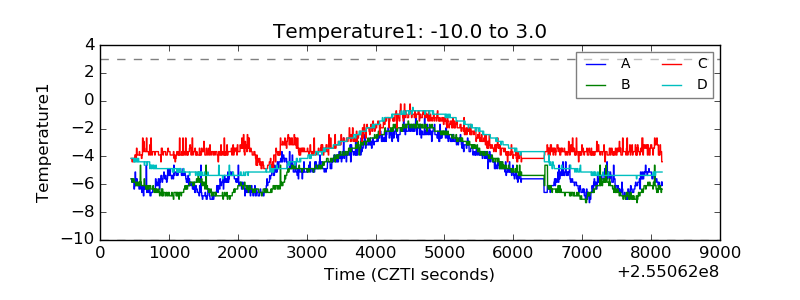 |
| Veto HV Monitor | 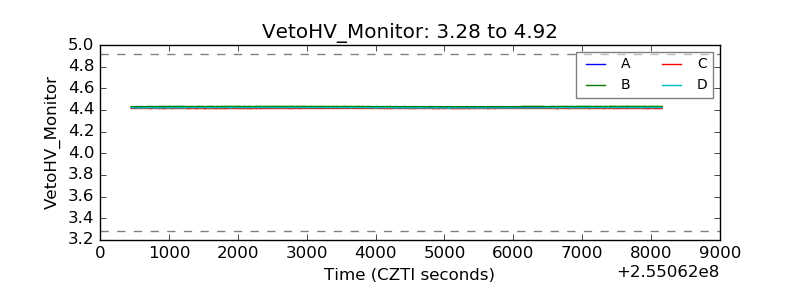 |
| Veto LLD | 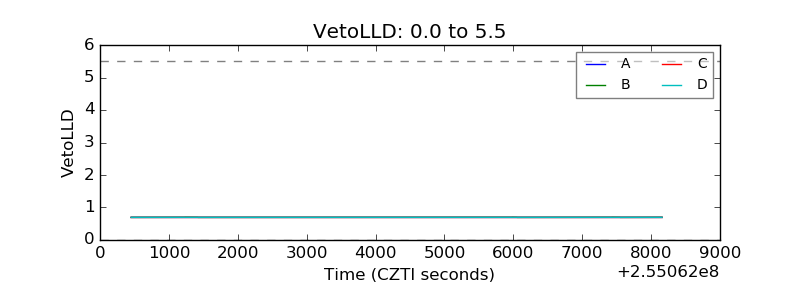 |
| Alpha Counter | 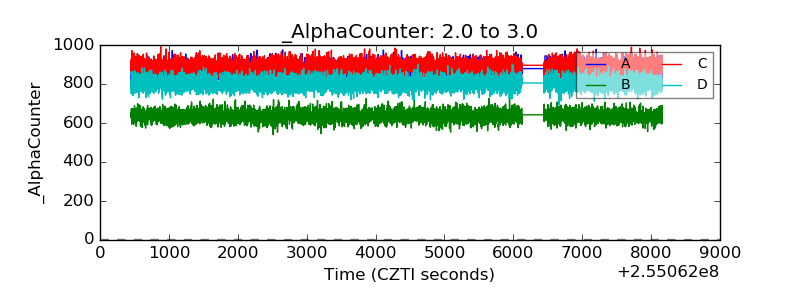 |
| _CPM_Rate | 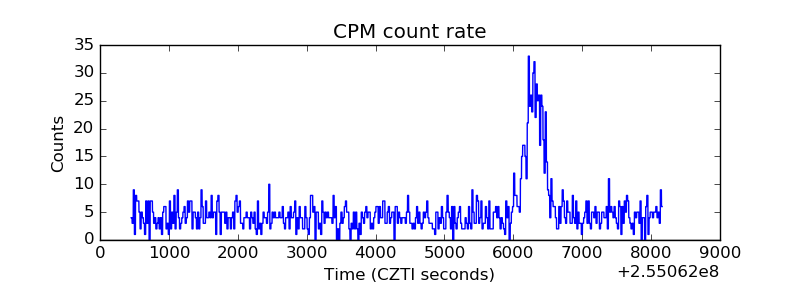 |
| CZT Counter |  |
| +2.5 Volts monitor |  |
| +5 Volts monitor |  |
| _ROLL_ROT | 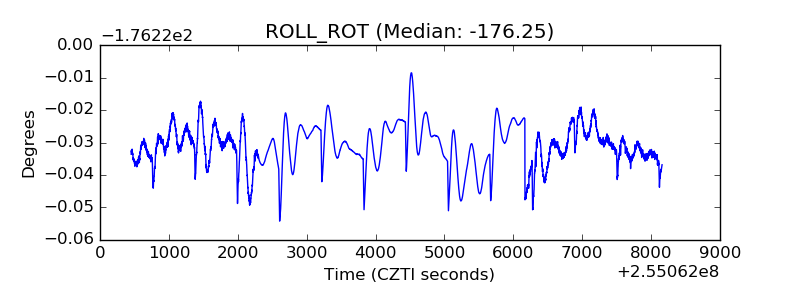 |
| _Roll_DEC | 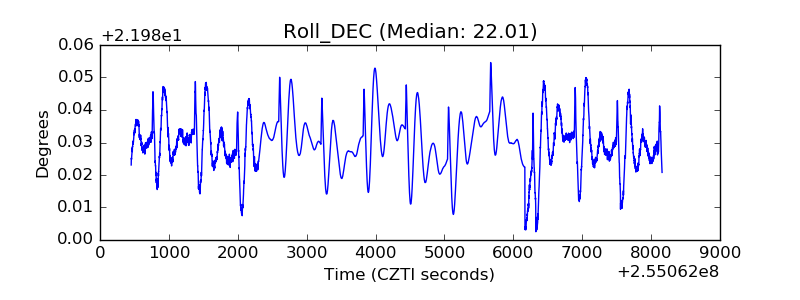 |
| _Roll_RA | 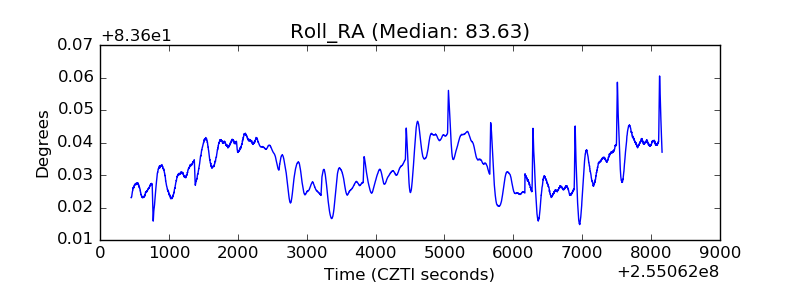 |
| Veto Counter | 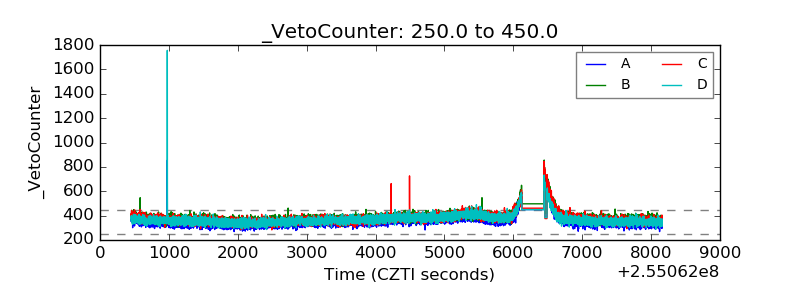 |