| Param | Original file | Final file |
|---|---|---|
| Filename | modeM0/AS1A04_174T01_9000001876_12673cztM0_level2.evt | modeM0/AS1A04_174T01_9000001876_12673cztM0_level2_quad_clean.evt |
| Size (bytes) | 1,513,442,880 | 242,110,080 |
| Size | 1.4 GB | 230.9 MB |
| Events in quadrant A | 9,054,139 | 1,584,195 |
| Events in quadrant B | 16,245,896 | 1,325,191 |
| Events in quadrant C | 9,048,784 | 1,591,709 |
| Events in quadrant D | 10,195,707 | 1,514,612 |
| Mode M9 | |||
|---|---|---|---|
| Quadrant | BADHDUFLAG | Total packets | Discarded packets |
| A | 0 | 20 | 0 |
| B | 0 | 20 | 0 |
| C | 0 | 20 | 0 |
| D | 0 | 20 | 0 |
| Mode M0 | |||
|---|---|---|---|
| Quadrant | BADHDUFLAG | Total packets | Discarded packets |
| A | 0 | 39194 | 5 |
| B | 0 | 60361 | 4 |
| C | 0 | 39560 | 4 |
| D | 0 | 43149 | 4 |
| Mode SS | |||
|---|---|---|---|
| Quadrant | BADHDUFLAG | Total packets | Discarded packets |
| A | 0 | 392 | 0 |
| B | 0 | 392 | 0 |
| C | 0 | 392 | 0 |
| D | 0 | 392 | 0 |
| Quadrant | Total seconds | Saturated seconds | Saturation percentage |
|---|---|---|---|
| A | 19094 | 269 | 1.408820% |
| B | 19094 | 3072 | 16.088824% |
| C | 19094 | 217 | 1.136483% |
| D | 19094 | 321 | 1.681156% |
Noise dominated data is calculated using 1-second bins in cleaned event files. If a bin has >2000 counts, and if more than 50% of those come from <1% of pixels, then it is considered to be noise-dominated and hence unusable.
| Quadrant | # 1 sec bins | Bins with >0 counts | Bins with >2000 counts | High rate bins dominated by noise | Noise dominated (total time) | Noise dominated (detector-on time) | Marked lightcurve |
|---|---|---|---|---|---|---|---|
| A | 21230 | 19096 | 3 | 3 | 0.01% | 0.02% | 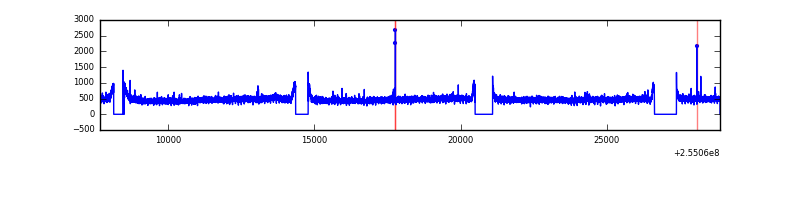 |
| B | 21230 | 19095 | 2458 | 2458 | 11.58% | 12.87% | 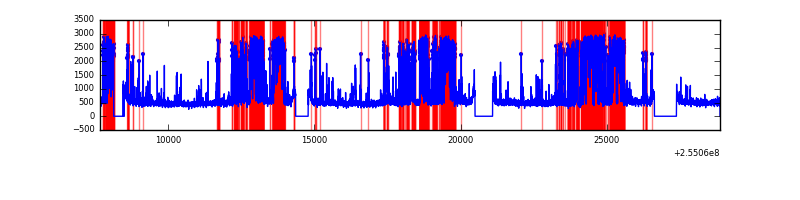 |
| C | 21230 | 19097 | 28 | 28 | 0.13% | 0.15% |  |
| D | 21230 | 19096 | 142 | 142 | 0.67% | 0.74% | 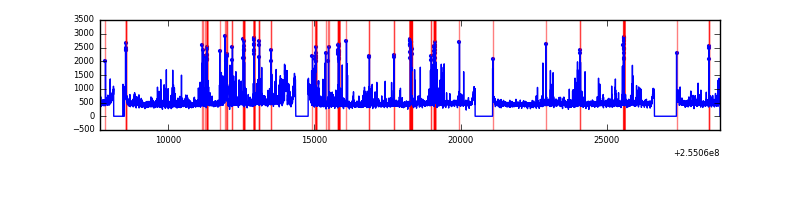 |
Top three noisy pixels from each quadrant. If the there are fewer than three noisy pixels in the level2.evt file, extra rows are filled as -1
| Pixel properties | Quadrant properties | ||||||
|---|---|---|---|---|---|---|---|
| Quadrant | DetID | PixID | Counts | Sigma | Mean | Median | Sigma |
| A | 12 | 189 | 87311 | 178.22 | 2328 | 2276 | 477.1 |
| A | 0 | 226 | 20313 | 37.8 | 2328 | 2276 | 477.1 |
| A | 12 | 194 | 17858 | 32.66 | 2328 | 2276 | 477.1 |
| B | 4 | 239 | 7037394 | 17172.27 | 2125 | 2070 | 409.7 |
| B | 3 | 64 | 359419 | 872.24 | 2125 | 2070 | 409.7 |
| B | 3 | 209 | 229766 | 555.77 | 2125 | 2070 | 409.7 |
| C | 15 | 208 | 179195 | 336.67 | 2272 | 2295 | 525.4 |
| C | 13 | 61 | 16763 | 27.53 | 2272 | 2295 | 525.4 |
| C | 14 | 234 | 11898 | 18.28 | 2272 | 2295 | 525.4 |
| D | 1 | 52 | 875116 | 1637.86 | 2241 | 2195 | 533.0 |
| D | 10 | 199 | 191444 | 355.09 | 2241 | 2195 | 533.0 |
| D | 13 | 249 | 189991 | 352.36 | 2241 | 2195 | 533.0 |
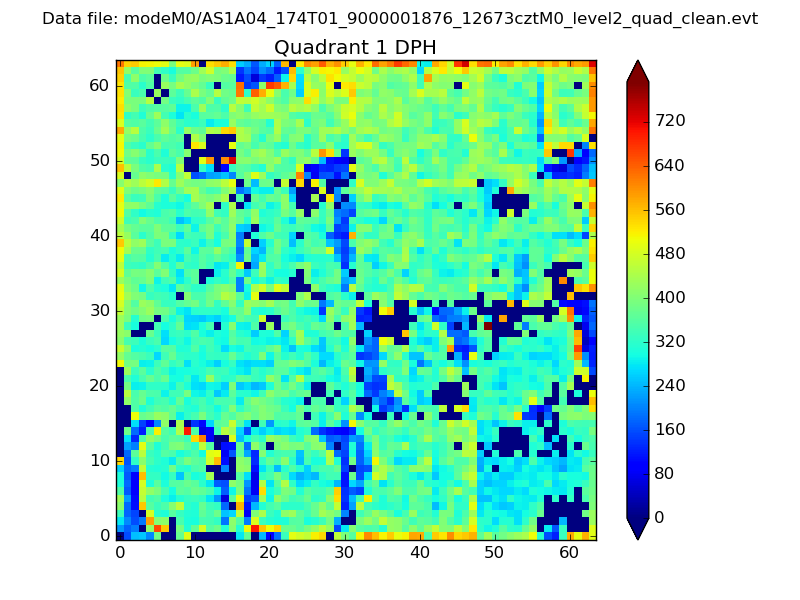
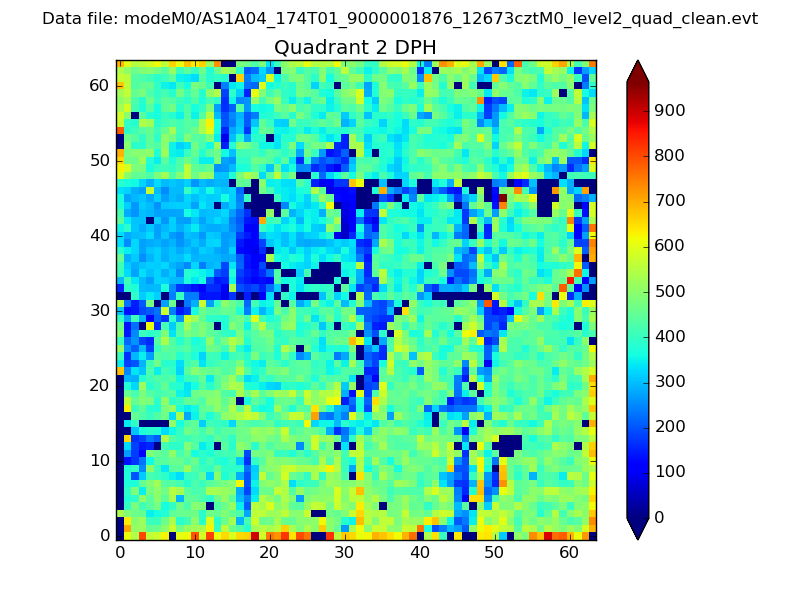
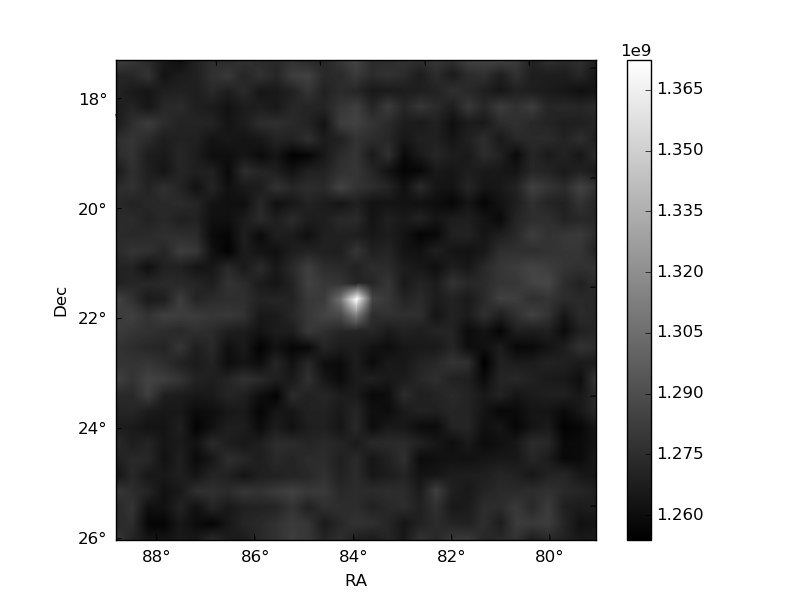
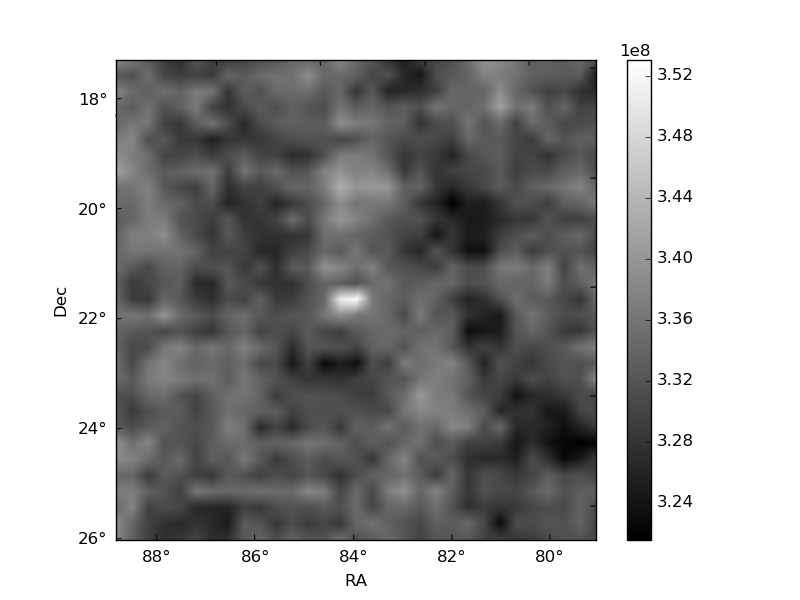
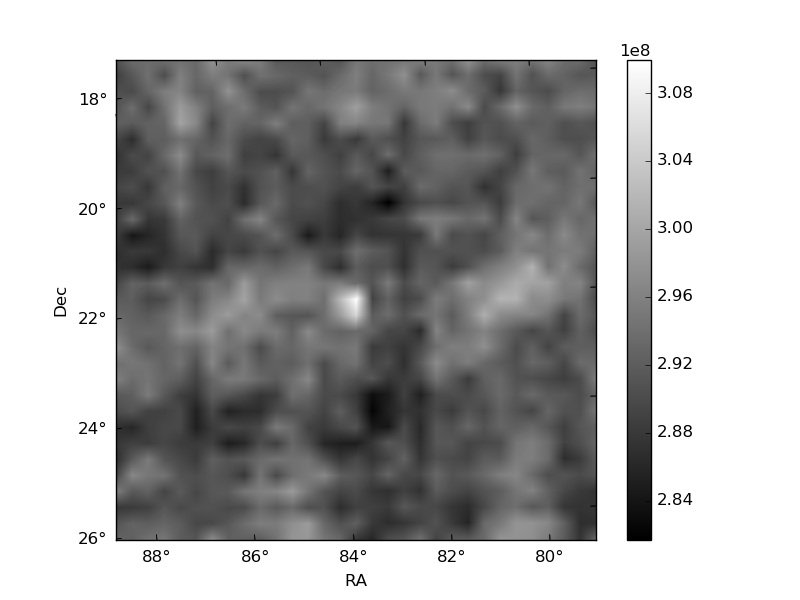
Histogram calculated using DETX and DETY for each event in the final _common_clean file
| Quadrant A | 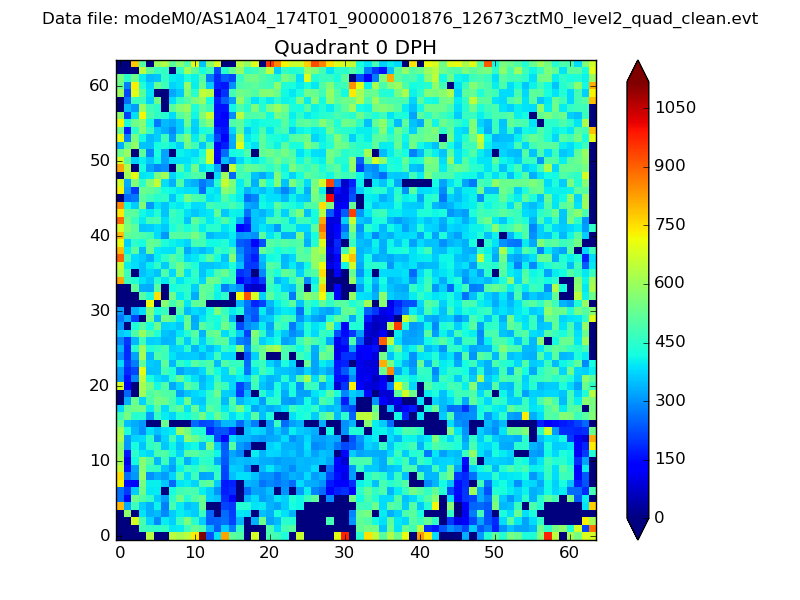 |
 |
Quadrant B |
|---|---|---|---|
| Quadrant D | 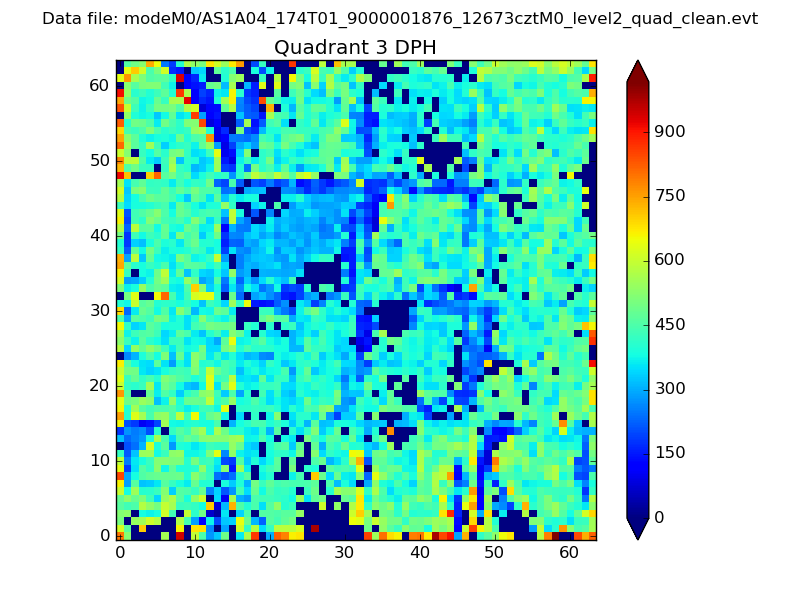 |
 |
Quadrant C |
| Plot type | Count rate plots | Images |
|---|---|---|
| Comparison with Poisson distribution Blue bars denote a histogram of data divided into 1 sec bins. Red curve is a Poisson curve with rate = median count rate of data. |
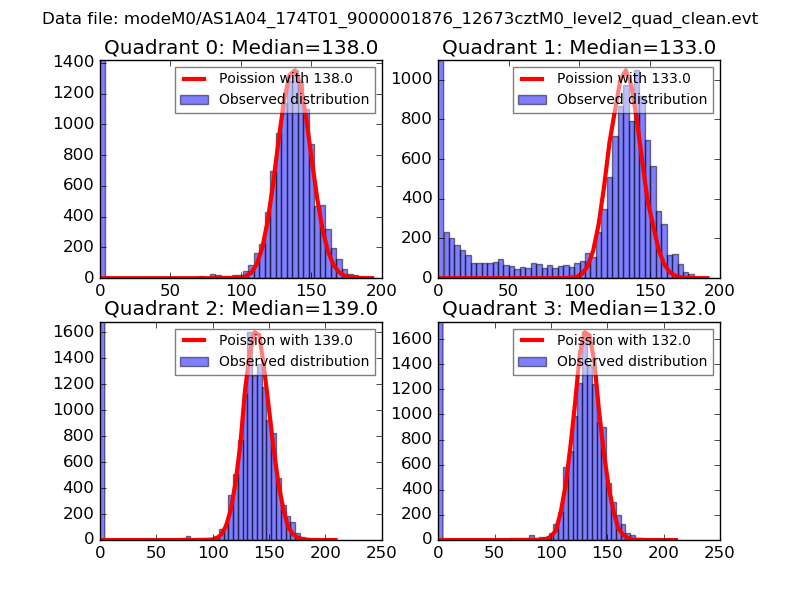 |
 |
| Quadrant-wise count rates Data is divided into 100 sec bins |
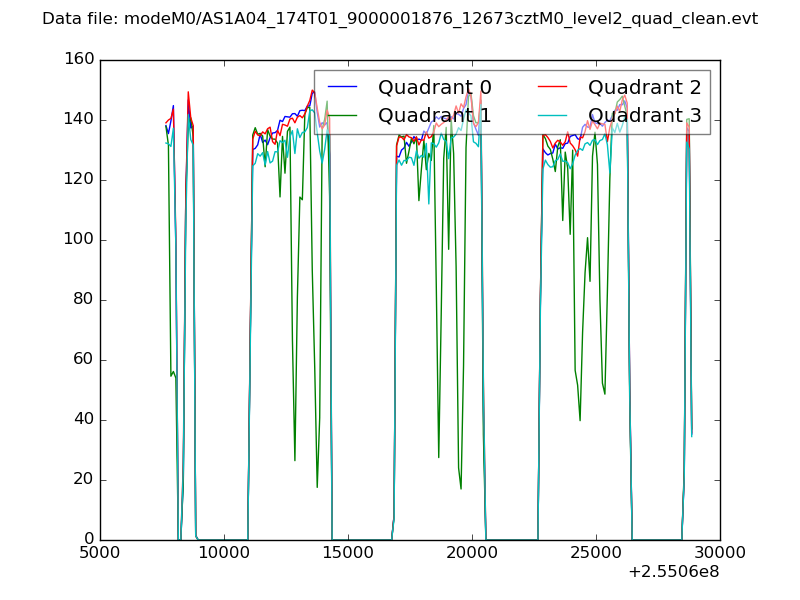 |
|
| Module-wise count rates for Quadrant A Data is divided into 100 sec bins |
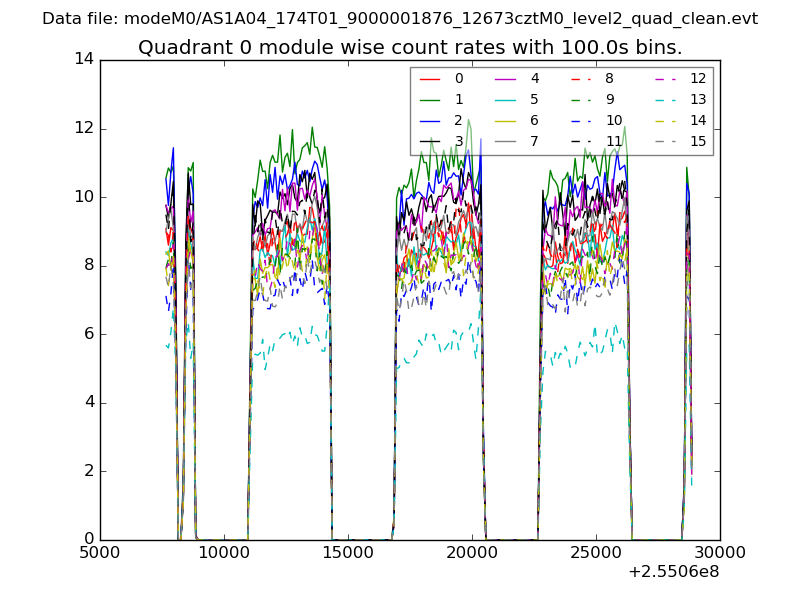 |
 |
| Module-wise count rates for Quadrant B Data is divided into 100 sec bins |
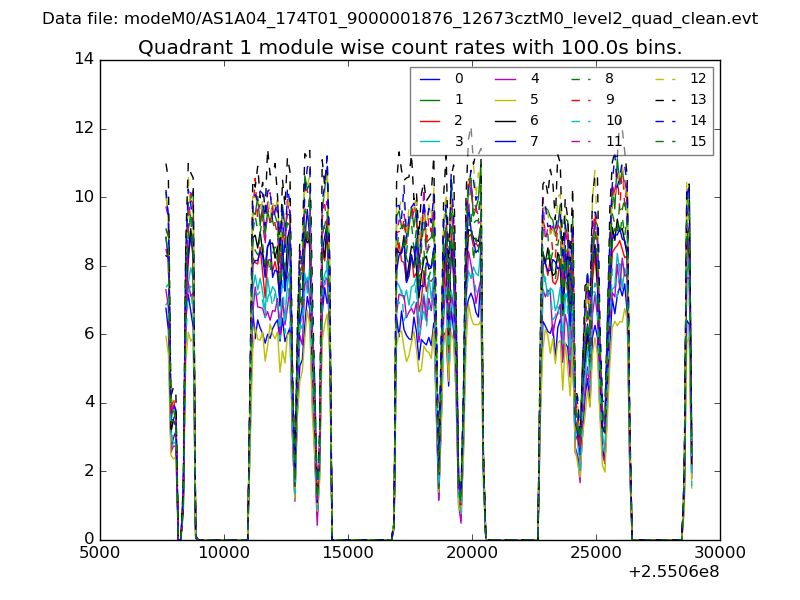 |
 |
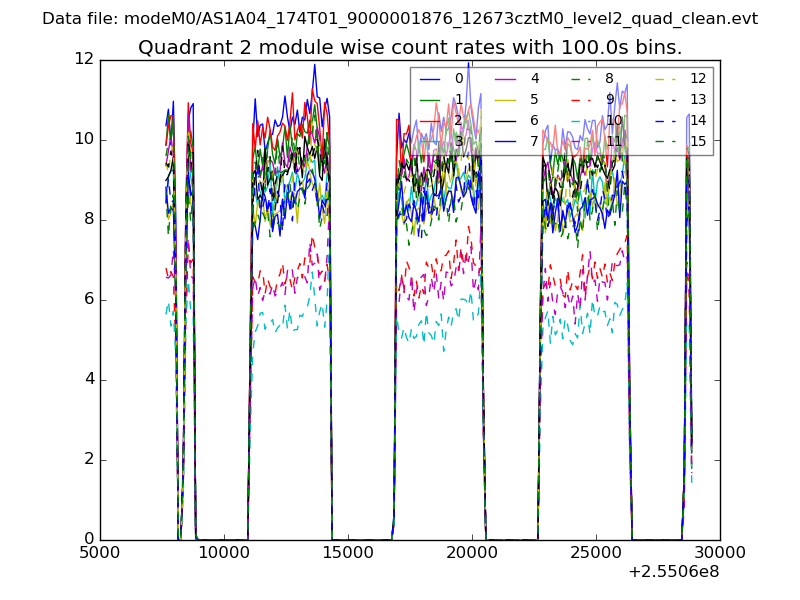
| Module-wise count rates for Quadrant C Data is divided into 100 sec bins |
 |
 |
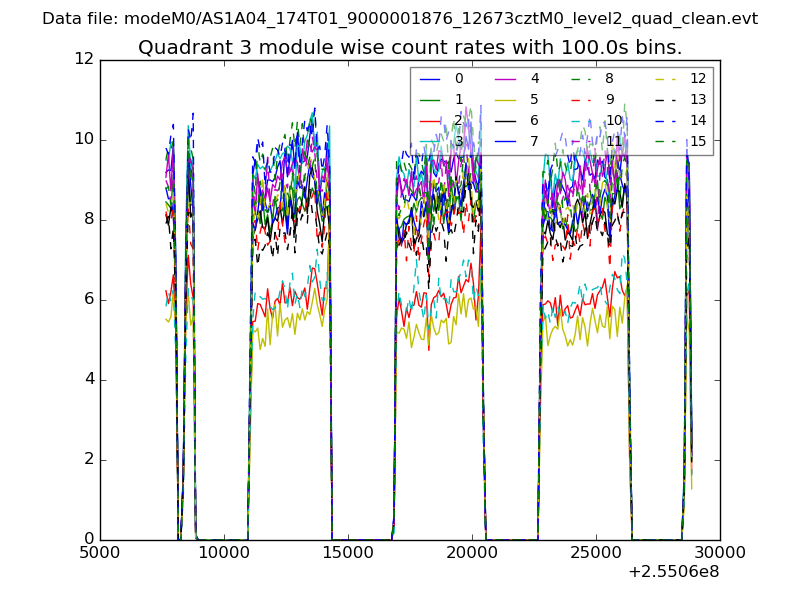
| Module-wise count rates for Quadrant D Data is divided into 100 sec bins |
 |
 |
| Parameter | Plot |
|---|---|
| CZT HV Monitor | 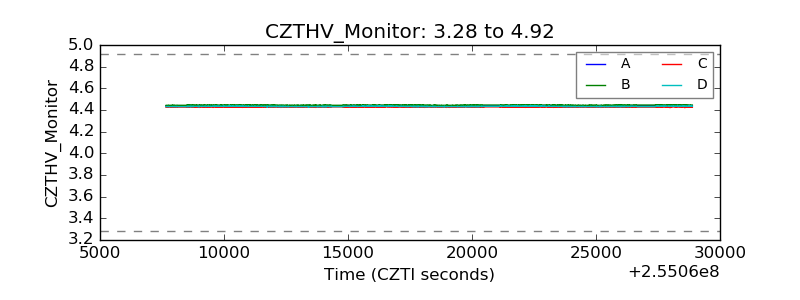 |
| D_VDD | 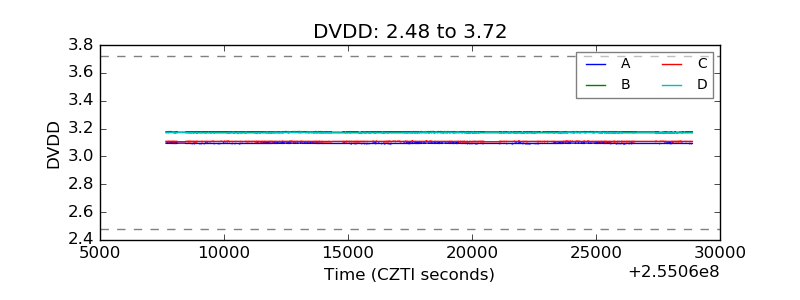 |
| Temperature 1 | 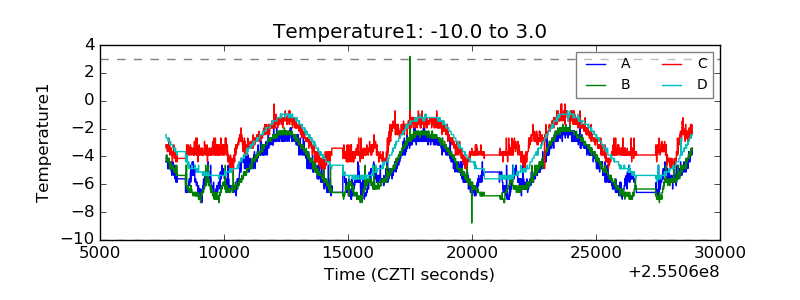 |
| Veto HV Monitor | 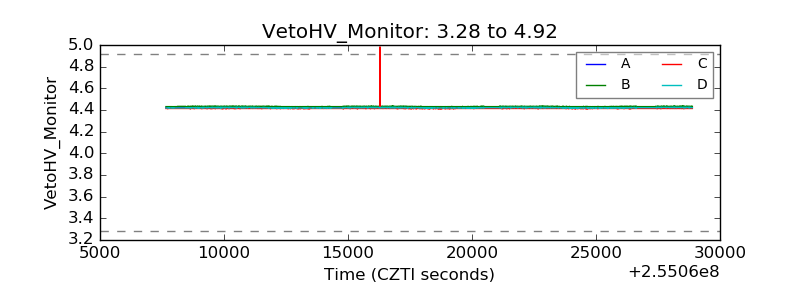 |
| Veto LLD | 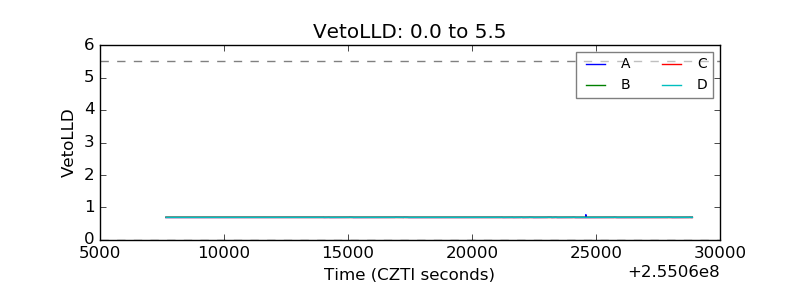 |
| Alpha Counter | 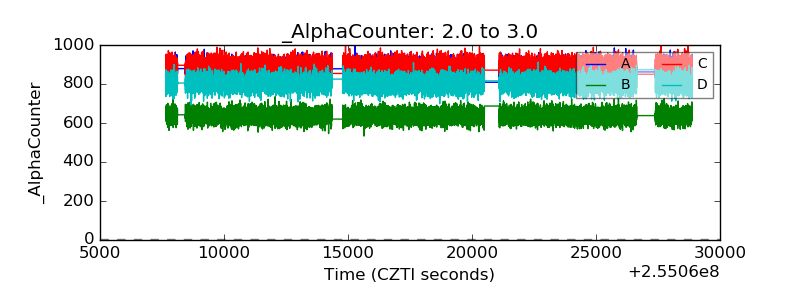 |
| _CPM_Rate | 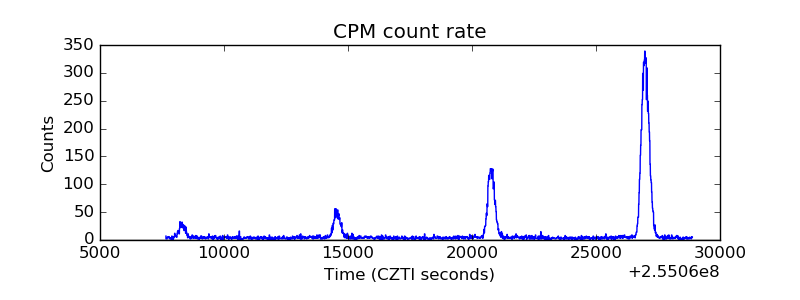 |
| CZT Counter | 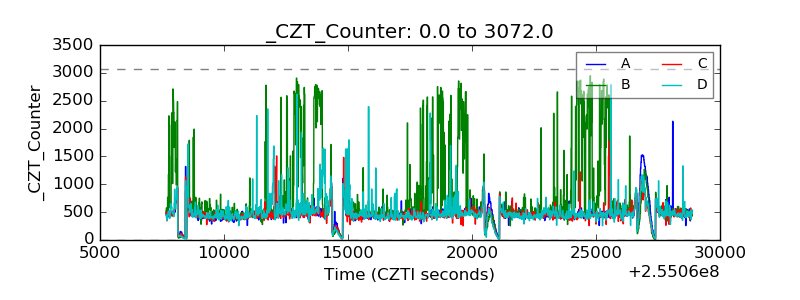 |
| +2.5 Volts monitor | 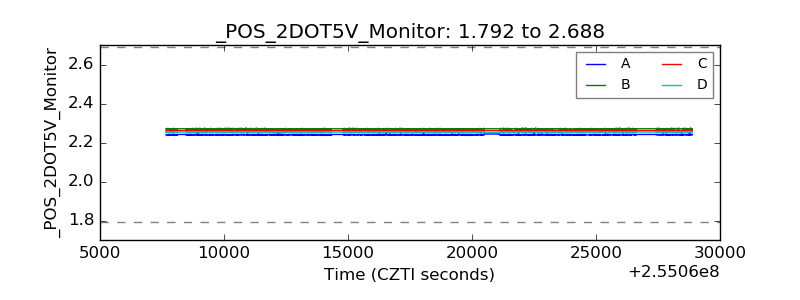 |
| +5 Volts monitor |  |
| _ROLL_ROT | 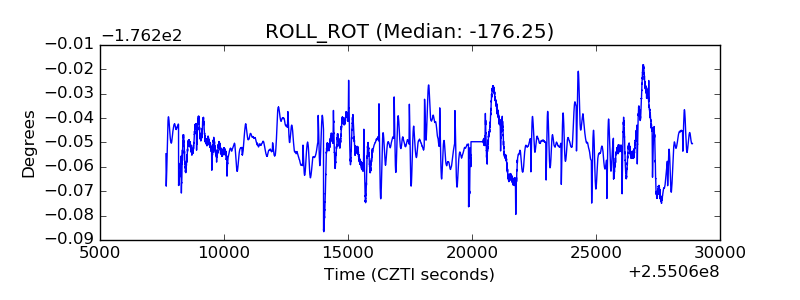 |
| _Roll_DEC | 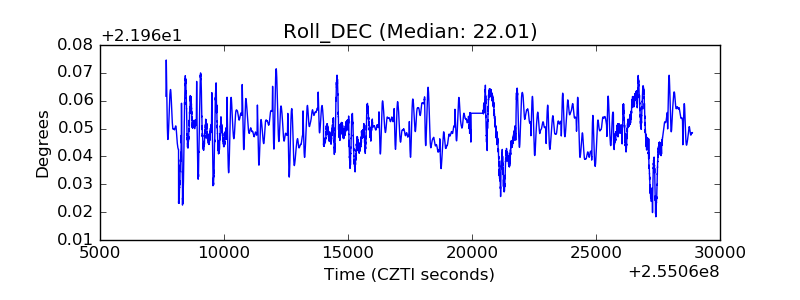 |
| _Roll_RA | 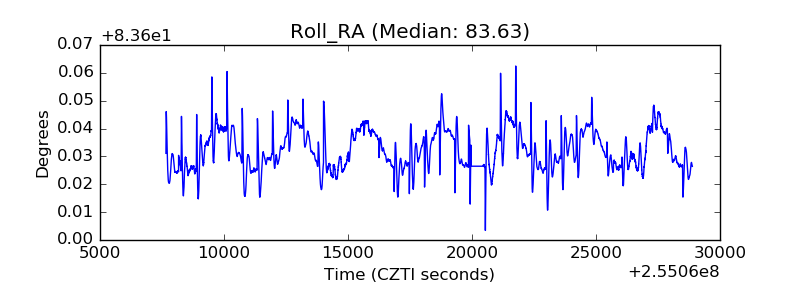 |
| Veto Counter | 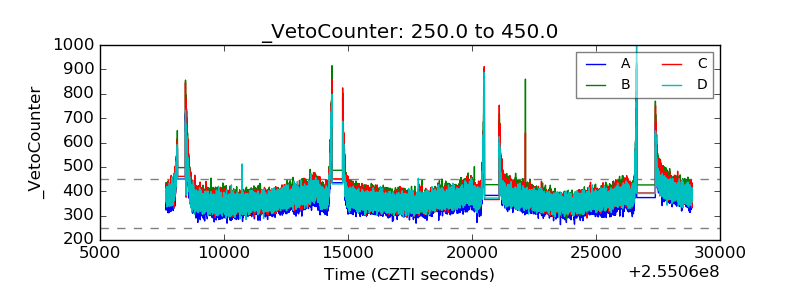 |