| Param | Original file | Final file |
|---|---|---|
| Filename | modeM0/AS1A04_174T01_9000001876_12674cztM0_level2.evt | modeM0/AS1A04_174T01_9000001876_12674cztM0_level2_quad_clean.evt |
| Size (bytes) | 531,290,880 | 89,256,960 |
| Size | 506.7 MB | 85.1 MB |
| Events in quadrant A | 3,424,913 | 578,353 |
| Events in quadrant B | 5,444,598 | 512,370 |
| Events in quadrant C | 3,291,258 | 577,513 |
| Events in quadrant D | 3,462,803 | 555,689 |
| Mode M9 | |||
|---|---|---|---|
| Quadrant | BADHDUFLAG | Total packets | Discarded packets |
| A | 0 | 16 | 0 |
| B | 0 | 16 | 0 |
| C | 0 | 16 | 0 |
| D | 0 | 16 | 0 |
| Mode M0 | |||
|---|---|---|---|
| Quadrant | BADHDUFLAG | Total packets | Discarded packets |
| A | 0 | 14288 | 3 |
| B | 0 | 20324 | 2 |
| C | 0 | 14145 | 2 |
| D | 0 | 14814 | 2 |
| Mode SS | |||
|---|---|---|---|
| Quadrant | BADHDUFLAG | Total packets | Discarded packets |
| A | 0 | 142 | 0 |
| B | 0 | 142 | 0 |
| C | 0 | 142 | 0 |
| D | 0 | 142 | 0 |
| Quadrant | Total seconds | Saturated seconds | Saturation percentage |
|---|---|---|---|
| A | 6868 | 128 | 1.863716% |
| B | 6868 | 904 | 13.162493% |
| C | 6868 | 102 | 1.485149% |
| D | 6868 | 114 | 1.659872% |
Noise dominated data is calculated using 1-second bins in cleaned event files. If a bin has >2000 counts, and if more than 50% of those come from <1% of pixels, then it is considered to be noise-dominated and hence unusable.
| Quadrant | # 1 sec bins | Bins with >0 counts | Bins with >2000 counts | High rate bins dominated by noise | Noise dominated (total time) | Noise dominated (detector-on time) | Marked lightcurve |
|---|---|---|---|---|---|---|---|
| A | 8534 | 6869 | 1 | 1 | 0.01% | 0.01% | 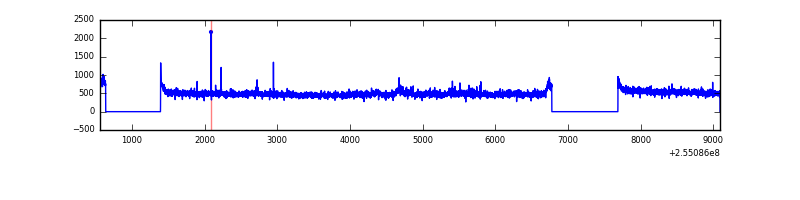 |
| B | 8533 | 6868 | 664 | 664 | 7.78% | 9.67% |  |
| C | 8534 | 6869 | 5 | 5 | 0.06% | 0.07% | 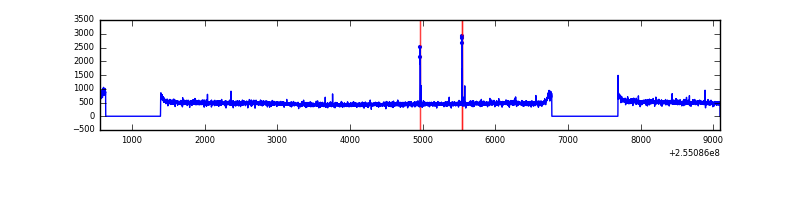 |
| D | 8534 | 6869 | 12 | 12 | 0.14% | 0.17% | 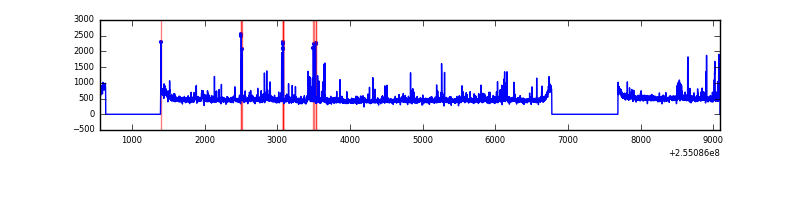 |
Top three noisy pixels from each quadrant. If the there are fewer than three noisy pixels in the level2.evt file, extra rows are filled as -1
| Pixel properties | Quadrant properties | ||||||
|---|---|---|---|---|---|---|---|
| Quadrant | DetID | PixID | Counts | Sigma | Mean | Median | Sigma |
| A | 12 | 189 | 85250 | 478.18 | 863 | 843 | 176.5 |
| A | 8 | 15 | 9767 | 50.55 | 863 | 843 | 176.5 |
| A | 0 | 226 | 7667 | 38.66 | 863 | 843 | 176.5 |
| B | 4 | 239 | 1963167 | 12635.01 | 809 | 791 | 155.3 |
| B | 3 | 209 | 148832 | 953.18 | 809 | 791 | 155.3 |
| B | 3 | 64 | 73523 | 468.29 | 809 | 791 | 155.3 |
| C | 15 | 208 | 15464 | 75.29 | 837 | 846 | 194.1 |
| C | 14 | 234 | 9838 | 46.32 | 837 | 846 | 194.1 |
| C | 13 | 61 | 6067 | 26.89 | 837 | 846 | 194.1 |
| D | 1 | 52 | 147711 | 739.21 | 832 | 813 | 198.7 |
| D | 10 | 199 | 69484 | 345.56 | 832 | 813 | 198.7 |
| D | 13 | 104 | 36788 | 181.03 | 832 | 813 | 198.7 |
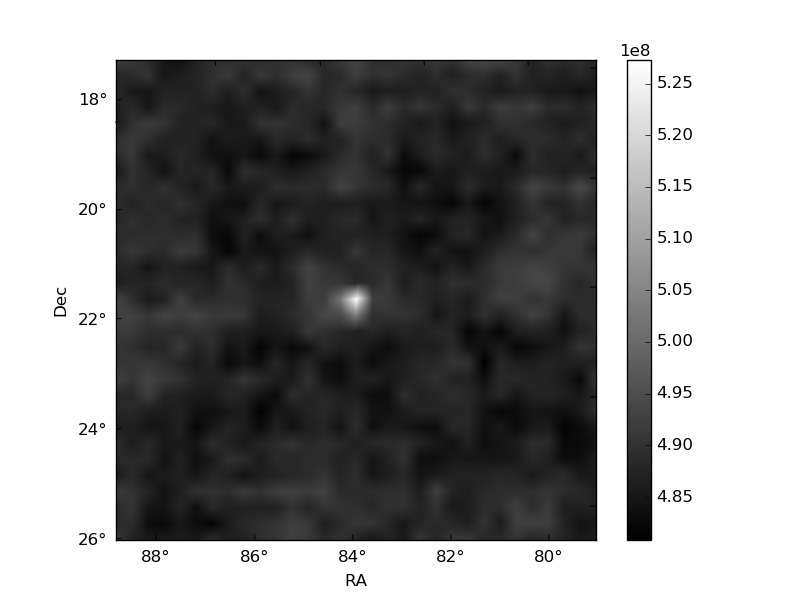
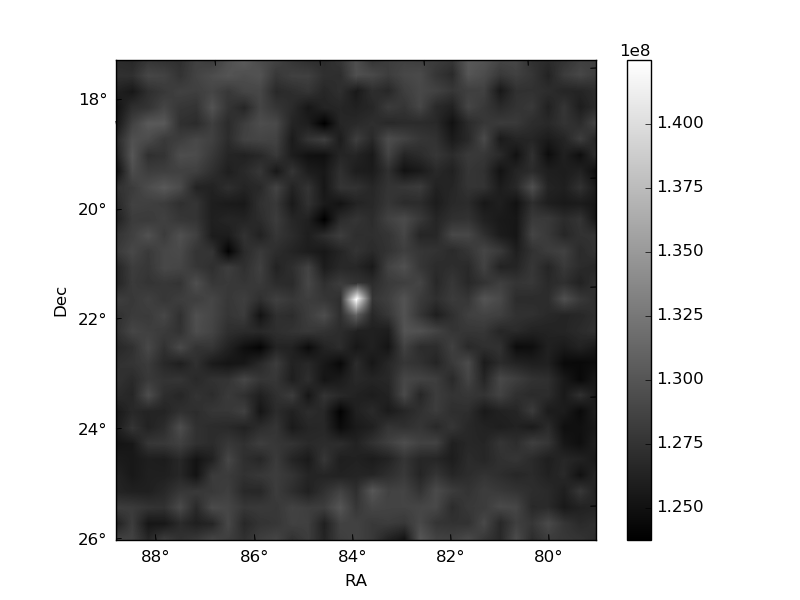
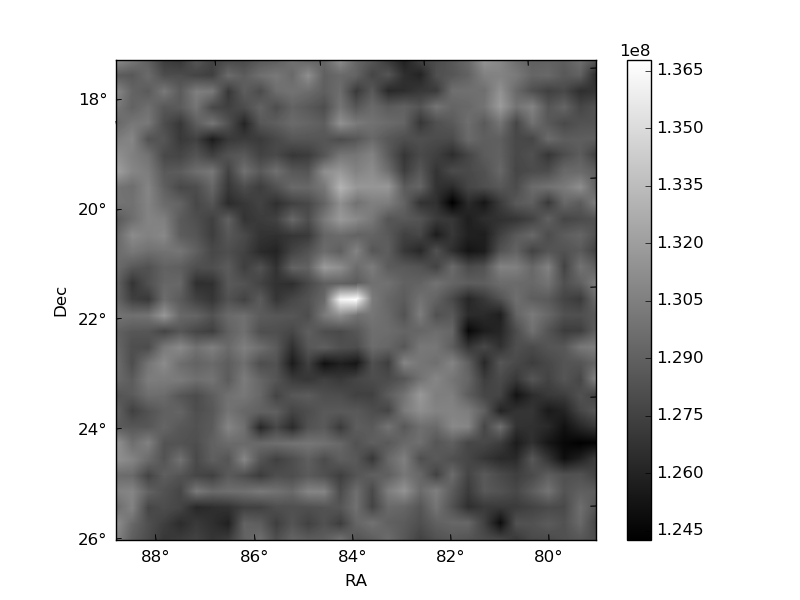
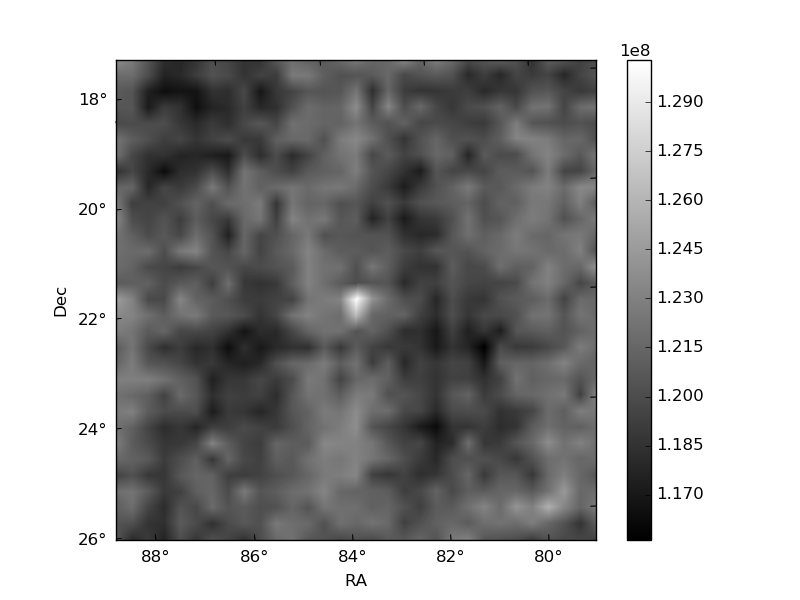
Histogram calculated using DETX and DETY for each event in the final _common_clean file
| Quadrant A | 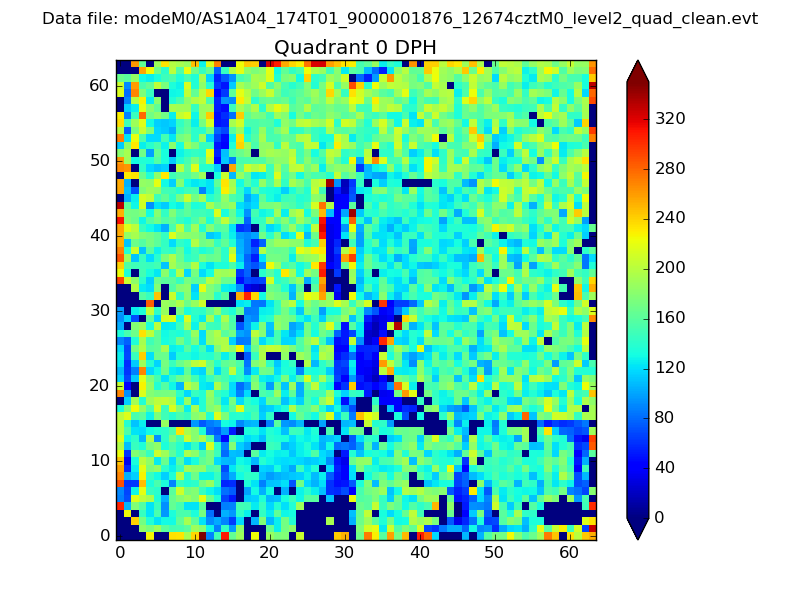 |
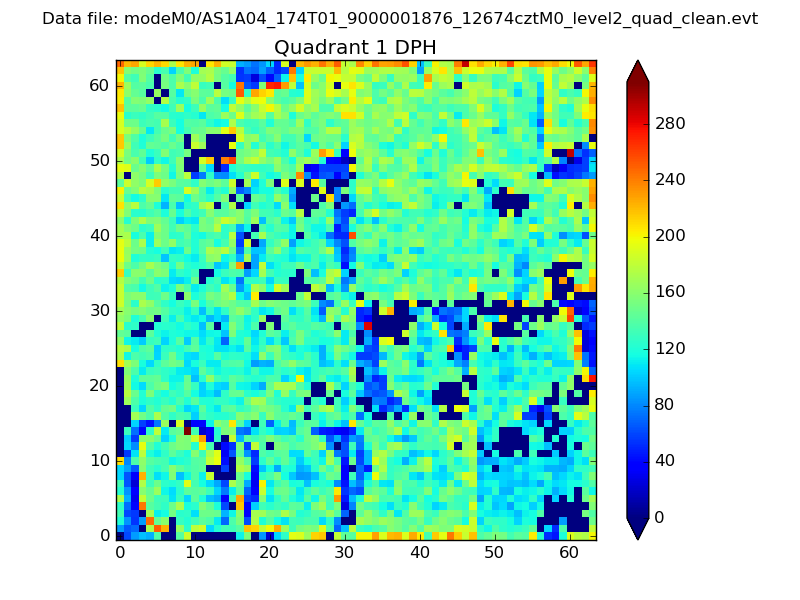 |
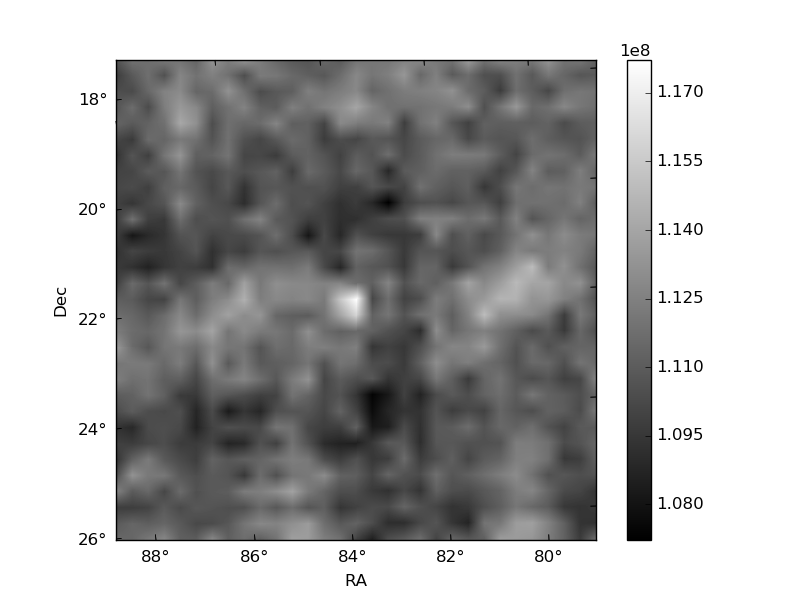
Quadrant B |
|---|---|---|---|
| Quadrant D | 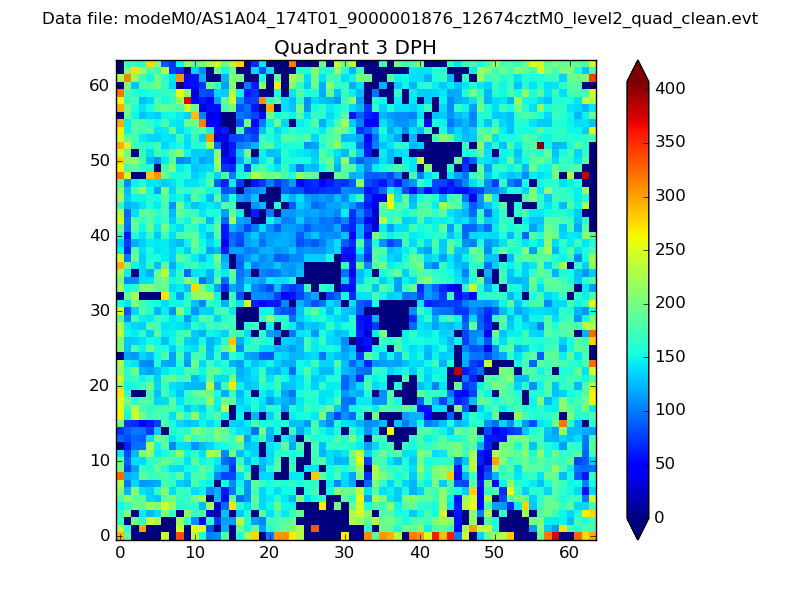 |
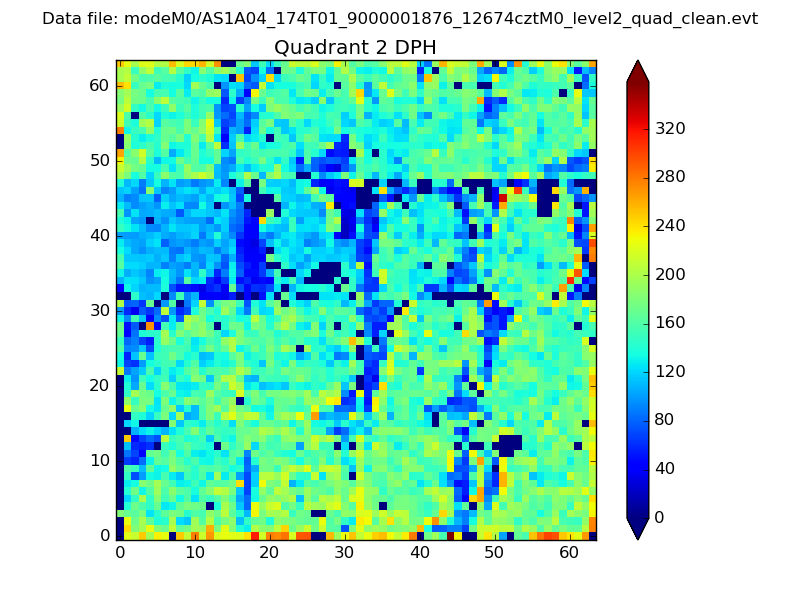 |
Quadrant C |
| Plot type | Count rate plots | Images |
|---|---|---|
| Comparison with Poisson distribution Blue bars denote a histogram of data divided into 1 sec bins. Red curve is a Poisson curve with rate = median count rate of data. |
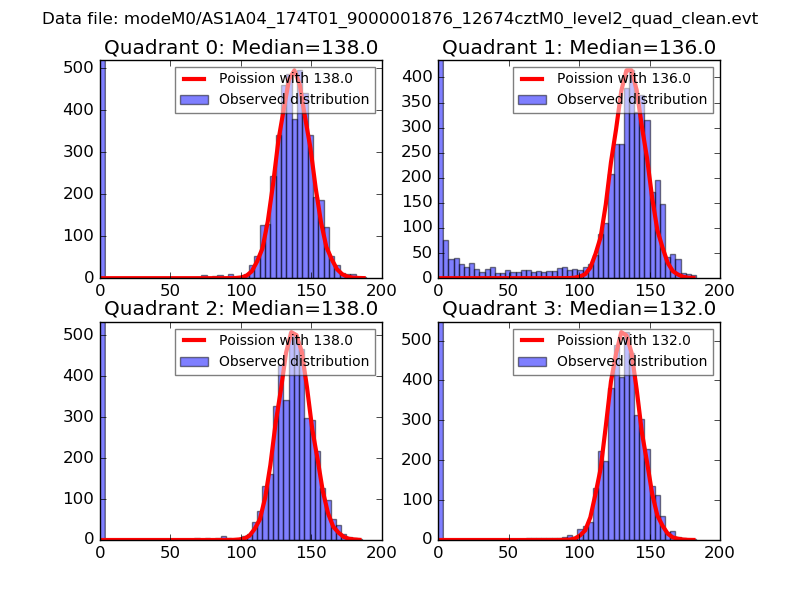 |
 |
| Quadrant-wise count rates Data is divided into 100 sec bins |
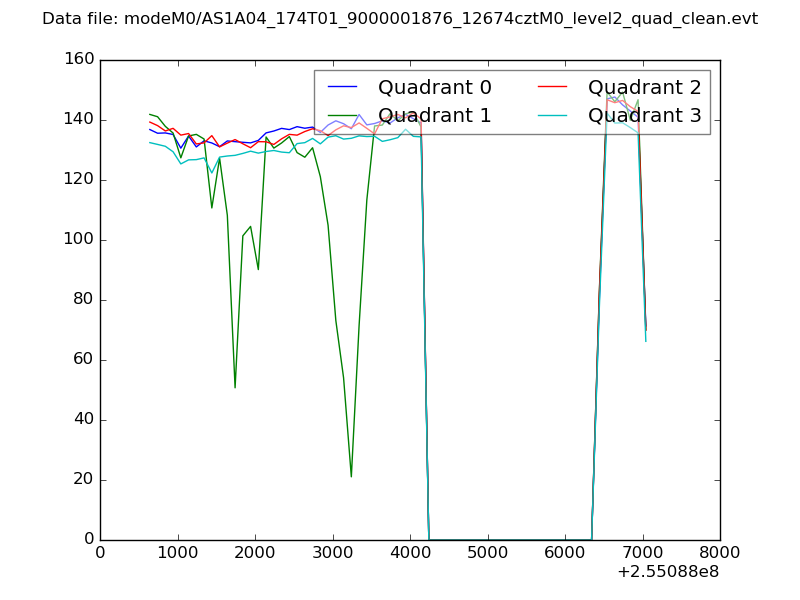 |
|
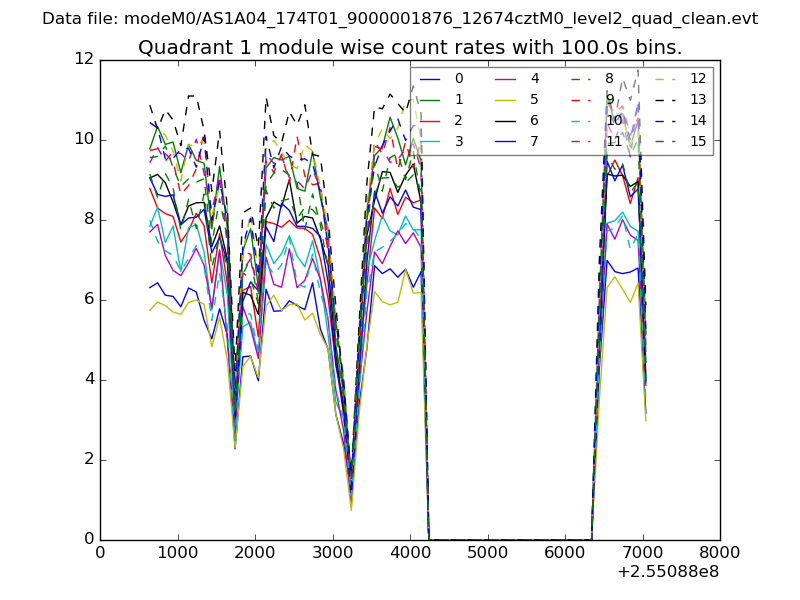
| Module-wise count rates for Quadrant A Data is divided into 100 sec bins |
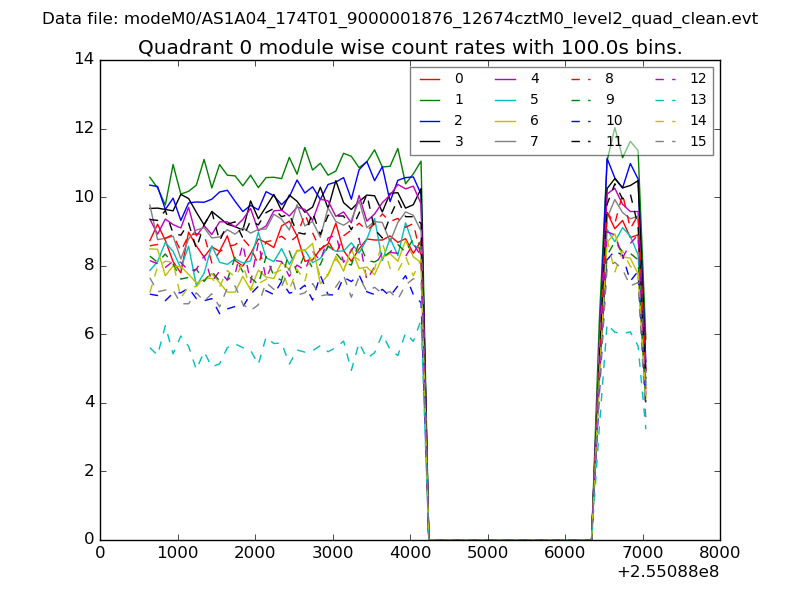 |
 |
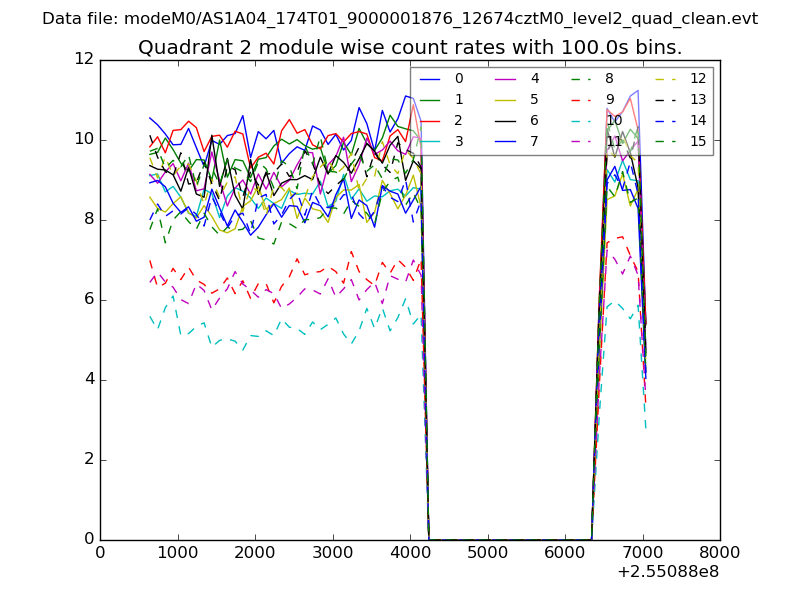
| Module-wise count rates for Quadrant B Data is divided into 100 sec bins |
 |
 |
| Module-wise count rates for Quadrant C Data is divided into 100 sec bins |
 |
 |
| Module-wise count rates for Quadrant D Data is divided into 100 sec bins |
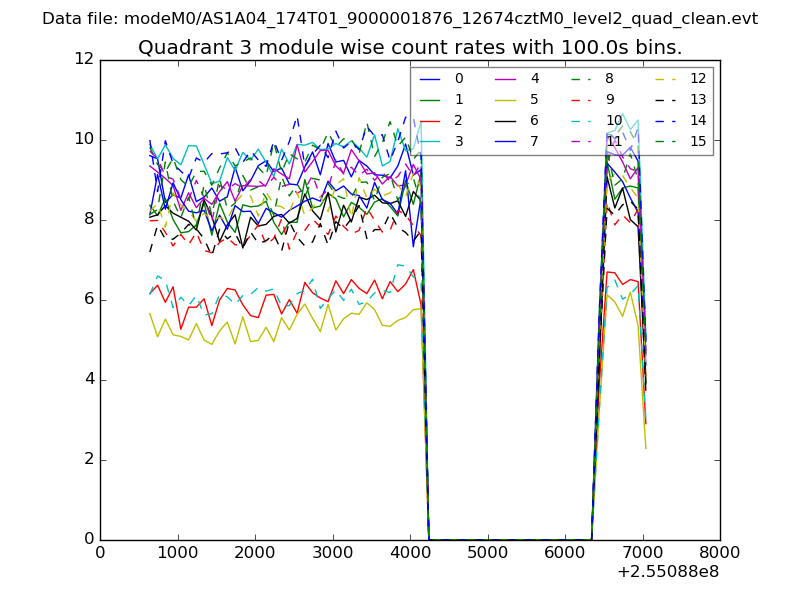 |
 |
| Parameter | Plot |
|---|---|
| CZT HV Monitor | 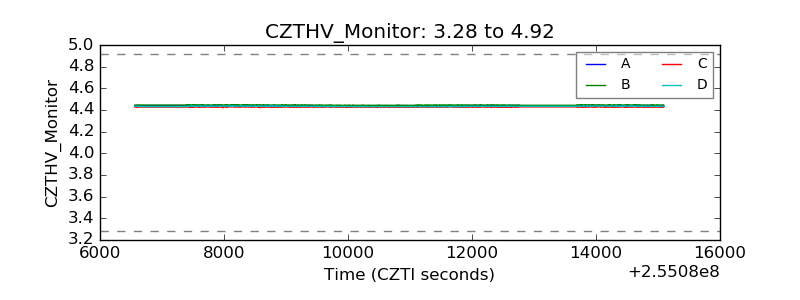 |
| D_VDD | 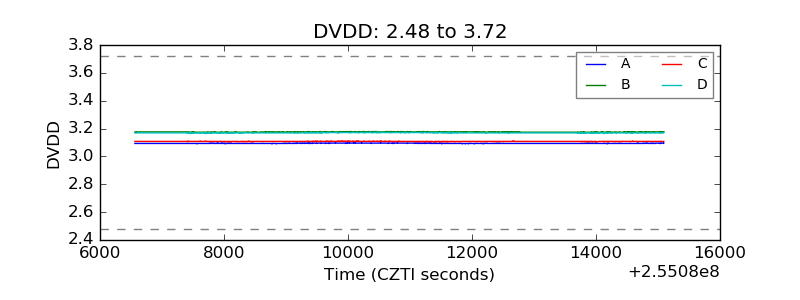 |
| Temperature 1 | 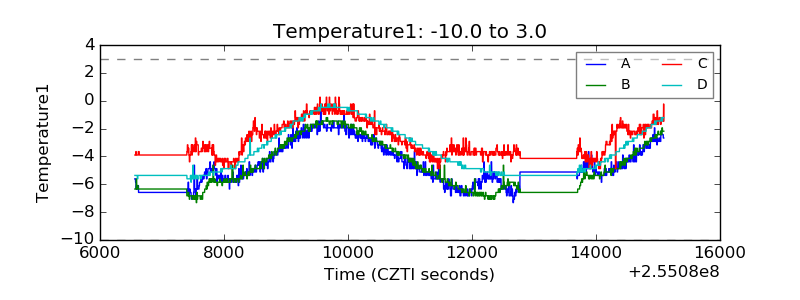 |
| Veto HV Monitor | 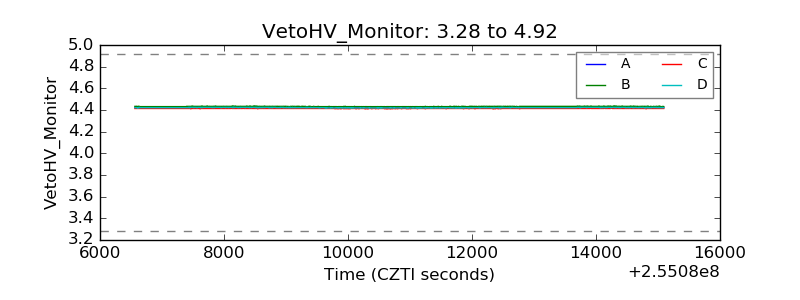 |
| Veto LLD | 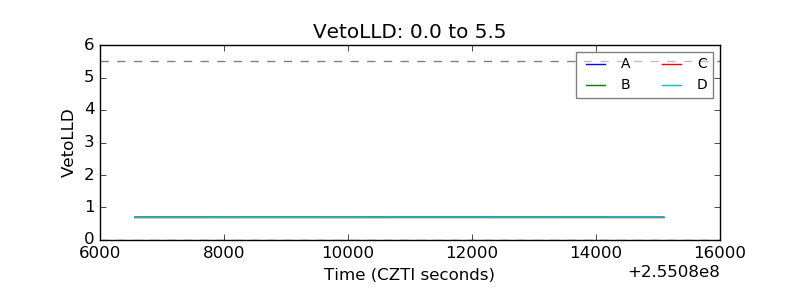 |
| Alpha Counter | 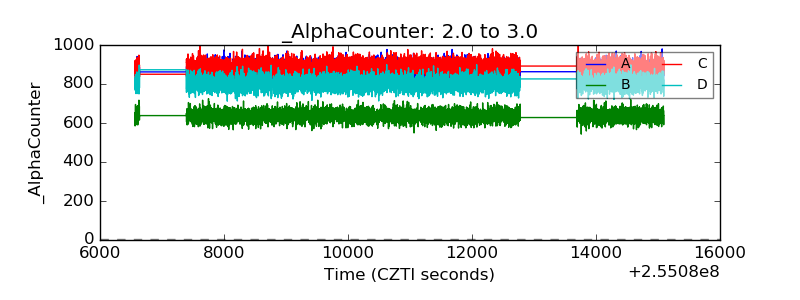 |
| _CPM_Rate | 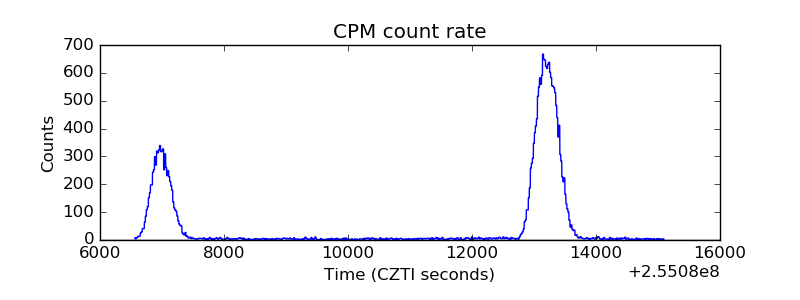 |
| CZT Counter | 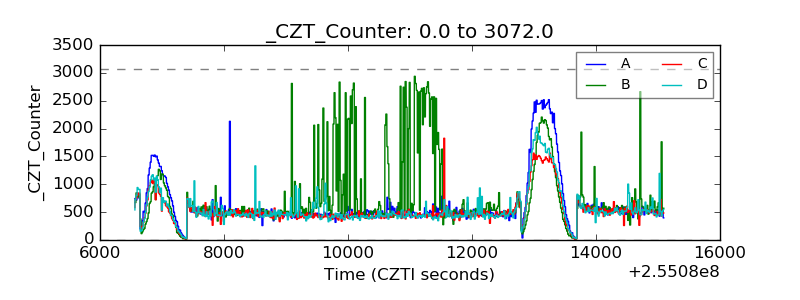 |
| +2.5 Volts monitor |  |
| +5 Volts monitor |  |
| _ROLL_ROT | 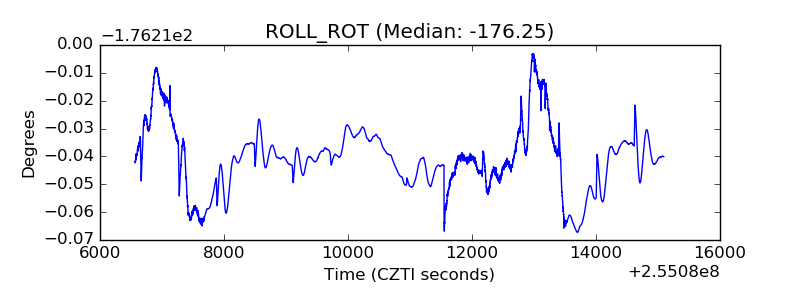 |
| _Roll_DEC | 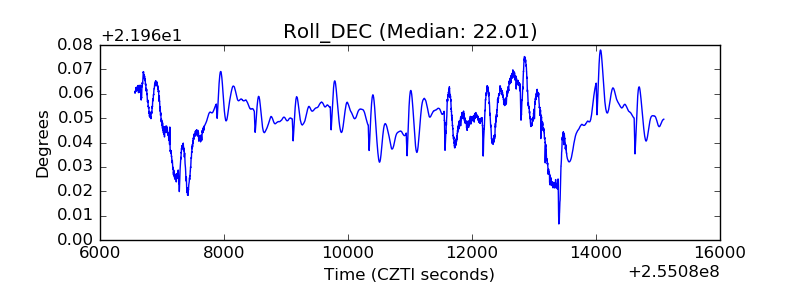 |
| _Roll_RA | 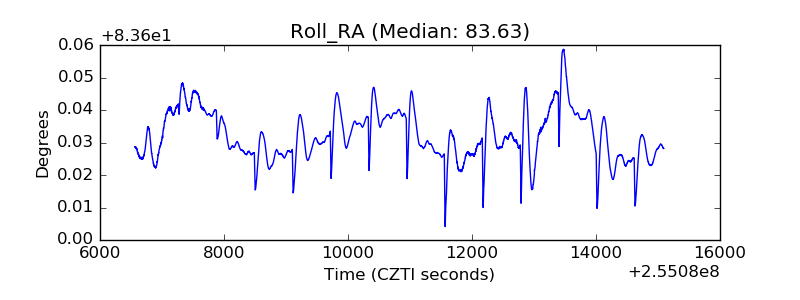 |
| Veto Counter | 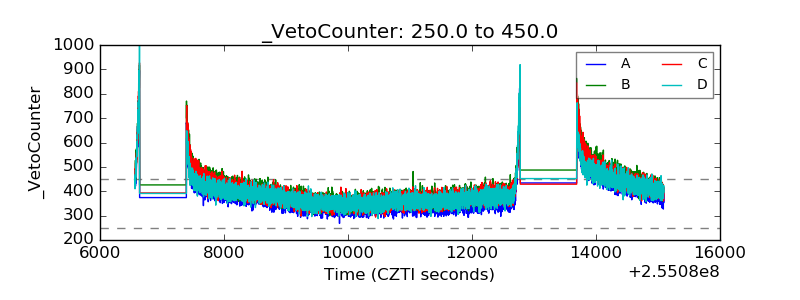 |